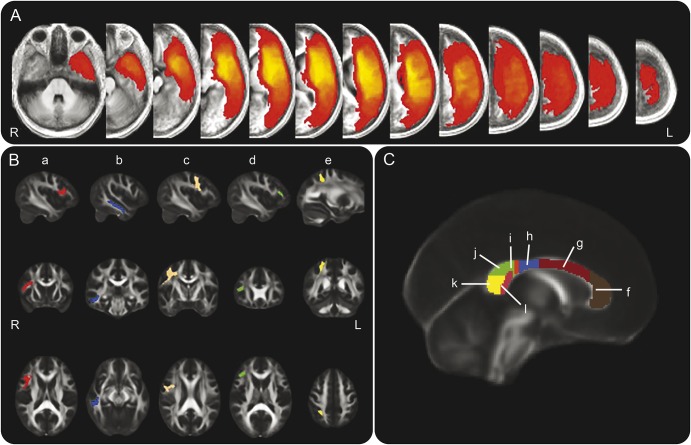
Figure 1. Lesion density map and regions of interest (ROI).
(A) Lesion density map created by summation of all patients' lesion maps. Intensities convey number of patients whose lesions include a given voxel (red = 1; bright yellow = 33). (B) Right hemisphere white matter ROIs used for extracting diffusivity values: (a) right pars opercularis of the inferior frontal gyrus (IFGop) ROI (Brodmann area 44, ROI spans X = 50 to 28, Y = 27 to −4, Z = 27 to 7), (b) right middle temporal gyrus (MTG) ROI (ROI spans X = 59 to 39, Y = −5 to −44, and Z = 4 to −27), (c) right precentral gyrus (PreCG) ROI (ROI spans X = 55 to 6, Y = 10 to −38, and Z = 72 to 10), (d) right pars triangularis of the inferior frontal gyrus ROI (ROI spans X = 46 to 35, Y = 33 to 23, and Z = 21 to 67), (e) right superior parietal lobule ROI (ROI spans Z = 32 to 15, Y = −57 to −38, Z = 62 to 38). All hemispheric ROIs were extracted from the Harvard-Oxford atlas in FSL and thresholded at a fractional anisotropy (FA) value of 0.3 so as to include only white matter. Left hemisphere ROIs were generated using the same Harvard-Oxford regions in the left hemisphere; right and left combined hemispheric ROIs are the summation of 3 individual ROIs in the specified hemisphere: IFGop, MTG, and PreCG (the ROIs which, in the right hemisphere, were significant predictors of speech fluency). (C) Corpus callosum (CC) ROIs corresponding to locations of fibers crossing between the left and right frontal (f), supplementary motor (g), motor (h), somatosensory (i), parietal (j), occipital (k), and temporal (l) areas. The ROI referred to as the entire CC ROI is the sum of these 7 individual ROIs. All CC ROIs were drawn by hand according to a previously published schematic.33 ROIs are displayed overlaid onto FSL's FMRIB-58 FA template. All coordinates are in Montreal Neurological Institute 152 space.

