Abstract
We have evidence that methamphetamine (METH)-induced neuronal death is morphologically necrotic, not apoptotic, as is currently believed, and that electrographic seizures may be responsible. We administered 40 mg/kg i.p. to 12 male C57BL/6 mice and monitored EEGs continuously and rectal temperatures every 15 min, keeping rectal temperatures <41.0 °C. Seven of the 12 mice had repetitive electrographic seizure discharges (RESDs) and 5 did not. The RESDs were often not accompanied by behavioral signs of seizures–i.e., they were often not accompanied by clonic forelimb movements. The 7 mice with RESDs had acidophilic neurons (the H&E light-microscopic equivalent of necrotic neurons by ultrastructural examination) in all of 7 brain regions (hippocampal CA1, CA2, CA3 and hilus, amygdala, piriform cortex and entorhinal cortex), the same brain regions damaged following generalized seizures, 24 h after METH administration. The 5 mice without RESDs had a few acidophilic neurons in 4 of the 7 brain regions, but those with RESDs had significantly more in 6 of the 7 brain regions. Maximum rectal temperatures were comparable in mice with and without RESDs, so that cannot explain the difference between the two groups with respect to METH-induced neuronal death. Our data show that METH-induced neuronal death is morphologically necrotic, that EEGs must be recorded to detect electrographic seizure activity in rodents without behavioral evidence of seizures, and that RESDs may be responsible for METH-induced neuronal death.
Keywords: Electrographic seizures, Excitotoxicity, Methamphetamine, Mouse, Necrosis, Apoptosis
1. Introduction
D-methamphetamine (METH) abuse is a major health problem in this country (Cho and Melega, 2002; Rawson et al., 2002). Until relatively recently, in animal studies the toxic effect of METH on brain was focused on damage to nerve terminals in striatum (Ricaurte et al., 1982; Ricaurte et al., 1984) and not on directly assessing in which brain regions and by what mechanism or mechanisms METH kills neurons. METH can produce neuronal death in brain regions other than striatum (Deng et al., 2001; Schmued and Bowyer, 1997), and METH-induced neuronal death involves excitotoxicity (Cadet et al., 2007).
The morphology of acutely injured neurons in cerebral ischemia (Colbourne et al., 1999), hypoglycemia (Auer et al., 1985a,b) and prolonged epileptic seizures (Fujikawa et al., 1999, 2000) is necrotic, not apoptotic. Cadet and colleagues have suggested that METH-induced neuronal death is apoptotic, based on low-magnification photomicrographs of cells with pyknotic, TUNEL-positive nuclei (Deng et al., 2001). This is precisely the morphology of seizure-induced necrotic neurons (Fujikawa et al., 2002, 1999, 2000, 2007, 2010). We and others have shown that apoptotic neurons have large, usually round chromatin clumps, with relatively early disruption of nuclear membranes (Fujikawa et al., 2000; Ikonomidou et al., 2000, 1999; Ishimaru et al., 1999), so that fragmented DNA mingles with cytoplasm, producing apoptotic neurons with TUNEL-positive cell bodies and TUNEL-negative chromatin clumps (Fujikawa et al., 1999, 2000, 2010) (see also Fig. 3E).
Fig. 3.

Methamphetamine (METH)-treated mice with RESDs have acidophilic neurons in the left piriform cortex (C) that are morphologically distinct from apoptotic neurons (D and E). The control mouse and one without RESDs have normal neuronal nuclei (A and B). C shows acidophilic neurons with shrunken, condensed nuclei and eosinophilic cytoplasm. By way of comparison, (D) and (E) show apoptotic neurons in the retrosplenial cortex of postnatal day 8 (P8) rat pups. In (D) the apoptotic neuron, stained with H&E, shows large, round chromatin clumps that are basophilic; the cytoplasm is eosinophilic. In (E) the apoptotic neuron is TUNEL-positive (yellowish brown), with large, round chromatin clumps that are TUNEL-negative but are stained with the counterstain, methyl green. The double-stranded DNA fragments stained with TUNEL spill out into the entire cell body because the nuclear membrane is disrupted relatively early in apoptotic neurons. The scale bars in (A) and (E) are 10 μm and in (D) the scale bar is 5 μm.
It is recognized that epileptic seizures can occur following METH administration (Bowyer and Ali, 2006; Cadet et al., 2007), but this has relied on behavioral observations alone. In this study we show that seizure-like behavior is not a reliable indication of electrographic seizure activity, that recording EEG activity should be done to determine if seizure discharges are present, and that widespread METH-induced neuronal necrosis only occurs in mice with repetitive electrographic seizure discharges (RESDs).
2. Materials and methods
2.1. Materials
D-methamphetamine HCl was obtained from Sigma-Aldrich (St. Louis, MO, U.S.A.). Eosin Y was purchased from J.T. Baker Company (Philipsburg, NJ, U.S.A.). Hematoxylin and Hemo-De were purchased from Fisher Scientific Company (Pittsburgh, PA, U.S.A.). Paraformaldehyde was obtained from Sigma Chemical Company (St. Louis, MO, U.S.A.). Pentobarbital sodium (50 mg/ml) and ketamine HCl (50 mg/ml) were obtained from the Pharmacy Service at Sepulveda VA Ambulatory Care Center and Nursing Home.
2.2. Experimental protocol
Our experimental protocol was approved by the Animal Studies Subcommittee of the Research and Development Committee of the VA Greater Los Angeles Healthcare System. The guidelines published in the Guide for the Care and Use of Laboratory Animals (National Academy Press, Washington, D.C., 1996) were followed. Every attempt was made to minimize the number of mice used and to minimize their pain and distress.
Male C57BL/6J mice (24–28 g, 8–12 weeks of age, The Jackson Laboratory, Bar Harbor, ME, U.S.A.) were anesthetized with 45 mg/kg of pentobarbital and 25 mg/kg of ketamine i.p. Four stainless steel screws (three for EEG recording) were implanted into mouse skulls and secured with dental acrylic. Three electrode wires attached to a 3-strand wire connector and 3-channel cable were wound around the anterior two and one of the posterior skull screws and secured with dental acrylic. The 3-channel cable was connected to a commutator that in turn was connected to a differential amplifier (World Precision Instruments, Sarasota, FL, U.S.A.), A-D converter (Biopac Systems, Inc., Goleta, CA, U.S.A.) and PC with an AqKnowledge EEG acquisition program (Biopac Systems, Inc.).
Seven days later mice were given 40 mg/kg of free-base D-methamphetamine HCl (METH) or normal saline i.p. EEGs were recorded continuously; behavioral observations and rectal temperatures were recorded every 15 min. Rectal temperatures were measured for at least 4 h after METH or normal saline injection with rectal temperature probes connected to a YSI 73A temperature controller, and were kept below 41.0 °C in mice given METH by placing them on cloth-covered ice packs as needed. Mice were killed with an overdose of pentobarbital (200 mg/kg i.p.) 24 h after METH or normal saline injection. They then underwent transcardiac perfusion with 4% phosphate-buffered paraformaldehyde.
2.3. Tissue processing and hematoxylin and eosin (H&E) staining of brain sections
Brains were kept in situ at 4 °C overnight, after which they were removed and placed in the same perfusate. Brains were placed in a Kopf Brain Blocker and cut in the coronal plane so that the dorsal hippocampus (1.94 mm posterior to bregma) and ventral hippocampus (3.16 mm posterior to bregma) were included in the brain blocks (Paxinos and Watson, 1998). Brain slices were dehydrated, embedded in paraffin, cut into 6-μm-thick coronal sections, rehydrated, and stained with hematoxylin and eosin (H&E). The apoptotic neurons in Fig. 3D and E are unpublished photomicrographs from the retrosplenial cortex of a postnatal day 8 (P8) rat pup, stained with H&E and with TUNEL (terminal deoxynucleotidyl transferase [TdT], biotinylated dUTP nick-end labeling) and methyl green counterstain, respectively. TUNEL labels double-stranded DNA fragments (Gavrielli et al., 1992). Our protocol of obtaining neonatal cortical tissue for staining of apoptotic neurons with H & E and TUNEL and the TUNEL staining procedure itself has previously been published (Fujikawa et al., 2000).
2.4. Semi-quantitative assessment of normal and acidophilic neurons
The semi-quantitative assessment of normal and acidophilic (necrotic) neurons in four hippocampal subregions (CA1, CA2, CA3 and hilus) and in amgydala, piriform cortex and entorhinal cortex) was performed as we have described previously for rats (Fujikawa, 1995, 1996, 1994, 2002, 1999, 2000, 2007, 2010; Zhao et al., 2010). We estimated the numbers of acidophilic neurons on a 0–3 grading scale, 0 = none, 0.5 = slight (<10%), 1.0 = mild (10–25%), 1.5 = mild-to-moderate (26–45%), 2.0 = moderate (46–54%), 2.5 = moderate-to-severe (55–75%), and 3.0 = severe (>75%), as previously published (Fujikawa, 1995, 1996, 1994, 2002, 1999, 2000, 2007, 2010; Zhao et al., 2010).
2.5. Statistical analysis
The damage score data conformed to a Poisson distribution rather than a normal curve, so in consultation with our longtime statistical consultant, Dr. Jeffrey Gornbein (see Acknowledgments), we performed a two-factor (group and brain region) analysis of deviance, with post-hoc t-tests using pooled S.D.s and α = 0.05, as we did in a recently published article (Fujikawa et al., 2010). The maximal rectal temperature (Tmax) data were analyzed with a one-factor (group) ANOVA, with post-hoc t-tests using the pooled standard deviation. In addition, Spearmann and Pearson correlation analyses were used to compare Tmax to maximal damage scores and the number of brain regions damaged.
3. Results
3.1. Methamphetamine-treated mice can develop repetitive electrographic seizure discharges (RESDs)
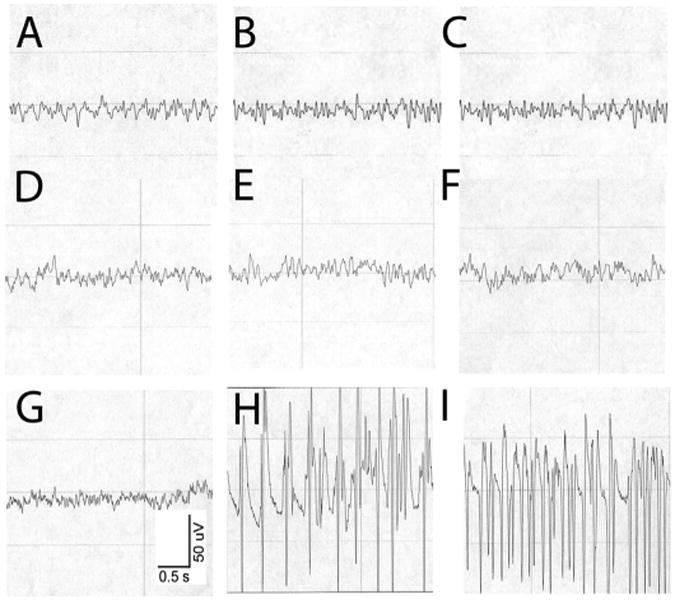
Of 12 methamphetamine (METH)-treated mice, 7 developed repetitive electrographic seizure discharges (RESDs) (Fig. 1). The latency to the first seizure, the total duration of RESDs and the total time RESDs were present are summarized in Table 1. Four of the 7 mice with RESDs had no behavioral evidence of seizures, whereas 3 of the 5 mice without RESDs had clonic forelimb movements (Racine seizure stage 3) (Racine, 1972). Thus, clonic forelimb movements are not a reliable indicator of electrographic seizure activity.
Fig. 1.

Methamphetamine (METH) 40 mg/kg s.c. can induce repetitive electrographic seizure discharges (RESDs). (A–C) show EEG activity in a control mouse given normal saline. (A) is the baseline recording, (B) is the recording 30 min after saline injection and (C) is the recording 60 min after saline injection. All show low voltage, mixed frequency activity. (D–F) show EEG activity in a mouse given METH that did not develop RESDs. (D) is the baseline recording, (E) is the recording 30 min and (F) is the recording 60 min after METH injection. The EEG activity is similar to that of the control mouse. (G–I) show the EEG activity in a mouse given METH that developed RESDs. (G) is the baseline recording, (H) shows high-amplitude repetitive 5-Hz spike-wave discharges 39 min after METH injection, and I shows repetitive 14-Hz spike-wave discharges 76 min after METH injection. This mouse had intermittent bursts of RESDs over a 37-min period.
Table 1.
Repetitive electrographic seizure discharge (RESD) latency and duration.
| Latency from methamphetamine injection to first electrographic seizure discharge | 48 ± 15 min |
| Total duration of RESDs | 8.5 ± 4.2 min |
| Total time RESDs present | 321 ± 124 min |
The data represent means ± S.E.M.s in 7 mice.
3.2. Methamphetamine-treated mice with RESDs show irreversibly damaged acidophilic neurons
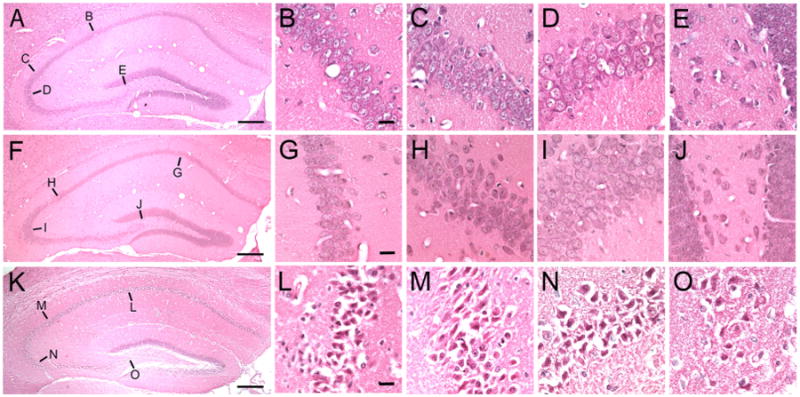
Acidophilic neurons are shrunken, with pyknotic nuclei and eosinophilic cytoplasm by hematoxylin and eosin (H&E) stain, and are the light-microscopic equivalent of necrotic neurons shown by electron microscopy (Fujikawa et al., 1999, 2000, 2010). Fig. 2A, D and G, show normal neurons in the hippocampal CA3, CA1 and hilus of control mice, METH-treated mice without RESDs (B, E and H) and acidophilic neurons in METH-treated mice with RESDs (C, F and I). The acidophilic neurons in C, F and I are shrunken, with pyknotic (shrunken), condensed nuclei and eosinophilic cytoplasm.
Fig. 2.

Methamphetamine (METH)-treated mice with RESDs have acidophilic neurons in hippocampus. (A), (F) and (K) are low magnification photomicrographs of the right dorsal hippocampus in control (A), METH-treated mice without RESDs (F) and METH-treated mice with RESDs (K). In (A), (B) through (E) are the CA1, CA2, CA3 and dentate hilar regions from which the high magnification photomicrographs (B–E) were taken (the lines point to the approximate areas in (A), (F) and (K)). In (F), (G) through (J) and in (K), (L) through (O) point to the CA1-CA3 and hilar regions from which the high magnification photomicrographs were taken. (A), (F) and (K) were taken from the same mice whose EEGs are shown in Fig. 1. The shrunken acidophilic neurons can be clearly distinguished from the normal neurons in the control mouse and the mouse given METH without RESDs. The scale bars in (A), (F) and (K)=400 μm and the scale bars in (B), (G) and (L) = 10 μm.
3.3. The acidophilic neurons are necrotic, not apoptotic
Fig. 3 shows normal neurons in the left piriform cortex in a control mouse, a mouse without RESDs and a mouse with RESDs, respectively (Fig. 3A–C). The morphological difference between necrotic neurons in the left piriform cortex (Fig. 3C) and apoptotic neurons from postnatal day 8 (P8) rat pups (Fig. 3D and E) is readily apparent. The acidophilic neurons in C are shrunken, with pyknotic, condensed nuclei and eosinophilic cytoplasm. The apoptotic neuron in D, stained with H&E, has large, round basophilic chromatin clumps; the rest of the cell is eosinophilic. In E the apoptotic neuron has large, round chromatin clumps that are TUNEL-negative but stain with the counterstain, methyl green. The entire cell body except for the chromatin clumps stain with TUNEL because the nuclear membrane is disrupted relatively early in the apoptotic process and the double-stranded DNA fragments spill out from the nucleus into the rest of the cell.
3.4. Methamphetamine-treated mice with RESDs have acidophilic neurons in 7 brain regions
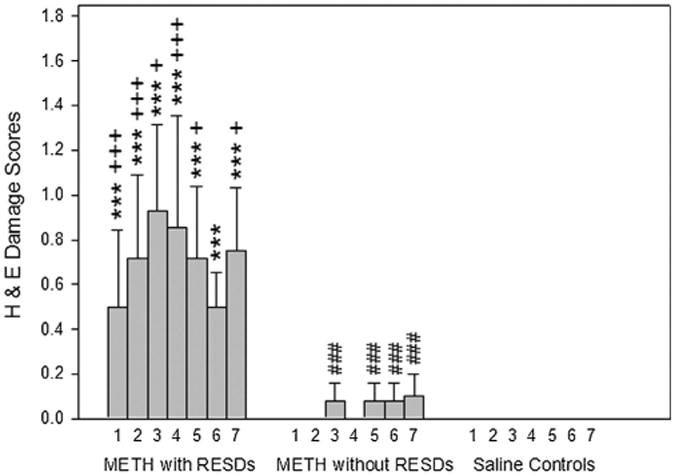
The semi-quantitative damage scores in 7 brain regions of METH-treated mice with RESDs are contrasted with those of METH-treated mice without RESDs and controls in Fig. 4. Although there were a few acidophilic neurons in hippocampal CA3a, amygdala, piriform cortex and entorhinal cortex in METH-treated mice without RESDs, there were significantly more acidophilic neurons in all of the brain regions except piriform cortex in METH-treated mice with RESDs compared to those without RESDs. None of the control mice treated with normal saline had acidophilic neurons in any of the 7 brain regions.
Fig. 4.

Methamphetamine (METH)-treated mice with RESDs have acidophilic neurons in 7 of the brain regions that they are found following seizure-induced neuronal necrosis. The number 1 is CA1, 2 is CA2, 3 is CA3, 4 is hilus, 5 is amygdala, 6 is piriform cortex and 7 is entorhinal cortex. ***p < 0.001 compared to control regions, +++p < 0.001, +p < 0.05 compared to brain regions of mice without SREDs, and ###p < 0.001 compared to control regions.
3.5. Maximal rectal temperatures did not differ between methamphetamine-treated mice with and without RESDs
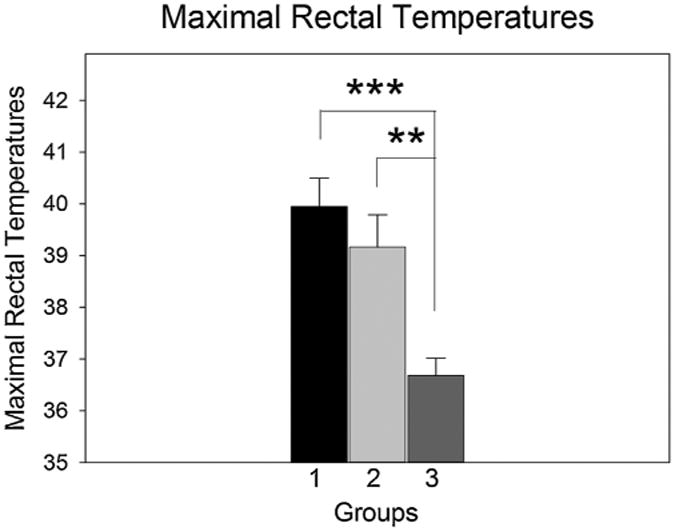
The maximal rectal temperature (Tmax) in METH-treated mice with RESDs was significantly higher than in control mice, but it did not differ significantly from METH-treated mice without RESDs (Fig. 5). Spearmann and Pearson correlation analyses showed that Tmax was not correlated with either the maximal damage score or the number of brain regions damaged.
Fig. 5.

The maximal rectal temperatures of mice with and without RESDs were significantly higher than controls but did not differ significantly from each other. Number 1 is the group with RESDs, 2 is the group without RESDs and 3 is the control group. ***p < 0.01, **p < 0.01 compared to the control group.
4. Discussion
In this study we found that morphologically necrotic neurons are found in seven brain regions 24 h following METH administration in mice with RESDs but not in mice without RESDs, and that there was no significant difference in maximum rectal temperatures in the two groups. Previous METH studies have shown Fluoro-Jade-positive neurons in hippocampus, hippocampal “remnants” (Schmued and Bowyer, 1997), amygdala and hippocampus (Bowyer and Ali, 2006) and parietal cortex in rats (Eisch et al., 1998). This method cannot provide the information about the nucleus that the H&E stain provides, but the outline of the shrunken neurons conforms to what we have found in acidophilic neurons, which are by ultrastructural examination necrotic (Fujikawa et al., 2002, 1999, 2000). A previous study claimed that apoptotic neurons were induced by METH, but they showed pyknotic nuclei that were TUNEL-positive, which is a finding characteristic of necrotic, not apoptotic neurons (Fujikawa et al., 2002, 1999, 2000).
Previous studies have used behavioral observations to infer that seizures were produced by METH (Schmued and Bowyer, 1997; Bowyer and Ali, 2006). We have found, however, that the classic stages originally described in kindled rats (Racine, 1972), and which are clearly seen in rats with chemically induced seizures, are difficult to discern in METH-treated mice. They exhibit hyperactivity, “jitteriness” and fine tremors, and may or may not show clonic forelimb jerks (clonus), which occur in stage 3 seizures in rats (Racine, 1972). In mice given METH, clonic jerks are not a reliable indication of whether RESDs are present or not, which can only be ascertained by recording EEGs.
A previous METH study using C57BL/6 mice showed blood– brain barrier disruption, IgG immunoreactivity and Fluoro-Jade C staining of degenerating neurons in amgydala and hippocampus in mice with body temperatures >40.0 °C and behavioral seizures, consisting primarily of forelimb clonus (Racine stage 3 seizure activity) (Bowyer and Ali, 2006). The authors pointed out that it was those mice that were hyperthermic (>40.0 °C) that developed behavioral seizures and had evidence of blood–brain barrier disruption, IgG IR and Fluoro-Jade C-positive neurons (Bowyer and Ali, 2006). In this regard, the average Tmax of mice with RESDs in our study was 40.0 °C and that of mice without RESDs was 39.2 °C, neither of which was >40 °C, and which were not significantly different from each other (Fig. 5).
METH-induced neuronal death is morphologically necrotic, and since neuronal necrosis is an excitotoxic, programmed, caspase-independent cell death (Fujikawa, 2010), it is likely that this also applies to METH-induced neuronal necrosis. RESDs may be responsible for METH-induced neuronal necrosis, and either early NMDA-receptor blockade or anti-epileptic drug administration could be neuroprotective. We plan to investigate these possibilities.
Acknowledgments
Our study was supported by a VA Merit Review grant (I01-BX001858), the VA Greater Los Angeles Research and Development Service, the Sepulveda Research Corporation Various Donors Fund and the UCLA Department of Neurology Academic Enrichment Fund. Dr. Jeffrey Gornbein, a UCLA biomathematical statistician, provided expert assistance in the statistical analysis of data.
References
- Auer RN, et al. The temporal evolution of hypoglycemic brain damage. I. Light- and electron-microscopic findings in the rat cerebral cortex. Acta Neuropathol (Berl) 1985a;67:13–24. doi: 10.1007/BF00688120. [DOI] [PubMed] [Google Scholar]
- Auer RN, et al. The temporal evolution of hypoglycemic brain damage. II. Light- and electron-microscopic findings in the hippocampal gyrus and subiculum of the rat. Acta Neuropathol (Berl) 1985b;67:25–36. doi: 10.1007/BF00688121. [DOI] [PubMed] [Google Scholar]
- Bowyer JF, Ali S. High doses of methamphetamine that cause disruption of the blood–brain barrier in limbic regions produce extensive neuronal degeneration in mouse hippocampus. Synapse. 2006;60:521–532. doi: 10.1002/syn.20324. [DOI] [PubMed] [Google Scholar]
- Cadet JL, et al. Neurotoxicity of substituted amphetamines: molecular and cellular mechanisms. Neurotox Res. 2007;11:183–202. doi: 10.1007/BF03033567. [DOI] [PubMed] [Google Scholar]
- Cho AK, Melega WP. Patterns of methamphetamine abuse and their consequences. J Addict Dis. 2002;21:21–34. doi: 10.1300/j069v21n01_03. [DOI] [PubMed] [Google Scholar]
- Colbourne F, et al. Electron microscopic evidence against apoptosis as the mechanism of neuronal death in global ischemia. J Neurosci. 1999;19:4200–4210. doi: 10.1523/JNEUROSCI.19-11-04200.1999. [DOI] [PMC free article] [PubMed] [Google Scholar]
- Deng X, et al. Methamphetamine causes widespread apoptosis in the mouse brain: evidence from using an improved TUNEL histochemical method. Brain Res Mol Brain Res. 2001;93:64–69. doi: 10.1016/s0169-328x(01)00184-x. [DOI] [PubMed] [Google Scholar]
- Eisch AJ, et al. Characterizing cortical neuron injury with Fluoro-Jade labeling after a neurotoxic regimen of methamphetamine. Synapse. 1998;30:329–333. doi: 10.1002/(SICI)1098-2396(199811)30:3<329::AID-SYN10>3.0.CO;2-V. [DOI] [PubMed] [Google Scholar]
- Fujikawa DG. The neuroprotective effect of ketamine administered after status epilepticus onset. Epilepsia. 1995;36:186–195. doi: 10.1111/j.1528-1157.1995.tb00979.x. [DOI] [PubMed] [Google Scholar]
- Fujikawa DG. The temporal evolution of neuronal damage from pilocarpine-induced status epilepticus. Brain Res. 1996;725:11–22. doi: 10.1016/0006-8993(96)00203-x. [DOI] [PubMed] [Google Scholar]
- Fujikawa DG. Acute Neuronal Injury: The Role of Excitotoxic Programmed Cell Death Mechanisms. Springer; New York: 2010. p. 306. [Google Scholar]
- Fujikawa DG, et al. The competitive NMDA receptor antagonist CGP 40116 protects against status epilepticus-induced neuronal damage. Epilepsy Res. 1994;17:207–219. doi: 10.1016/0920-1211(94)90051-5. [DOI] [PubMed] [Google Scholar]
- Fujikawa DG, et al. Caspase-3 is not activated in seizure-induced neuronal necrosis with internucleosomal DNA cleavage. J Neurochem. 2002;83:229–240. doi: 10.1046/j.1471-4159.2002.01152.x. [DOI] [PubMed] [Google Scholar]
- Fujikawa DG, et al. Lithium-pilocarpine-induced status epilepticus produces necrotic neurons with internucleosomal DNA fragmentation in adult rats. Eur J Neurosci. 1999;11:1605–1614. doi: 10.1046/j.1460-9568.1999.00573.x. [DOI] [PubMed] [Google Scholar]
- Fujikawa DG, et al. Kainic acid-induced seizures produce necrotic, not apoptotic, neurons with internucleosomal DNA cleavage: implications for programmed cell death mechanisms. Neuroscience. 2000;98:41–53. doi: 10.1016/s0306-4522(00)00085-3. [DOI] [PubMed] [Google Scholar]
- Fujikawa DG, et al. Caspase-dependent programmed cell death pathways are not activated in generalized seizure-induced neuronal death. Brain Res. 2007;1135:206–218. doi: 10.1016/j.brainres.2006.12.029. [DOI] [PubMed] [Google Scholar]
- Fujikawa DG, et al. Mild as well as severe insults produce necrotic, not apoptotic, cells: evidence from 60-min seizures. Neurosci Lett. 2010;469:333–337. doi: 10.1016/j.neulet.2009.12.022. [DOI] [PubMed] [Google Scholar]
- Gavrielli Y, et al. Identification of programmed cell death in situ via specific labeling of nuclear DNA fragmentation. J Cell Biol. 1992;119:493–501. doi: 10.1083/jcb.119.3.493. [DOI] [PMC free article] [PubMed] [Google Scholar]
- Ikonomidou C, et al. Ethanol-induced apoptotic neurodegeneration and fetal alcohol syndrome. Science. 2000;287:1056–1060. doi: 10.1126/science.287.5455.1056. [DOI] [PubMed] [Google Scholar]
- Ikonomidou C, et al. Blockade of NMDA receptors and apoptotic neurodegeneration in the developing brain. Science. 1999;283:70–74. doi: 10.1126/science.283.5398.70. [DOI] [PubMed] [Google Scholar]
- Ishimaru MJ, et al. Distinguishing excitotoxic from apoptotic neurodegeneration in the developing rat brain. J Comp Neurol. 1999;408:461–476. [PubMed] [Google Scholar]
- Paxinos G, Watson C. The Rat Brain in Stereotaxic Coordinates. Academic Press, Inc.; San Diego, CA: 1998. [Google Scholar]
- Racine RJ. Modification of seizure activity by electrical stimulation. II. Motor seizure. Electroencephalogr Clin Neurophysiol. 1972;32:281–294. doi: 10.1016/0013-4694(72)90177-0. [DOI] [PubMed] [Google Scholar]
- Rawson RA, et al. Treatment of methamphetamine use disorders: an update. J Subst Abuse Treat. 2002;23:145–150. doi: 10.1016/s0740-5472(02)00256-8. [DOI] [PubMed] [Google Scholar]
- Ricaurte GA, et al. Dopamine nerve terminal degeneration produced by high doses of methylamphetamine in the rat brain. Brain Res. 1982;235:93–103. doi: 10.1016/0006-8993(82)90198-6. [DOI] [PubMed] [Google Scholar]
- Ricaurte GA, et al. Further evidence that amphetamines produce long-lasting dopamine neurochemical deficits by destroying dopamine nerve fibers. Brain Res. 1984;303:359–364. doi: 10.1016/0006-8993(84)91221-6. [DOI] [PubMed] [Google Scholar]
- Schmued LC, Bowyer JF. Methamphetamine exposure can produce neuronal degeneration in mouse hippocampal remnants. Brain Res. 1997;759:135–140. doi: 10.1016/s0006-8993(97)00173-x. [DOI] [PubMed] [Google Scholar]
- Zhao S, et al. Nuclear translocation of mitochondrial cytochrome c, lysosomal cathepsins B and D, and three other death-promoting proteins within the first 60 minutes of generalized seizures. J Neurosci Res. 2010;88:1727–1737. doi: 10.1002/jnr.22338. [DOI] [PubMed] [Google Scholar]


