Abstract
We report on the design, fabrication, and first tests of a tomographic scanner developed for proton computed tomography (pCT) of head-sized objects. After extensive preclinical testing, pCT is intended to be employed in support of proton therapy treatment planning and pre-treatment verification in patients undergoing particle-beam therapy. The scanner consists of two silicon-strip telescopes that track individual protons before and after the phantom, and a novel multistage scintillation detector that measures a combination of the residual energy and range of the proton, from which we derive the water equivalent path length (WEPL) of the protons in the scanned object. The set of WEPL values and the associated paths of protons passing through the object over a 360° angular scan are processed by an iterative, parallelizable reconstruction algorithm that runs on modern GP-GPU hardware. In order to assess the performance of the scanner, we have performed tests with 200 MeV protons from the synchrotron of the Loma Linda University Medical Center and the IBA cyclotron of the Northwestern Medicine Chicago Proton Center. Our first objective was calibration of the instrument, including tracker channel maps and alignment as well as the WEPL calibration. Then we performed the first CT scans on a series of phantoms. The very high sustained rate of data acquisition, exceeding one million protons per second, allowed a full 360° scan to be completed in less than 10 minutes, and reconstruction of a CATPHAN 404 phantom verified accurate reconstruction of the proton relative stopping power in a variety of materials.
Keywords: Biomedical imaging, Calorimetry, Computed tomography, Data acquisition, Particle tracking, Reconstruction algorithms, Silicon radiation detectors
I. Introduction
Low dose proton CT (pCT) is an evolving technology that promises to improve proton therapy planning by addressing the range uncertainty problem as well as by providing artifact-free images for verification and adaptive therapy at the time of treatment. Even though the history of proton radiography and tomography goes back half a century, no clinical system yet exists for pCT. Modern technologies for particle detectors and computation now hold great promise to realize a system that can rapidly generate measurements of integrated proton relative stopping power (RSP) used to reconstruct a 3-D map of RSP values to be input into a treatment planning system. Reference [1] gives an in-depth review of the history of pCT as well as the current state of the technology, which remains to be thoroughly evaluated before it can be implemented in clinical routine.
Our pCT Collaboration has developed in sequence increasingly faster pCT scanners [2]. Most recently we have built and successfully operated a Phase-II scanner [3] that measures individually more than a million protons per second, ten to a hundred times faster than our previous Phase-I device [4]. This is the first proton-CT system capable of completing a full scan of half of a human head in less than 10 minutes while measuring individual protons, a performance level that will allow us to complete a full performance evaluation of this new modality with phantoms before testing it on animals. Here we report on the hardware implementation and initial testing.
See Figure 1 for a conceptual depiction of the scanner. In our tests carried out using the synchrotron of the Loma Linda University Medical Center (LLUMC) [5], we obtained a beam spread across the aperture of the device by scattering the protons in a 2 mm thick lead foil immediately upon their exit from the beam pipe, typically about 3 m upstream from the scanner. The intensity of the beam is set to a very low value, such that in a 118 ns window (the synchrotron RF period at 200 MeV kinetic energy) the average number of protons is much less than one. An initial tracking detector measures the incoming proton position and direction, while a second identical tracking detector measures the proton as it exits the phantom being imaged. From the tracking measurements the most-likely-path (MLP) of the proton through the phantom is estimated [6]. Following the second tracking detector is a final detector in which the proton stops and which measures the proton residual range and energy.
Figure 1.
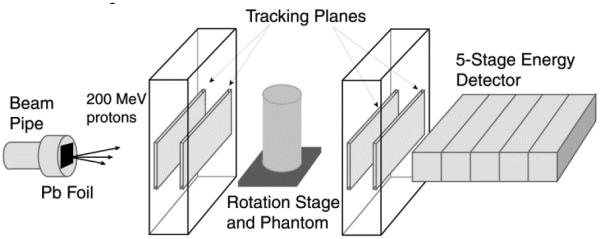
A schematic depiction of the Phase-II head scanner, including the lead foil used at LLUMC to scatter the proton beam across the system aperture.
Our implementation of the Phase-II scanner (Figure 2) is based on two silicon-strip tracking-detector modules, an energy/range detector composed of five scintillator stages, a rotating stage for the phantom, and a custom high-speed data acquisition system. The active aperture is about 88 mm by 350 mm. The tracking system and the 5-stage detector measure respectively the MLP and the corresponding water-equivalent path length (WEPL), which is equivalent to an integral of the RSP along the MLP. The stage rotates the phantom during a scan, typically in 4° steps with two to four million protons per step, giving 90 views from which a 3-dimensional map of the phantom’s RSP is reconstructed.
Figure 2.
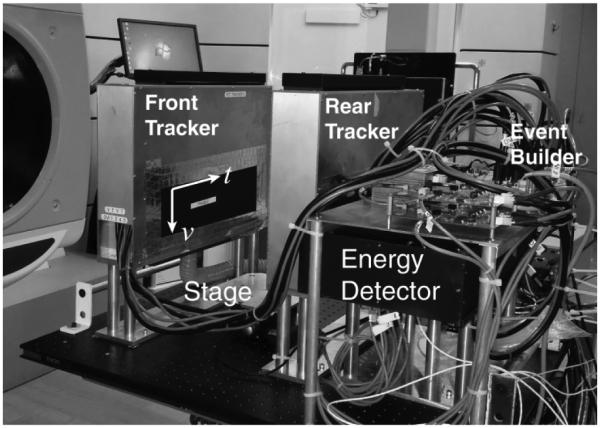
Photograph of the Phase-II pCT scanner in a proton beam line at the Northwestern Medicine Chicago Proton Center.
Since the 5-stage detector has no lateral segmentation, it can effectively analyze only a single proton per accelerator RF period. Therefore, we must reject events with two or more proton tracks detected, which effectively limits the practical event rate to not much more than a megahertz. Thus the accelerator must be operated at a very low intensity of about one proton per nine RF periods on average. The tracking detectors, however, are finely segmented and can separately measure multiple simultaneous protons. Therefore, RF periods in which two or more protons arrive are readily detected by the multiple tracks as well as by unusually large signals in the 5-stage detector.
We use a right-handed detector coordinate system t, u, v, where the u coordinate points along the proton beam direction and the v coordinate points downward (see Figure 2). Each of the two tracking detectors measures two coordinates in the v, u plane and two in the t, u plane, to give the incoming and outgoing vectors. The 5-stage detector consists of five consecutive plastic scintillator stages read out by photomultiplier tubes (PMTs). The PMT signals are digitized at 65 MHz. In normal running, however, the samples are summed in FPGAs located on the digitizer boards before sending the data to the data-acquisition event builder, to minimize the data volume and facilitate the required megahertz event rate.
II. Tracking Detector
The tracking detector is based upon well-established silicon-strip detector (SSD) technology, which is also used by several other contemporary efforts in pCT [7][8][9]. SSDs are nearly ideal candidates for the tracking portion of a pCT system. The relatively high cost per square centimeter of the sensors (compared to plastic scintillators, for example) is more than offset by their high performance, reliability, stability, and ease of assembly. Furthermore, the sensor cost would be a minor portion of the overall cost of a clinical system. SSDs offer the following attractive characteristics, demonstrated in very large systems such as the Fermi-LAT Gamma-ray Space Telescope [10] and the CERN LHC tracking detectors [11][12]:
near 100% efficiency for charged particle detection with practically zero noise occupancy,
inherently fine spatial resolution,
simple calibration that is stable over time periods of many years,
compact and easy assembly using standard mechanized industrial processes, with excellent mechanical stability,
and lack of hazardous materials, flammable or toxic gases, and high voltage, which is especially important for clinical environments.
Although there could be a small advantage, in terms of minimizing scattering material, to use double-sided sensors, our system uses single-sided sensors that were surplus items from fabrication of the Fermi-LAT silicon-strip tracker. The 0.4 mm SSD thickness was also optimized for the Fermi-LAT, but simulations showed only minor advantages in terms of spatial resolution to using thinner devices or double sided sensors (because proton scattering in the object being imaged dominates). The 0.228 mm strip pitch was also optimized for the Fermi-LAT but works well in the pCT application, giving an rms resolution of 0.066 mm per track coordinate.
An important parameter is the size of the gap between active areas of individual sensors making up a single layer. We minimized that by re-sawing the SSD edges very close to the guard ring, such that the distance between active regions of adjacent sensors is only about 0.6 mm. That caused a dramatic increase in leakage current, but none of the excess current flowed to the readout amplifiers, and the SSD noise performance was not impacted. With more time and resources we could have minimized the leakage current by cleanly cleaving the silicon and then passivating the edges [13]. An alternative approach, used in our Phase-I prototype and elsewhere [14], is to overlap the sensors. However, we saw ring artifacts from the overlap in Phase-I reconstructions, so in our Phase-II scanner we decided not to use the overlap both to simplify the assembly and to avoid these artifacts.
The SSDs are bonded by conductive adhesive to printed circuit boards that are cut out under the sensor active area. The boards are aligned by pins to a machined aluminum structure as shown in Figure 3, maintaining the SSD alignment to better than 100 μm accuracy, and are housed in light-tight aluminum enclosures, visible in Figure 2. A blower forces air through the enclosures to cool the electronics. The proton entry and exit windows are covered with 50 μm thick blackened aluminum foil.
Figure 3.
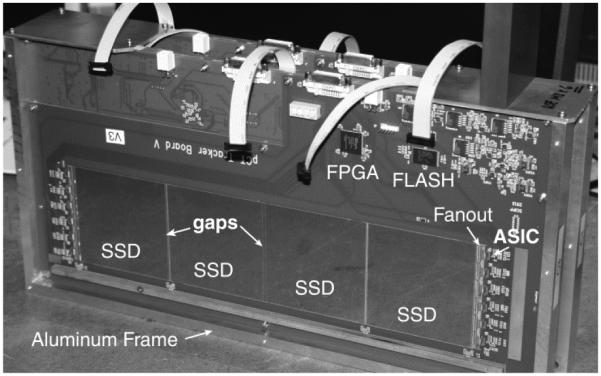
One of the two tracking modules, with two V layers and two T layers, removed from its enclosure. A V tracking layer is visible, on which the silicon strips run horizontally. Strips on pairs of SSDs are wire bonded together and read out by six ASICs, as seen on each end of this board. Each T layer has strips running vertically, and each SSD is read out by six ASICs, for a total of 24 per T board. The loose cables visible here are for programming the six Xilinx Spartan-6 FPGAs, one per V board and two per T board.
The front-end of the data acquisition for the tracking detector is based on a custom integrated circuit (ASIC) that is described elsewhere [15]. The pitch of its 64 input channels is smaller than the SSD strip pitch, so a glass circuit with narrow aluminum traces is used as a “fanout” to interconnect triplets of ASICs with an SSD. FPGAs on each detector board combine and format the data from groups of 12 ASICs and then send the data over dual-link DVI-D cables to the event builder. Figure 3 shows a photograph of one of the detector boards. Each has a 4 V power input, in addition to the 100 V SSD bias, whereas all other voltages are derived on-board using linear regulators. Texas Instruments INA226 chips are used to monitor the voltages and currents over an I2C bus, and a TMP100 chip monitors the temperature.
High efficiency with low noise is an essential requirement for the tracking detector. There is almost no redundancy in the tracking—all eight coordinate measurements (“hits”) are needed for each proton. Some protons do pass through the small gaps between sensors (which are staggered from one layer to the next to avoid protons passing through multiple gaps) or through dead strips (0.2% of all channels).
In many cases those events can be recovered as follows [16]. In T layers the gaps are parallel to the strips. If the strips are 100% efficient, then a missing hit indicates that the proton passed through the gap, which localizes it in t almost as accurately as a hit strip does. The same procedure works for known dead strips in T or V sensors. A missing hit in a V layer of the front tracking module can be recovered by taking advantage of a strong correlation between the location of the single hit and the direction of the incoming proton. For example, at LLUMC the beam origin at the exit from the vacuum pipe, about 3 m from the tracker, is accurately known from extrapolations of millions of proton tracks.1
From analysis of 200 MeV proton data taken with no phantom installed we measured the SSD efficiency of each tracker layer. The results ranged from 99.2% to 99.5%. When the gap regions were excluded from the analysis, we found the efficiency to be about 0.4% higher. Thus much of the small inefficiency is caused by the known gaps between sensors, and most of the missing hits can be recovered as explained above. Some caution is needed, however, at very high rates with a scanned narrow beam, because pile-up of signals in the amplifiers can significantly increase the missed-hit rate.
From analysis of 200 MeV proton data taken with no phantom installed we measured the SSD efficiency of each tracker layer. The results ranged from 99.2% to 99.5%. When the gap regions were excluded from the analysis, we found the efficiency to be about 0.4% higher. Thus much of the small inefficiency is caused by the known gaps between sensors, and most of the missing hits can be recovered as explained above. Some caution is needed, however, at very high rates with a scanned narrow beam, because pile-up of signals in the amplifiers can significantly increase the missed-hit rate.
The excellent efficiency that we have demonstrated is insensitive to threshold and timing settings in the system, allowing the scanner to be operated in successive beam tests scheduled weeks or months apart without any modifications to the hardware settings. That is because the electronic noise lies far below the minimum signal level, as we predicted in Ref. [15] prior to operation in a proton beam. There we measured noise 40 or more times lower than the expected signal from a 200 MeV proton,2 and we observed rates of noise pulses above the typical ASIC threshold setting that were in the range of one in a million per strip per trigger. From events accumulated by the final complete system with the proton beam off, triggered by cosmic rays and calorimeter noise, we found an occupancy of 5×10⁻⁶ hits per strip per trigger, after masking data from only two defective strips. Some of those “noise” hits were likely due to cosmic rays.
III. Five-Stage Energy/Range Detector
Our Phase-I scanner employed doped CsI crystals to measure the residual proton energy. Whereas such crystals yield excellent energy resolution, they are too slow for the high rates needed in a clinical system. In the Phase-II system, by dividing the energy detector into five stages, we greatly reduced the requirement on energy resolution, allowing effective use of fast plastic scintillators: 5.1 cm thick segments of UPS-923A polystyrene-based scintillator read out by R3318 Hamamatsu photomultiplier tubes. Stages that a proton passes all the way through contribute directly to total range, so the stage in which the proton stops needs to measure only a residual range of less than 5.1 cm in polystyrene, with only a relaxed precision requirement compared to what would be needed in a monolithic calorimeter. The design, fabrication, and calibration of the 5-stage detector is presented in more depth in Ref. [17], but here we describe more completely the associated readout system.
We developed a custom board (Figure 4) to digitize the PMT signals, with each board handling up to three channels. Each 14-bit Analog Devices ADC (AD9244 driven by an AD8138) can operate at rates up to 65 MHz, yielding digitized waveforms as illustrated in Figure 5. A Xilinx Spartan-6 FPGA on each board buffers the data and, upon receipt of a trigger, also reduces the data.
Figure 4.
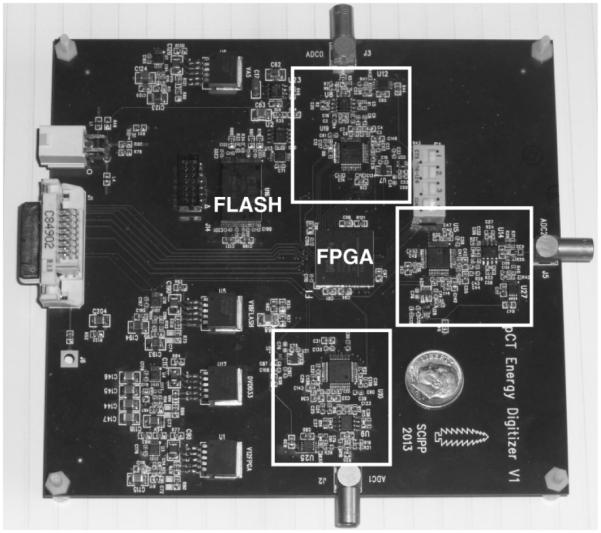
One of the two 5-stage detector digitizer boards. Each board reads up to three PMT channels through RG-316 cables. The three digitizer channels are encircled in the photograph. The 15 CMOS outputs from each ADC make short connections directly to the FPGA in the board center.
Figure 5.
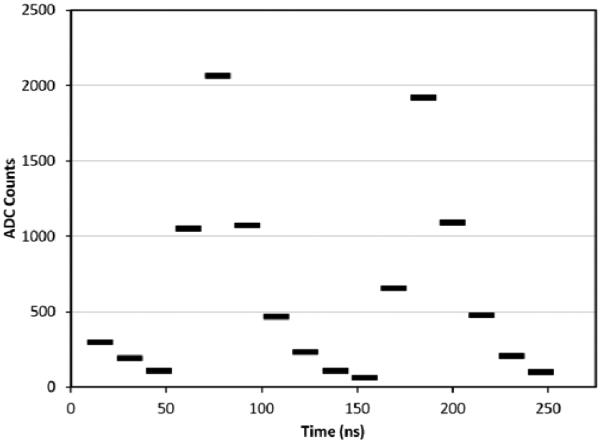
Example of a digitized signal from one scintillator in a 200 MeV proton event at the LLUMC synchrotron. In this example, when data reduction is enabled, samples 4 through 9 are summed in the FPGA, after subtracting the pedestal, to yield the pulse size that is transmitted with the event. Here the pulse from a proton in the following RF period is also visible, as is the tail of the pulse from a proton that evidently was present in the previous RF period. At the time of this event the proton trigger rate was well above 1.5 MHz.
The digitizer board has a single 5.5 V power input, and all other voltages are derived on-board using linear regulators, except for a negative 5 volt supply that is derived by a switching regulator. Voltages and currents are monitored as on the tracker boards. Probably a successful board could have been made to handle all five channels, but we conservatively placed one digitizer on each of three sides of the FPGA, with the data paths to and from the event builder on the fourth side. This simplified the routing and confined the 15 single-ended CMOS outputs of each digitizer to very short traces. All digital communication with the event builder FPGA takes place over a single dual-link DVI-D cable per digitizer board. Two such boards are used for the 5-stage detector readout, as illustrated in Figure 7.
Figure 7.
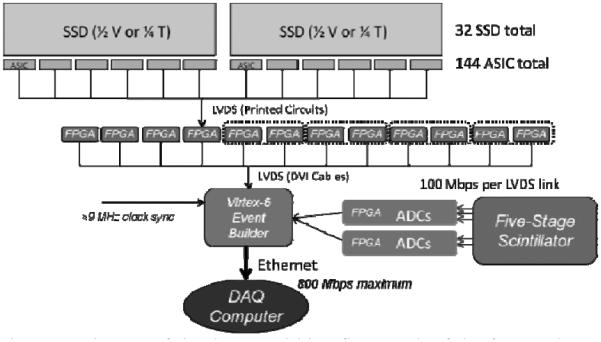
Diagram of the data acquisition flow. Each of the four tracker V boards has one FPGA and 12 ASICs whereas each of the four T boards has two FPGAs and 24 ASICs.
The digitizers operate continually during a run, and the samples are stored in a circular buffer, implemented in dual-ported block RAM of the FPGA, for 256 clock cycles before being overwritten, allowing the system up to about 4 microseconds to make a trigger decision. Upon receipt of a trigger, the logic transfers up to 16 consecutive samples from the circular buffer at a rate of 100 MHz and stores them pending readout in a buffer that can hold up to eight events. The data reduction algorithm is executed at the same time, as described below.
The principal trigger for the scanner is derived from the 5-stage detector. Each of the five channels outputs a trigger signal, although we normally use only the signal from the first layer, since it is the only layer hit by every proton of interest. To derive the trigger signal, we first pass the PMT signal through an inverting amplifier of gain −2 that is based on the Texas Instruments THS3201 1.8 GHz current-feedback amplifier. The inverted signal is discriminated by a comparator with LVDS output (Analog Devices CMP604), whose threshold is set by a 10-bit DAC (Texas Instruments 101C081) controlled by the event builder over the I2C bus. The LVDS comparator output goes to the FPGA, which transmits it to the trigger logic of the event builder.
The performance of the digitizer was tested using signals from a pulse generator that were shaped to resemble PMT pulses. The clock frequency was tested up to the maximum of 65 MHz specified for the ADC chip. At 65 MHz, when the pulses arrived with a random phase relative to the ADC clock, the rms width of the distribution of pulse sizes was 0.90%. That variation was primarily a binning effect, as it decreased to 0.15% when the digitizer clock was phase locked to the signal source.3 It is in any case negligible compared with the natural variation in signals produced by protons. Thus the electronics noise and the digitization do not contribute significantly to range errors.
Since our available data transmission bandwidth demands that the digitizer data be reduced in the FPGA to a single pulse-size estimate per channel per proton, the algorithm must be fast and simple. For example, fitting the pulse to a functional form would not be practical. We use the integral of the pulse as the estimator, but if the entire pulse were integrated, including the tail, then there would be a danger of distortion caused by overlap with signals from protons in the neighboring RF periods. Figure 6 shows an example digitized signal from two protons in successive RF periods at the LLUMC synchrotron.
Figure 6.
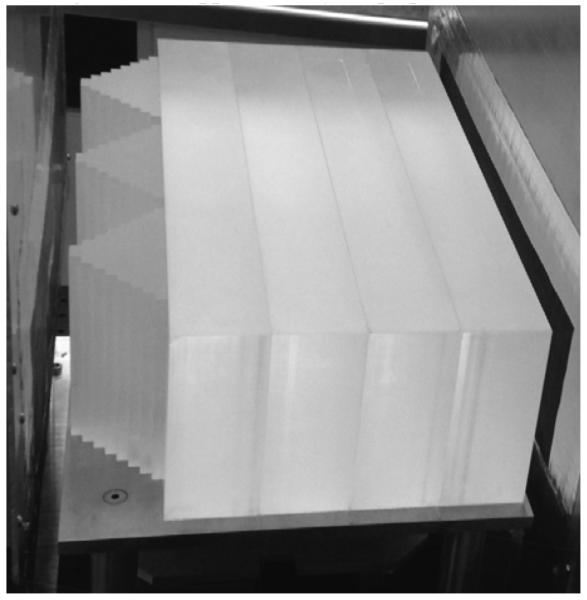
Photograph of the WEPL calibration phantom installed between the tracker modules of the Phase-II scanner. In practice a run is made with just the stairs installed, and then four more runs are made with the rectangular blocks set in place one by one.
The pedestals are subtracted before summing the samples. They are calibrated by analyzing measurements taken at low particle rates, and we have observed them to be stable once the PMTs have been allowed to warm up after powering them on. Then the pulse integral is calculated, typically by including only the peak sample, one sample preceding the peak, and three or four samples following the peak. The user has options to adjust the number of samples used in the sum and also to read out all of the individual 14-bit samples for debugging and calibration. In order to detect and calibrate the effects of pulse overlap, we also read out for each event the time, in clock cycles, that has elapsed since the previous trigger request. If it is less than two RF periods, then there is the potential that the tail of the signal from the earlier proton will bias our estimator of the pulse size. However, for the data reduction algorithm described here we have not seen a significant effect.
IV. 5-Stage Detector Performance
When we look at just the signals in the first stage from 200 MeV protons passing through a 2 cm square in the center of the 5-stage detector (with no phantom in place), we find a Gaussian distribution with σ = 3.0%. Since Geant-4 simulations [18] predict σ = 2.8% just from variations in the energy deposition, by subtracting the two numbers in quadrature we estimate that the detector resolution is around 1%, more than adequate for this application.
However, the detector response does show a stable variation in t and v of up to about 10% that must be measured from the data and corrected. After that, we calibrate the measurement of WEPL by taking and analyzing proton data with a large number of different known thicknesses of polystyrene placed between the two tracking detectors [19]. To facilitate this process we developed a novel phantom composed of five separable pieces of polystyrene [17]. The first piece is machined into six sets of identical stairs, each with 9 steps of different thickness, including zero, whereas the other four are rectangular blocks (see Figure 6). The tracking system data are used to calculate which step in the stairs each proton passed through. By taking only six ten-second runs, one with no phantom, one with just the stairs, and four with one to four rectangular blocks in place as well, we accumulate a dataset of many millions of protons passing through 41 different thicknesses of polystyrene in 6.35 mm steps. From those data we derive the calibration constants needed for scanner operation. We have verified that this procedure yields a WEPL resolution that is approximately 3 mm rms for all values of WEPL, only slightly higher than the predicted lower limit of 2.8 mm that arises from range straggling of 200 MeV protons.
V. Data Acquisition
The data acquisition system was designed to move the raw data from at least a million events to the computer per second. It does so in several stages, as illustrated in Figure 7. The raw digitized data are delayed in FIFOs at the front end (in the ASICs for the tracking boards and in the FPGAs for the energy detector boards) until a trigger is received. In a tracking board the data, in the form of a list of clusters of strips above threshold, flow in parallel from 12 ASICs to an FPGA, at a rate of 100 Mbit/s for each link. The ASICs buffer up to four events to smooth out random fluctuations in the proton arrival times. Each FPGA buffers the incoming data and builds a packet from the contributions of the 12 ASICs—in a typical event only a single ASIC contributes a cluster. Similarly, the FPGA on each energy detector board buffers the event data and in parallel reduces the 14-bit ADC values down to a summed pulse height per channel, as described in Section III.
The 14 front-end FPGAs then send their data packets at 100 Mbit/s each over dual-link DIV-D cables into the buffers of the event builder: a Xilinx Virtex-6 FPGA on an ML605 evaluation board, together with our custom “mezzanine board.” The latter plugs into the ML605 via its two high-density connectors and serves to interface the ten DVI cables with the Virtex-6. It also distributes power and detector bias to the front-end boards, provides the capability to phase lock the digitizer clock to the accelerator RF, and hosts a ZestET1 Ethernet board. Once all data from a given trigger are present in the event builder, they are packaged together and sent to the data acquisition computer over the 100 MByte/s Ethernet link. The Virtex-6 FPGA and the Spartan-3 FPGA on the ZestET1 board provide additional levels of event buffering beyond what is in the front-end-board FPGAs and the tracker ASICs.
The data integrity is monitored via parity bits in the ASIC-to-FPGA transmission and an 11-bit CRC in the transmissions between FPGAs. Also, each event data packet is given a trigger tag at the front end, and the system checks that the tags match throughout the event building, to detect possible mixing between events. The commands transmitted between FPGAs and from FPGA to ASIC are also monitored by parity bits. In a typical beam test, for example, 2.5 billion events with a total of 1.8×1011 bytes were acquired with zero errors of any kind detected.
In the computer we run a custom data-acquisition program named “pct-acquire,” which is coded in Python, using TkInter to implement a simple graphical user interface (GUI). YAML is used to organize all of the control and calibration parameters in a configuration file, and pySerial is used to communicate with the event builder via a USB/UART connection (only the data stream uses the Ethernet link). The data acquisition runs in several parallel processes which communicate via messages. The most important processes operating during a run are the one that receives the Ethernet data stream, a second that writes the stream directly to a solid-state disk drive, and a third that controls the rotation stage. The computer has enough memory to hold an entire typical scan (~20 GBytes), but in practice the disk writing is able to approximately keep up with the data flow.
Prior to executing a scan, the program configures the entire hardware system according to the YAML text file and verifies the contents of each hardware register that is loaded. It also reads the voltages, currents, and temperatures from the front-end readout boards and displays the results in the GUI. During a scan it typically makes ninety 4° steps of the rotation stage, writing out a separate data file at each step. To minimize wasted time it synchronizes the start of the rotation and pause in data acquisition to match the beginning of the approximately two-second time interval between two synchrotron spills. However, when operating at an isochronous cyclotron, where the beam is continuous, this operating method is inefficient and results in needless excess radiation exposure. Therefore, we are testing an alternative mode in which the stage rotates slowly and continuously during a single data acquisition run. In that case the stage angle for each event is calculated from the event time stamp together with the stage angular speed, starting time, and starting position.
Figure 8 shows the data acquisition rate performance during a single short run. The proton rate from the synchrotron was non-uniform during each spill, but the system gracefully inhibited the trigger when all buffers were full while keeping data flowing at the maximum allowed rate. As planned, the data acquisition system can sustain indefinitely a rate of over one million events per second with no data errors and no partial events.
Figure 8.
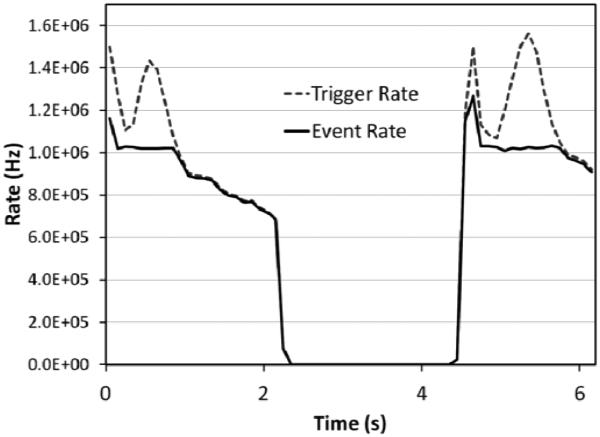
Example run with 200 MeV protons, showing two spills from the LLUMC synchrotron. Nearly 100% of the triggers are accepted up to about a 1 MHz trigger rate.
In addition to our tests carried out at the LLUMC synchrotron, we are currently testing the system in a continuous 200 MeV beam from the 230 MeV isochronous IBA cyclotron4 at the Northwestern Medicine Chicago Proton Center in Warrenville Illinois. The cyclotron beam has a decided advantage in avoiding the time wasted between synchrotron spills as well as ability to deliver a constant proton rate, something we have not achieved at the LLUMC synchrotron (see Figure 8). For example, in a run with a constant 1.6 MHz trigger rate, the event acquisition rate was a constant 1.2 MHz, the upper limit obtainable with the present hardware.
Most of our scans done so far at the Chicago Proton Center still stepped the stage in 4° intervals, with the trigger disabled during rotation, but to take full advantage of the continuous beam we have begun testing the new continuous scanning method, which would be greatly preferred in a clinical setting if implemented as a gantry rotation. Preliminary tests have given excellent results, with scans completed in only six minutes. When the resulting data were analyzed in 1° bins the image results were equal to or superior to results obtained in more than double the time by starting and stopping the acquisition at 2° or 4° intervals.
A further major advantage of the Northwestern Medicine facility is the capability of the IBA universal nozzle to wobble a pencil beam broadened by an initial scatterer (about 4 to 7 cm FWHM) horizontally and vertically, a delivery mode called “uniform scanning” [20]. This allows us to expose uniformly and predictably the part of the phantom covered by the scanner acceptance with fewer protons emitted outside of the imaging region.A problem with running pCT has been that the required intensity is so low that the accelerator operators cannot monitor the beam. However, we found at the cyclotron facility that we were able to monitor quickly both the beam intensity and profile using our pCT system, thus giving rapid feedback to the operator, who quickly found accelerator settings that delivered the desired beam profile and megahertz proton rate.
VI. Image Reconstruction
Prior to image reconstruction the raw data are preprocessed to calculate the coordinates of the tracker hits, to associate the hits with proton tracks [16], and to derive the WEPL from the 5-stage detector digitizations according to the calibration described in Section IV.
The track reconstruction is straightforward, due to the simplicity of the events of interest. It is carried out separately in the t, u and v, u views. In each of the front and rear trackers we form segments from two points in separate layers and discard those at very large angles from the beam direction. We then extrapolate the segments to the t, v plane at the center of the rotational stage and associate front and rear segments that match in that plane to within 10 mm. Successful matches form 2D tracks, and we reject events with more than one such track in either view. If no track is found, due to there being no hits in one of the layers, then we repeat the tracking after attempting to recover a missing hit as described in Section II. At a 1 MHz trigger rate 6% to 9% of events with tracks have more than one, but only events with exactly one proton track are processed further.
The image reconstruction starts from the resulting list of proton histories, each of which is defined by the WEPL, the front and rear 3D track vectors, and the stage angle. A cylindrical reconstruction volume is defined that contains the entirety of the object being imaged. For each proton the coordinates of entry into and exit from the reconstruction volume are calculated by forward and backward projection of the entry and exit vectors, respectively, as measured by the two trackers. Protons that do not enter the reconstruction volume, as well as those that exit from the top or bottom surfaces of the cylinder, are not used in the image reconstruction.
The protons then are binned according to their projected intercepts with a plane passing through the center of the phantom and perpendicular to the beam. Proton histories that fall more than three standard deviations from the center of the WEPL peak in the bin are eliminated. In addition, protons for which the angle between the entry and exit vectors is more than three times the expected standard deviation are eliminated. These cuts are effective in reducing errors from protons that undergo hadronic interactions in the scanner or phantom.
The remaining binned data are arranged into a sinogram, which is passed through a Shepp-Logan filter and then used as input to a filtered back projection (FBP). The Feldkamp-Davis-Kress (FDK) algorithm [21], the cone-beam version of the FBP, is used both for boundary detection and as a starting point for the ensuing iterative reconstruction, which employs a method based on diagonally relaxed orthogonal projections (DROP) onto convex sets. This method requires knowledge of each proton’s WEPL and its MLP [22] through the phantom. It forms a large linear system of sparse equations, which is then solved iteratively for the unknown RSP object vector. The DROP method is enhanced by interleaved superiorization of the total variation (TVS) in the reconstructed RSP map. Details of the DROP-TVS algorithm are described elsewhere [23].
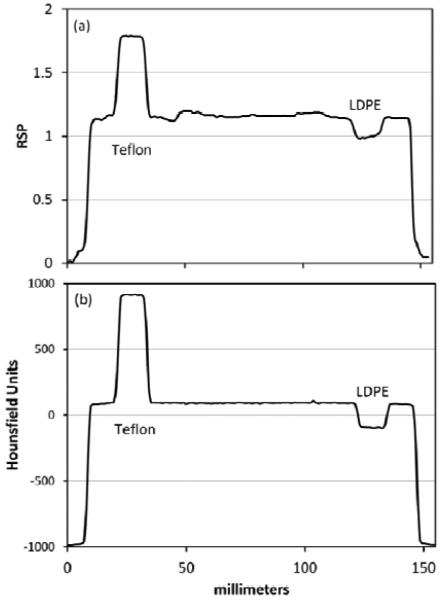
Figure 9 shows an example reconstructed pCT image (a) and, for comparison, X-ray CT image (b) of the CATPHAN 404 sensitometry phantom. The image was created with about 1.5 million protons passing through the phantom per projection angle, which corresponds to a dose of the order of 1 mGy. The RSP of a variety of materials is measured to good accuracy with pCT, as demonstrated in Figure 10. The PMP measurement is noticeably off, although this may well be due to an inaccurately predicted RSP for this material, which is not included in the NIST standard material data base. Air is also noticeably off, which is due to problems with calibration around zero RSP. There are visible ring artifacts in Figure 9, also showing up as ‘structural noise’ in Figure 11. These are understood to be due to remaining calibration problems leading to inaccurate assignment of WEPL values for protons that stop close to an interface in the 5-stage detector. Correction of these calibration errors is work in progress.
Figure 9.
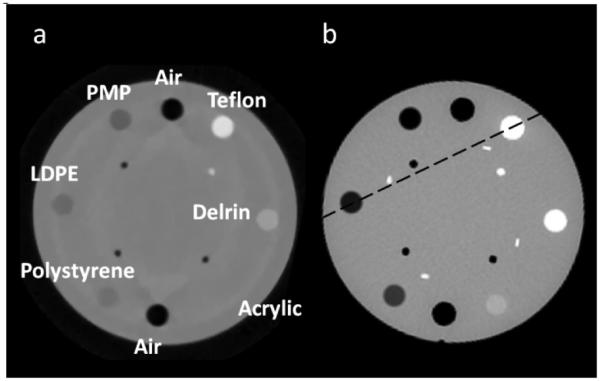
(a) A slice of an example CT image reconstructed with data from the completed Phase-II scanner: the CATPHAN 404 module, a cylinder of plastic with several cylindrical inserts of differing materials and empty cylindrical holes (air). The section also contains 4 thin wire ramps not visible in the pCT image. The data were collected for 90 stage orientations in 4 degree intervals, with about 3.2 million proton events collected at each angle. Only 51% passed through the reconstruction volume, and 32% of those were rejected by analysis cuts in the data processing. Finally, the 3-D image was reconstructed from 99.5 million proton histories, with a voxel size of 0.7 mm × 0.7 mm × 1 mm. (b) An X-ray CT slice from the same phantom, which shows the same features as the pCT image plus the 4 wire ramps, visible as short white lines. The dashed line corresponds to the profiles shown in Figure 11. Abbreviations: LDPE is low density polyethylene and PMP is polymethylpentene.
Figure 10.
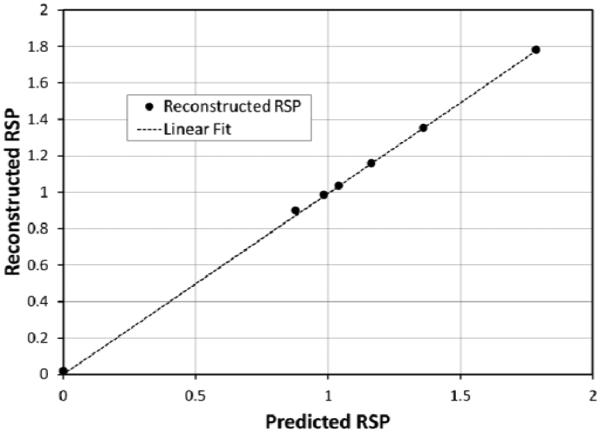
The measured RSP of inserts in the CATPHAN 404 phantom, compared with the predicted values. The dashed line is a linear fit constrained to pass through the origin. It has a slope of 0.994 ± 0.009. Vertical statistical error bars on the data points are too small to be visible.
Figure 11.
Profile plots across the CT scans of Figure 9 along the dashed line indicated in Figure 9b for (a) proton CT and (b) X-ray CT of the CATPHAN 404 module.
Figure 12 shows a slice of a reconstructed image from a scan of a pediatric head phantom, in which the teeth, spinal column, jawbones, and oral air cavities are clearly visible. The pCT scan is compared with an X-ray CT scan of the same phantom.
Figure 12.
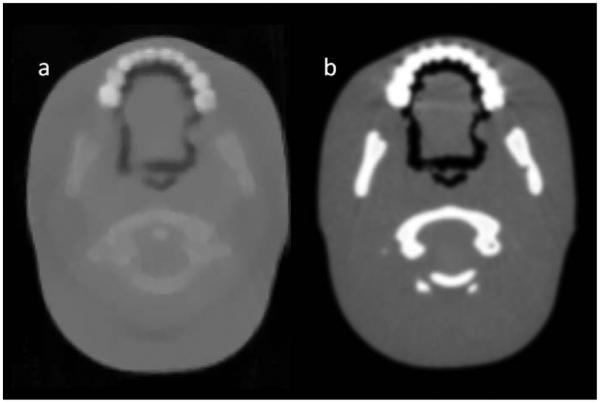
(a) Reconstructed 1 mm slice through a pediatric head phantom (CIRS model 715-HN), made with 1 mm square pixels. The scan was made in the same way as described for the CATPHAN 404. The 3-D image was reconstructed from 84.6 million proton histories. (b) For comparison, a 0.6 mm slice from an X-ray CT scan of the same phantom.
We also have produced a high performance parallel implementation of the image reconstruction that uses silhouette/space-carving or its variants [24] [25] instead of FBP to determine the boundary. The silhouette/space-carving methods take less than a third the time, and the resulting hull is smoother. An FBP is performed inside the resulting hull as an initial iterate. DROP is then used without superiorization to refine the image. The resulting images have had less than 1% RSP error. The parallel DROP code for 100 million histories takes under a minute on an NVIDIA GTX 780 GPU, allowing the entire reconstruction process with pre-processing to finish in less than five minutes.
VII. Conclusion and Further Work
The Phase-II scanner hardware and data acquisition system have been completed and have operated reliably at the design data rate in both synchrotron and isochronous-cyclotron facilities. Preliminary image results are encouraging, although more work is needed in order to achieve images free of calibration-related artifacts. The system is now ready to support testing of reconstruction algorithms as well as a thorough evaluation of proton computed tomography in terms of image resolution [26], RSP measurement, and dose in a variety of phantoms, including comparisons with detailed Monte Carlo simulations.
Dramatic further increases in speed of the scanner would require an energy detector or range detector with significant transverse segmentation or else faster response with shorter pulses. Transverse segmentation of the 5-stage detector would possibly suffer from effects introduced by small gaps between segments. A range detector made of many thin scintillators could probably operate much faster but would require segmentation in at least the first layer in order to match with the tracks. Also, the tracker would likely need an additional slightly rotated plane in order to resolve pattern-recognition ambiguities.
On the other hand, with much more modest changes we believe that we can significantly increase the already impressive rate capability of the present scanner, perhaps by as much as 50%, through programming the communication between FPGAs to use double-data-rate and by implementing a faster Ethernet connection between the event builder and computer. To take full advantage of the increased data acquisition speed as well as a continuous cyclotron beam, we will work to shorten the 5-stage detector pulses, thus minimizing pile-up and consequent inefficiencies. Put together, these incremental improvements promise to enable us to complete full CT scans with low overall radiological dose in only two to four minutes, depending on the phantom size. That is a time span well suited to clinical use.
Acknowledgment
We thank the Xilinx Corporation for donating the ML605 Virtex-6 FPGA evaluation board used as the event builder as well as the associated programming hardware and software. We also acknowledge crucial support from the technical staff at UCSC and LLU, as well as the accelerator operating staff at LLUMC and Mark Pankuch, PhD, and his staff at the Northwestern Medicine Chicago Proton Center. We likewise acknowledge the logistic and scientific support of the beam experiments at the Chicago Proton Center by Drs. George Coutrakon, Nicholas Karonis, and Caesar Ordoñez from the Departments of Physics and Computer Science at Northern Illinois University. We acknowledge Robert Jones at Inland Technical Service for mechanical engineering and machining support. The content of this paper is solely the responsibility of the authors and does not necessarily represent the official views of NIBIB and NIH.
This work was supported in part by the National Institute of Biomedical Imaging and Bioengineering (NIBIB) and the NSF, award Number R01EB013118.
Footnotes
We also use an initial scatterer for the beam from the cyclotron described in Section V, but it is much thinner. We still find a strong correlation between position and angle to be used in the case of a missing V hit in the front tracking module.
An even higher signal-to-noise ratio was given in Ref. [15], but threshold scans carried out since then in the proton beam have suggested that the absolute gain may have been overestimated by as much as 30%.
Capability to phase lock the digitizer clock to the accelerator RF is built into the scanner hardware, as indicated in Figure 7. However, we found that it did not improve the WEPL resolution significantly when running at the LLUMC synchrotron, and it cannot be used at all when running at an isochronous cyclotron, where the RF frequency is much higher than the digitizer clock frequency.
IBA (Ion Beam Applications S.A.), Louvain-la-Neuve, Belgium.
Contributor Information
Robert P. Johnson, Santa Cruz Institute for Particle Physics and Physics Department, University of California at Santa Cruz, Santa Cruz, CA 95064, rjohnson@ucsc.edu.
Vladimir Bashkirov, Division of Radiation Research, Loma Linda University, Loma Linda, CA 92354, vbashkirov@llu.edu.
Langley DeWitt, Santa Cruz Institute for Particle Physics and Physics Department, University of California at Santa Cruz, Santa Cruz, CA 95064, langleydewitt@gmail.com.
Valentina Giacometti, Centre for Medical Radiation Physics, University of Wollongong, Wollongong, NSW, Australia, valentina8giacometti@gmail.com.
Robert F. Hurley, Division of Radiation Research, Loma Linda University, Loma Linda, CA 92354, ford.hurley@gmail.com
Pierluigi Piersimoni, Division of Radiation Research, Loma Linda University, Loma Linda, CA 92354, pierluigi.piersimoni@gmail.com.
Tia E. Plautz, Santa Cruz Institute for Particle Physics and Physics Department, University of California at Santa Cruz, Santa Cruz, CA 95064, tiaplautz@gmail.com.
Hartmut F.-W. Sadrozinski, Santa Cruz Institute for Particle Physics and Physics Department, University of California at Santa Cruz, Santa Cruz, CA 95064, hartmut@ucsc.edu.
Keith Schubert, School of Engineering and Computer Science, Baylor University, Waco, TX 76798, Keith_Schubert@baylor.edu.
Reinhard Schulte, Division of Radiation Research, Loma Linda University, Loma Linda, CA 92354, rschulte@llu.edu.
Blake Schultze, School of Engineering and Computer Science, Baylor University, Waco, TX 76798, blake@r2labs.org.
Andriy Zatserklyaniy, Santa Cruz Institute for Particle Physics and Physics Department, University of California at Santa Cruz, Santa Cruz, CA 95064, zatserkl@ucsc.edu.
REFERENCES
- [1].Poludniowski G, Allinson NM, Evans PM. Proton Radiography and Tomography with Application to Proton Therapy. Br J Radiol. 2015;88 doi: 10.1259/bjr.20150134. [DOI] [PMC free article] [PubMed] [Google Scholar]
- [2].Bashkirov VA, et al. Development of proton computed tomography detectors for applications in hadron therapy. Nucl.Instrum.Meth. A. doi: 10.1016/j.nima.2015.07.066. doi:10.1016/j.nima.2015.07.066. Corrected proof available online, August 8, 2015. [DOI] [PMC free article] [PubMed] [Google Scholar]
- [3].Sadrozinski HF-W, et al. Development of a Head Scanner for Proton CT. Nucl. Instr. Meth. A. 2012 Apr;699:205–210. doi: 10.1016/j.nima.2012.04.029. [DOI] [PMC free article] [PubMed] [Google Scholar]
- [4].Sadrozinski HF-W, et al. Detector Development for Proton Computed Tomography (pCT). Proc. IEEE NSS/MIC; Valencia, Spain. 2011. pp. 4457–4461. [Google Scholar]
- [5].Coutrakon G, et al. A performance study of the Loma Linda proton medical accelerator. Med. Phys. 1994 Nov;21(11):1691–1701. doi: 10.1118/1.597270. [DOI] [PubMed] [Google Scholar]
- [6].Williams DC. The most likely path of an energetic charged particle through a uniform medium”. Phys. Med. Biol. 2004 Jul;49:2899–2911. doi: 10.1088/0031-9155/49/13/010. [DOI] [PubMed] [Google Scholar]
- [7].Scaringella M, et al. A Proton Computed Tomography Based Medical Imaging System. J. Instrum. 9:C12009–2014. [Google Scholar]
- [8].Taylor JT, et al. Proton Tracking for Medical Imaging and Dosimetry. J. Instrum. 2015;10:C02015. doi: 10.1088/1748-0221/10/02/C02015. [DOI] [PMC free article] [PubMed] [Google Scholar]
- [9].Saraya Y, et al. Study of Spatial Resolution of Proton Computed Tomography Using a Silicon Strip Detector. Nucl. Instr. Meth. A. 2014;735:485–489. [Google Scholar]
- [10].Atwood WB, et al. The Large Area Telescope on the Fermi Gamma-ray Space Telescope mission. Ap. J. 2009 Feb;697:1071. [Google Scholar]
- [11].ATLAS Collaboration The ATLAS Experiment at the CERN Large Hadron Collider. JINST. 2008 Aug;3:S08003. [Google Scholar]
- [12].CMS Collaboration The CMS Experiment at the CERN Large Hadron Collider. JINST. 2008 May;3:S08004. [Google Scholar]
- [13].Christophersen M, et al. Alumina and Silicon Oxide/Nitride Sidewall Passivation for p- and n-type Sensors. Nucl. Instr. Meth. A. 2013 Jan;699:14–17. [Google Scholar]
- [14].Civinini C, et al. Recent Results on the Development of a Proton Computed Tomography System. Nucl. Instr. Meth. A. 2013 Jun;732:573–576. [Google Scholar]
- [15].Johnson RP. Tracker Readout ASIC for Proton Computed Tomography Data Acquisition. IEEE Trans. Nucl. Sci. 2013 Sep;60:3262–3269. doi: 10.1109/TNS.2013.2274663. [DOI] [PMC free article] [PubMed] [Google Scholar]
- [16].Zatserklyaniy A, et al. Track Reconstruction with the Silicon Strip Tracker of the Proton CT Phase-2 Scanner. Proc. IEEE NSS/MIC; Seattle, WA. 2014. pp. J03–6. [Google Scholar]
- [17].Bashkirov VA, et al. Five-Stage Scintillation Detector Design and Performance for Proton Radiography and Computed Tomography. Med. Phys. doi: 10.1118/1.4939255. submitted to. [DOI] [PMC free article] [PubMed] [Google Scholar]
- [18].Agostinelli S, et al. Geant4–A Simulation Toolkit. Nucl. Instr. Meth. A. 2003 Jul;506:250–303. [Google Scholar]
- [19].Hurley RF, et al. Water-Equivalent Path Length Calibration of a Prototype Proton CT Scanner. Med. Phys. 2012 Apr;39(5):2438–2446. doi: 10.1118/1.3700173. [DOI] [PMC free article] [PubMed] [Google Scholar]
- [20].Zheng Y, et al. Commissioning of output factors for uniform scanning proton beams. Med. Phys. 2011 Apr;38(4):2299–2306. doi: 10.1118/1.3569581. [DOI] [PubMed] [Google Scholar]
- [21].Feldkamp LA, Davis LC, Kress JW. Practical Cone-Beam Algorithm. J. Opt. Soc. Am. A. 1984;1(6):612–619. [Google Scholar]
- [22].Penfold SN. A More Accurate Reconstruction System Matrix for Quantitative Proton Computed Tomography. Med. Phys. 2009 Oct;36:4511–4518. doi: 10.1118/1.3218759. [DOI] [PubMed] [Google Scholar]
- [23].Penfold SN, et al. Total Variation Superiorization Schemes in Proton Computed Tomography Image Reconstruction. Med. Phys. 2010 Nov;37(11):5887–5895. doi: 10.1118/1.3504603. [DOI] [PMC free article] [PubMed] [Google Scholar]
- [24].Schultze B, et al. Performance of Hull-Detection Algorithms for Proton Computed Tomography Reconstruction. Proc. of the Workshop on Infinite Products of Operators and Their Applications, Contemporary Mathematics.2015. pp. 211–224. [Google Scholar]
- [25].Schultze B, et al. Space Carving and Filtered Back Projection as Preconditioners for Proton Computed Tomography Reconstruction. Proc. IEEE NSS/MIC; Anaheim, CA. 2012. pp. 4335–4340. [Google Scholar]
- [26].Plautz T, et al. Spatial Resolution Studies and Measurement of the Modulation Transfer Function for a Prototype Proton CT Scanner. Proc. IEEE NSS/MIC; Seattle, WA. 2014. pp. M19–53. [Google Scholar]


