Abstract
Background
Targeted sequencing of epidemiologically low risk (ELR) HNSCC patients could help identify novel drivers or lost suppressors leading to precision medicine protocols and improved survival rates.
Methods
An ELR-HNSCC patient was selected for targeted sequencing. We then assessed next generation sequencing cohorts from the Oncomine Powertool Database, which contains pan-cancer data from The Cancer Genome Atlas(TCGA).
Results
Targeted sequencing revealed FGFR1 amplifications as a putative driver of the patient’s tumor. HNSCC patients from TCGA data demonstrated FGF family mutations, rearrangements or amplifications in over 35% of HNSCC cases, with a statistically significant higher frequency in African American populations. FGF alterations were unique from activating PIK3CA mutations.
Conclusion
Together, this data suggests that FGF signaling may be critical for a subset of HNSCC patients independent of other known pathways and provides rationale for leveraging ELR-HNSCC patients to define molecular subsets of high risk HNSCC.
Keywords: HNSCC, FGF, FGFR, Amplification, Mutant
INTRODUCTION
There are approximately 560,000 new cases of head and neck squamous cell carcinoma (HNSCC) resulting in 300,000 deaths per year worldwide.1 For these patients, prognosis is often poor due to disease propensity for extensive local invasion, early dissemination into regional lymph nodes and metastatic spread.2 Despite modifications in treatment over the past decade, overall survival has remained unchanged for advanced disease with a less than a 50% five-year survival rate.3
To improve patient outcomes in HNSCC, a change in our treatment approach may be necessary. Cancer genomics is a promising field that seeks further understanding of the genetic drivers of these tumors. These drivers may in turn allow for the discovery of druggable targets. While these types of precision medicine protocols are currently in phase II and III trials for multiple cancer types, no protocols exist for HNSCC due to a lack of comprehensive knowledge of disease genetics and molecular targets.4,5
Several groups, including The Cancer Genome Atlas (TCGA), are currently using next generation sequencing in order to molecularly subtype HNSCC.6 While sequencing studies completed thus far have confirmed that there are multiple molecular alterations in HNSCC, the observed distribution of mutations from the high risk patients is incredibly complex, especially compared with other tumors that are not related to smoking and alcohol use. On average, 141 mutations per tumor are found in the HNSCC TCGA data, with no clear distinction of driver and passenger mutations.6 Attempts to molecularly stratify are further confounded by the fact that many of these mutations occur in different genes within an individual pathway (functional recurrence).
As it is well established that tobacco and alcohol use lead to increased mutational load, there is the potential for increased prevalence of passenger mutations, making identifying the underlying driver mutations more difficult to identify. Additionally, Human Papilloma Virus (HPV) is a known cause of HNSCC.3 The mutational load in HPV-negative patients who do not smoke or drink, or epidemiologically low risk (ELR) patients, potentially may be lower, and without established genetic drivers such as HPV E6/E7. As such, mutations identified in these patients have a greater chance of being clinically relevant. In light of this fact, we began our analysis by examining the disruptive genomic events in an ELR patient with aggressive recurrent HNSCC. The purpose of this study is to profile a HNSCC tumor within a low risk patient to understand the possible genetic drivers, and then secondarily to analyze these putative genetic drivers within a larger genetically sequenced cohort.
MATERIALS AND METHODS
Patient Material
This study carries University of Michigan Institutional Review Board approval under HUM00080561. An ELR HNSCC patient (UM-ELR -01) was selected for targeted sequencing on DNA isolated from a diagnostic formalin-fixed, paraffin-embedded (FFPE) tissue block. Representative FFPE sections with >50% tumor content were used for molecular analysis. Sections were macrodissected to enrich for tumor content and cut for DNA extraction using the Qiagen Allprep FFPE DNA kit according to manufacturer’s instructions. DNA was then quantified using the Qubit fluorometer as described.7
Targeted DNA sequencing
Amplicon based DNA sequencing and data analysis was performed using 40 ng of isolated DNA on the Ion Torrent Personal Genome Machine (PGM) utilizing the AmpliSeq Comprehensive Cancer Panel as described.7 Nucleotide variants and indels were identified using the Torrent Variant Caller plugin, annotated using Annovar8, and filtered to include candidate somatic mutations by removing germ line variants and sequencing artifacts using in-house validated pipelines.7,9 Copy number alterations were identified as described7,10,11, using normalized, GC content corrected, total read counts per amplicon from UM-ELR-01 divided by those from a composite “normal” sample consisting of over 600 DNA samples. Gene-level copy number estimates were determined by taking the coverage-weighted mean of the per-probe ratios, with expected error determined by the probe-to-probe variance. We sequenced patient UM-ELR-01 using a single 318 chip to generate 3,819,576 mapped reads, 98.54% of which were on target. The 1,688,650 targeted bases were covered to an average depth of 235×, with 95.12% of targeted bases covered at >20×. Variants were filtered through a standardized pipeline to remove low confidence calls, sequencing errors, germline variants and common polymorphisms to prioritize potential driving non-synonymous, somatic alterations.
Fluorescence in situ hybridization
Fluorescence in situ hybridization (FISH) was performed from FFPE tissue slides from both the primary and the recurrent tumor of UM-ELR-01 to confirm DNA amplification. This was performed using standard protocols. Briefly, probes were used against FGFR1 and Centromere 8 (Cat. #FGFR1-20-OR, Empire Genomics, Buffalo, NY). They were subsequently blocked with 10% goat serum (Sigma-Aldrich, St. Louis, MO) plus 90% CAS block (Invitrogen, Carlsbad, CA). Slides were blotted with 1:500 anti-digoxigenin-fluorescein (Roche, South San Francisco, CA) and streptavidin-alexa flour 594 (Invitrogen) was placed for 1 hour. DAPI (Invitrogen) was applied to the slides before visualizing under fluorescent microscopy.
Western Blot
Protein isolation and western blot was performed from the recurrence of patient UM-ELR-01 tissue block to confirm protein expression (there was not enough material from the primary tumor to allow for protein isolation). Two control non-ELR HNSCC patients were also selected for comparison, UM-OSCC-01 and UM-LSCC-01. Patient UM-OSCC-01 is a 64-year-old Caucasian male smoker with a history of T4aN2bM0 SCC of the oral cavity. Patient UM-LSCC-01 is a 62-year-old Caucasian female smoker with a history of T2N0M0 SCC of the larynx.
Standard western blotting protocols were used. Briefly, flash frozen tumor proteins were lysed by sonification in RIPA buffer. Three micrograms of each protein was used for western blotting. Primary antibodies against GAPDH (Cat. #8804, Cell Signaling Technology, Danvers, MA) and FGFR1 (Cat. #PA5-27139, Thermo-Fisher Scientific, Wayne, MI; 1:1000 dilution) were incubated overnight at 4 C. The membrane was washed and incubated with an anti-Rabbit HRP linked secondary antibody at room temperature for two hours. The proteins were visualized with chemiluminescence.
The Cancer Genome Atlas
Data was collected from the Oncomine Powertool Database which contains pan-cancer data from TCGA.6,12,13 This identified 292 previously sequenced HNSCC patients. To begin assessing the basic molecular subtypes of HNSCC and to compare the frequency of FGF/FGFR family gene mutations, rearrangements and amplifications with other common alterations in HNSCC, we compared FGF/FGFR alterations with NOTCH pathway disruptions (NOTCH1, NOTCH2, NOTCH3, NOTCH4, MAML1 and MAML2), CDKN2A deletions/mutations, EGFR amplifications/mutations and PIK3CA gain of function mutations.
Statistical Analysis
Chi-square testing was used to determine significance in calculating co-amplification of FGF3/4/19, FGFR1–4 aberrations with other commonly mutated pathways, and FGFR1 amplification prevalence in African-American versus other ethnic groups.
RESULTS
Patient UM-ELR-01
Patient UM-ELR-01 is a 50-year-old Caucasian woman with a history of T2N0M0 (stage II) squamous cell carcinoma of the left oral tongue. She was followed closely for a history of oral tongue dysplasia. She was selected as an ELR patient as she is a never-smoker and non-drinker with a HPV-negative HNSCC. She initially underwent resection with bilateral selective neck dissection and free tissue reconstruction with negative margins. She had no adverse pathologic features and therefore did not undergo adjuvant therapy. She suffered an aggressive recurrence 6 months post operatively which was treated with chemo/radiation therapy.
To identify the molecular features of this tumor that may have driven rapid recurrence and to optimize a method for sequencing cancer related genes from FFPE samples, we first performed targeted sequencing on DNA isolated from a diagnostic FFPE block from the recurrent tumor of UM-ELR-01 (the initial tumor did not provide enough tissue for analysis). We performed amplicon based sequencing of all exons from 400 cancer related genes (AmpliSeq Comprehensive Cancer Panel) using 40ng of FFPE-derived DNA in the Ion Torrent Personal Genome Machine (PGM). For mutations, we identified only one previously observed TP53 T125M (COSMIC ID:44988) mutation was found in UM-ELR-01 (variant frequency 15%). Notably, no mutations and copy number variants were identified in other commonly mutated HNSCC genes and pathways (including NOTCH, CDKN2A, PI3KCA, and EGFR).
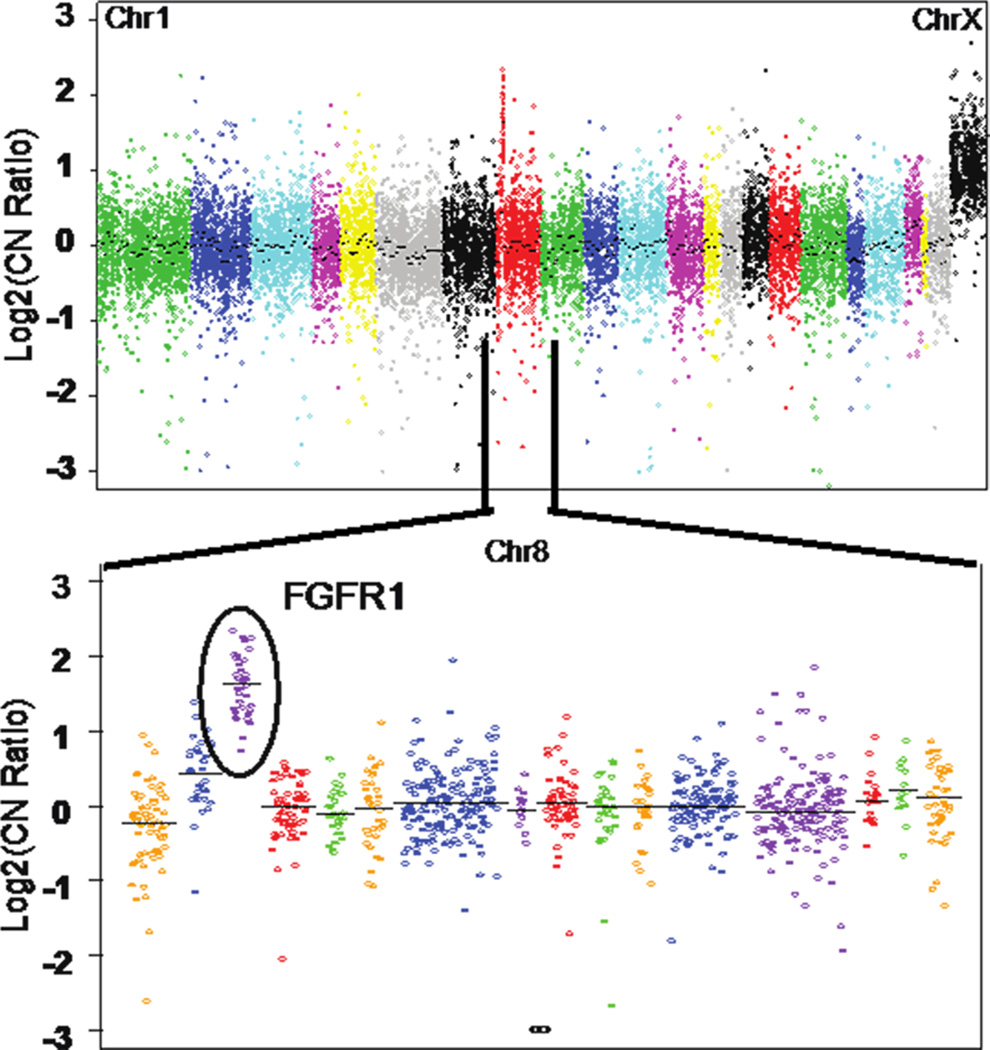
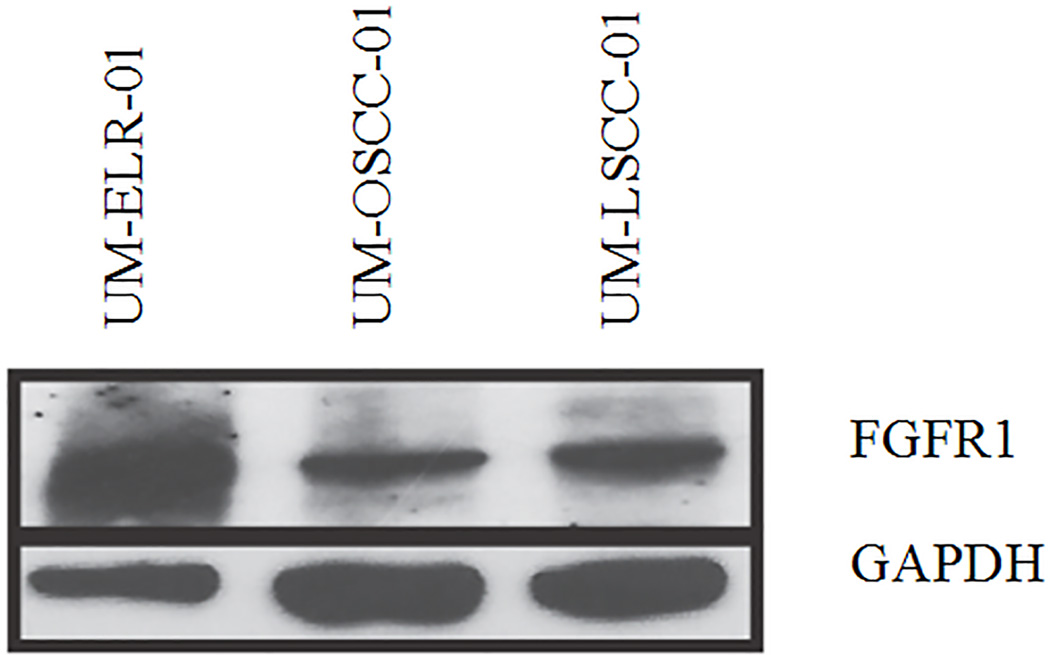
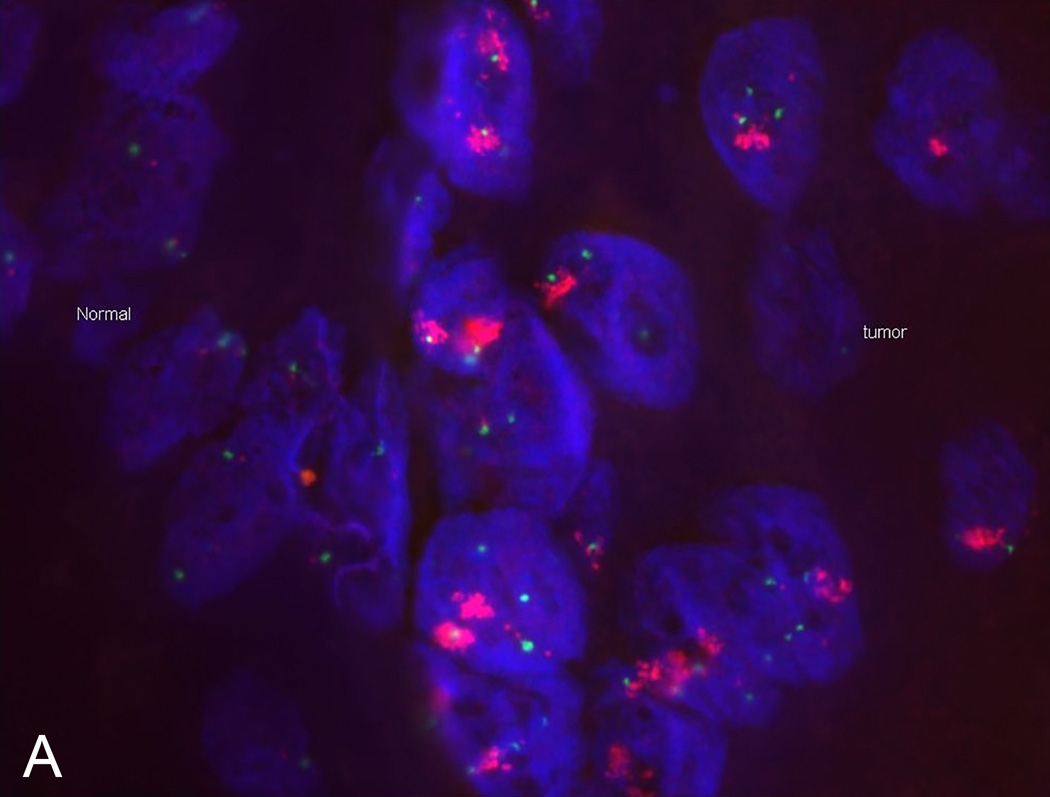
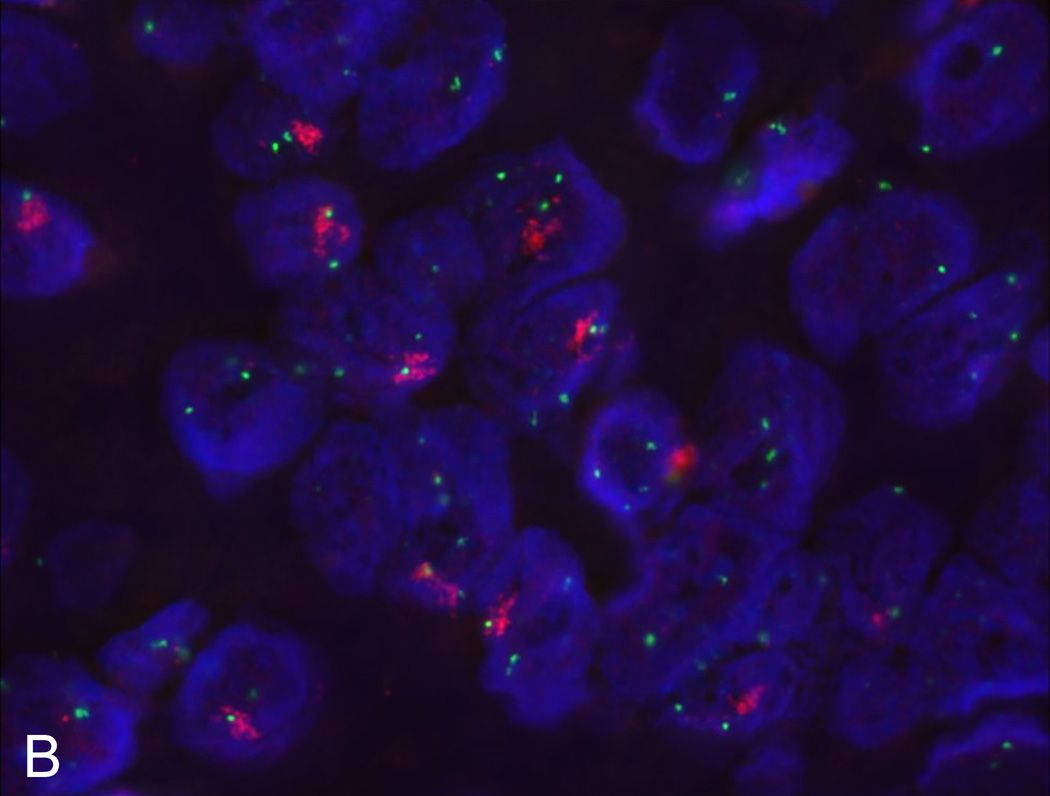
Copy number analysis demonstrated a focal, high-level amplification of FGFR1 on chromosome 8 (Figure 1). Western blot assay further confirmed high protein expression of FGFR1 in the recurrent tumor cells when compared to non-ELR HNSCCs (UM-OSCC-01 and UM-LSCC-01) consistent with the sequencing results (Figure 2). Next, FISH was performed on both the primary and recurrent tumor, which confirmed gene amplification at the chromosomal level in both (Figure 3).
Figure 1. Targeted Next Generation Sequencing identifies FGFR1 amplification in an ELR tumor.
The plot shows relative DNA copy number from an AmpliSEQ analysis of an FFPE tumor sample from UM-ELR-01. The top panel shows genes assessed across the genome. Chromosome 1 is shown on the left and Chromosome X is shown on the right. The X chromosome shows an apparent 1 copy gain as pooled male normal DNA is used as the reference. The bottom panel shows a zoomed in image of Chromosome 8 and an FGFR1 copy number increase.
Figure 2. Western blot identifies FGFR1 protein amplification in an ELR tumor.
Western blot analysis was performed on 3 HNSCC patients. Our index patient, UM-ELR-01, was compared to two controls, UM-OSCC-01 and UM-LSCC-01. UM-OSCC-01 is a 64-year-old male with a history of T4aN2bM0 SCC of the oral cavity and UM-LSCC-01 is a 62-year-old female with a history of T2N0M0 SCC of the larynx. Even with a lower loading signal, UM-ELR-01 demonstrates higher FGFR1 protein in comparison to the controls.
Figure 3. Flourescence in situ hydridization (FISH) identifies FGFR1 amplification.
FISH confirms FGFR1 amplification at the DNA level in our UM-ELR-01 patient’s primary tumor (A) as well as recurrence (B). Red denotes FGFR1 and green denotes centromere 8.
Extension to TCGA HNSCC Cohort
Next, we sought to extend our observation from ELR patient with relatively few aberrations to TCGA cohorts of HNSCC in order to define prevalence of FGF/FGFR family aberrations in the disease. Notably, TCGA consists of mostly non-ELR patients; most patients have a tobacco and alcohol use history (only 3 ELR patients were identified in this cohort, and all were male; Supplemental Table I,II).6,14 We postulated that FGF/FGFR family aberrations could serve as a molecular sub-group of HNSCC, which may be confounded by additional disruptive events that make the disease more aggressive in high-risk patients. Thus, we first assessed DNA sequencing data from a TCGA cohort of 292 primarily non-ELR patients from TCGA.
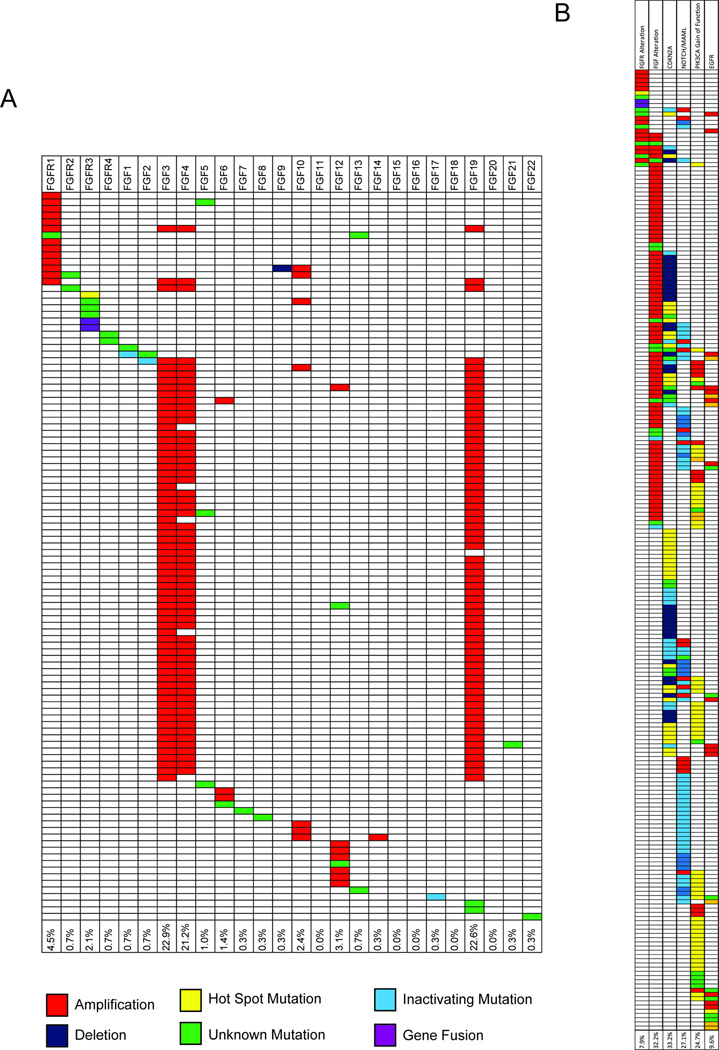
Interestingly, we found that FGF/FGFR genes were deregulated by mutation, rearrangement or amplification in 37.3% (109/292) of all HNSCC tumors sequenced (Figure 4A). There was a 7.9% (23/292) overall aberration rate in at least one of the four FGF receptors, with FGFR1 being the most frequent at 4.5% (13/292). This is in line with previous studies identifying mutations in FGFR in large HNSCC cohorts.6,15 Additional significant aberrations occurred to the FGF ligands, which included FGF3 amplifications at 22.9% (67/292), FGF4 amplifications at 21.2% (62/292) and FGF19 amplifications at 22.6% (66/292). Notably, FGF3, FGF4, and FGF19 are located in an amplicon (along with CCND1) on chromosome 11q13.
Figure 4. Analysis of genomic aberrations from the TCGA HNSCC data.
Individual patients are shown along the Y-axis and FGF/FGFR genes are shown along the X-axis. Aberrations are indicated by color code. The table demonstrates a high frequency of FGFR1, FGF3, FGF4 and FGF19 aberrations (A). Comparison of trends in patient mutations between FGF/FGFR and other commonly mutated pathways (B).
Because the precise role of FGFs in HNSCC pathogenesis is not yet understood, we focused on using the HNSCC TCGA data to stratify FGFR1–4 and FGF genomic alterations with other common genetic aberrations in HNSCC including the NOTCH signaling pathway, CDKN2A, PI3KCA and EGFR. Overall, mutational frequencies were similar between the FGFR1–4 altered cohort and the non-FGFR altered cohort in regards to CDKN2A (26.1% vs. 33.4%), NOTCH pathway (21.7% vs. 27.5%), and EGFR (8.7% vs. 9.7%; Figure 4B). Interestingly, we found a significantly lower frequency of PIK3CA gain-of-function mutations in FGFR1–4 altered patients (4.4% vs. 26.4%; P = 0.02). This data suggests that patients with FGFR alterations are unique from those with other activating mutations and that these patients trend towards mutually exclusive from patients with activating PIK3CA mutations.
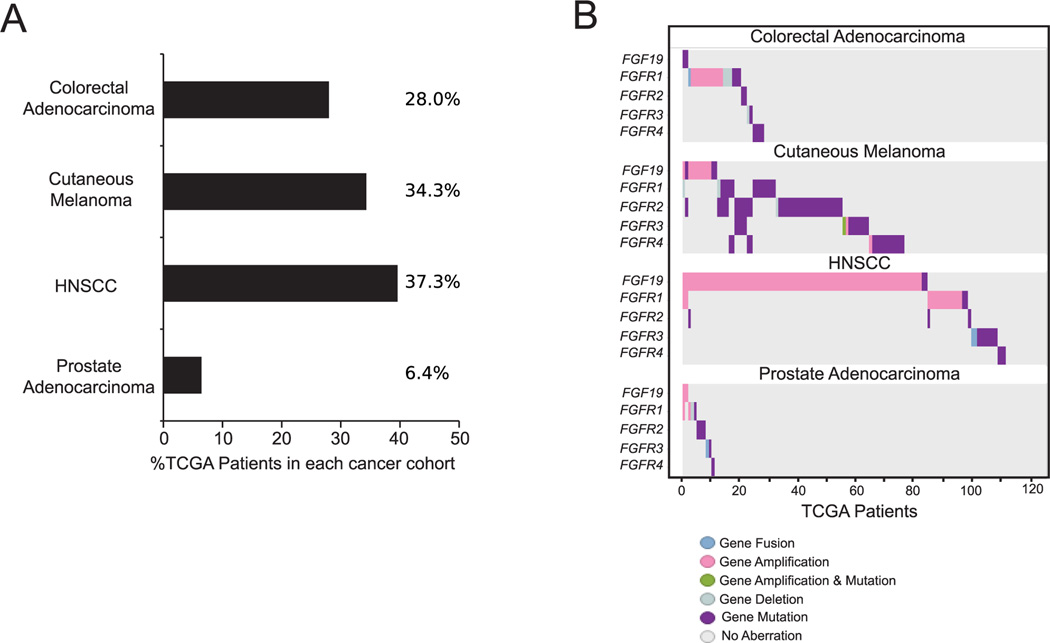
Subsequently, we analyzed FGF/FGFR dysregulation in other common cancers from TCGA in order to determine the potential involvement of this pathway across cancer types. Overall, FGF/FGFR dysregulation was identified in 28.0% of colorectal adenocarcinomas (73/261), 34.3% of cutaneous melanomas (106/309), and 6.4% of prostate carcinomas (16/249; Figure 5A). Notably, amplifications in FGFR1 and the FGF3/4/19 amplicon were more prevalent in HNSCC (Figure 5B; Supplemental Figure 1). Using FGF19 as a marker of the FGF3/4/19 amplicon, we examined RNA expression in relation to gene amplification. We did not find a correlation between FGF19 amplification status and RNA levels (Supplemental Figure 2A). Interestingly, however, FGF19 RNA expression in HNSCC is elevated relative to prostate and cutaneous melanoma (Supplemental Figure 2B).
Figure 5. Comparison of FGF/FGFR pathway alterations across cancer types.
Prevalence of FGF/FGFR pathway dysregulation is noted across colorectal adenocarcinoma (28.0%), cutaneous melanoma (34.3%), HNSCC (37.3%), and prostate carcinoma (6.4%; A). Specific genetic dysregulations in each cancer type is shown (B).
We then further assessed the individual gene and combined FGF/FGFR pathway correlations with clinical data from the TCGA data set. Interestingly, our analysis revealed that FGFR1 amplification was more frequent in African Americans. Data showed that 13.8% (4/29) of African American patients were found to have FGFR1 amplifications while only 3.1% (8/259) of Caucasian patients possessed the aberration (P < 0.01; Supplemental Figure 3). Further analysis of TCGA clinical correlates revealed that disruptive events in the FGF/FGFR genes were not significantly correlated with age, sex, smoking status, HPV status, TNM stage or grade in this cohort.
DISCUSSION
The fibroblast growth factor receptors (FGFR) are a receptor tyrosine kinase family that consists of four highly related genes (FGFR1–4).4 The FGF family further consists of 22 ligands (FGFs) that bind with high-affinity to the FGFRs.16 FGF binding leads to FGFR dimerization, receptor auto-phosphorylation, and activation of downstream signaling pathways17, including those involved in cell growth, differentiation, metabolism and oncogenesis.18 Notably, downstream pathways overlap with EGFR signaling pathways.
Disruption of normal FGF family functions has been linked to other cancers.4 These include non-small cell lung carcinoma (22% amplification of FGFR1 and 5% mutation in FGFR2)19–21, pancreatic carcinoma (50–70% amplification of FGFR1,3 or 4)22,23, thyroids carcinoma (FGFR1 and FGF2)24,25, gastric carcinoma (10% amplification of FGFR2)26,27, bladder carcinoma (40–50% mutation of FGFR3)28, and breast carcinoma (15% amplification of FGFR1).29,30 Furthermore, FGFR1 amplification has been established as an independent poor prognostic factor for the survival of breast cancer patients with estrogen receptor positive tumors.31
At this time, the role of the FGF/FGFR pathway is not well understood in HNSCC. Our index ELR patient demonstrated a putative driver amplification of FGFR1, suggesting a role for this receptor in HNSCC. Subsequent TCGA analysis of 292 patients demonstrated that FGF/FGFR family genes were deregulated by mutation, rearrangement or amplification in over 37% of all HNSCC tumors sequenced. We found an overall rate of 7.9% for FGFR aberrations with FGFR1 amplification being the most common (4.5%).
FGF ligand amplification was most prevalent in FGF3 (22.9%), FGF4 (21.2%) and FGF19 (22.6%). These three FGF ligands are on usually co-amplified (with the proto-oncogene CCND1) on the chromosome 11q13 locus.32,33 Because these genes are co-amplified, FGF3/4/19 amplification and overexpression may play a critical role in the pathogenesis of 11q13-amplified tumors. It is possible that one of the ligands FGF3/4/19 or CCND1 alone, or a combination of more than one gene, act as the driver(s) in this amplicon, with the remaining genes acting as passengers. Future systematic studies and follow-up genetic experiments will be needed to address this postulate.
This is the first time that HNSCC aberrations spanning the entire FGF family has been reported in the literature. While FGFR1 amplification has been previously reported, this is the first time that a racial variance has been described, with a higher frequency of FGFR1 amplifications in the African American population (13.8%) than the Caucasian population (3.1%). These findings warrant further investigation of independent cohorts to confirm this association.
Encouragingly, multiple orally available FGFR inhibitors are currently under evaluation in phase II and III trials in breast, thyroid, gastric, bladder and renal cancers.4,34 The aberrations identified in the FGF pathway in a subset of HNSCC suggests that these tumors may be susceptible to targeted pathway inhibition. This is particularly alluring as the majority of these are gene amplifications, suggesting overactivity of the FGF/FGFR pathway. Investigation into specific FGFR inhibitors via clinical trials and precision medicine programs is warranted, particularly in cases of recurrent or advanced disease in which traditional treatment options have been exhausted.35 Furthermore, further translational and clinical trial investigation into combinations of receptor tyrosine kinase (EGFR, HER2, FGFR) inhibition is alluring due to the fact that these receptors activate common downstream targets.36
Together, our data suggests that FGF/FGFR signaling is amplified in a subset of HNSCC patients. This new information suggests a rational methodology to leverage ELR-HNSCC patients to define molecular subsets of high risk HNSCC. It further provides a foundation for molecular stratification and advancement of precision medical pre-clinical and clinical trials of FGFR inhibitors in HNSCC.
Supplementary Material
Prevalence of FGF3, FGF4, FGF19, and CCND1 amplifications compared between colorectal adenocarcinoma, cutaneous melanoma, HNSCC, and prostate carcinoma. These genes are located in a locus on chromosome 11q13. Co-amplifications of FGF3/4/19 and CCND1 are evidenced in cutaneous melanoma, HNSCC, and prostate carcinoma, with significantly higher prevalence of amplifications in HNSCC.
Correlation between FGF19 gene amplification and actual RNA level (A). Comparison between FGF19 expression levels across multiple tumor types, including HNSCC (B). FGF19 RNA levels are higher in HNSCC in comparison to cutaneous melanoma and prostate carcinoma.
Percentage of FGFR1 amplification is denoted on the Y-axis and patient population is on the X-axis. This demonstrates that 13.8% (4/29) of African American patients were found to have FGFR1 amplifications while only 3.1% (8/259) of Caucasian patients possessed the aberration. (**p < 0.01).
Acknowledgments
Grant Support: Partial support provided by The University of Michigan Anatomic Pathology Projects Grant and NIDCR U01:DE025184-01
Footnotes
Conflicts of interest and financial disclosures: None
AUTHOR DISCLOSURE STATEMENT
The authors of this study report no commercial association or competing financial interests.
REFERENCES
- 1.Boyle P, Levin B, International Agency for Research on Cancer et al. World cancer report 2008. Lyon Geneva: International Agency for Research on Cancer; Distributed by WHO Press; 2008. [Google Scholar]
- 2.Allen CT, Law JH, Dunn GP, et al. Emerging insights into head and neck cancer metastasis. Head Neck. 2013;35:1669–1678. doi: 10.1002/hed.23202. [DOI] [PubMed] [Google Scholar]
- 3.Marur S, Forastiere AA. Head and neck cancer: changing epidemiology, diagnosis, and treatment. Mayo Clin Proc. 2008;83:489–501. doi: 10.4065/83.4.489. [DOI] [PubMed] [Google Scholar]
- 4.Kumar SB, Narasu L, Gundla R, et al. Fibroblast growth factor receptor inhibitors. Curr Pharm Des. 2013;19:687–701. [PubMed] [Google Scholar]
- 5.Freier K, Schwaenen C, Sticht C, et al. Recurrent FGFR1 amplification and high FGFR1 protein expression in oral squamous cell carcinoma (OSCC) Oral Oncol. 2007;43:60–66. doi: 10.1016/j.oraloncology.2006.01.005. [DOI] [PubMed] [Google Scholar]
- 6.Cancer Genome Atlas Network: Comprehensive genomic characterization of head and neck squamous cell carcinomas. Nature. 2015;29:576–582. doi: 10.1038/nature14129. [DOI] [PMC free article] [PubMed] [Google Scholar]
- 7.Warrick JI, Hovelson DH, Amin A, et al. Tumor evolution and progression in multifocal and paired non-invasive/invasive urothelial carcinoma. Virchows Arch. 2014 doi: 10.1007/s00428-014-1699-y. [DOI] [PMC free article] [PubMed] [Google Scholar]
- 8.Chang X, Wang K. wANNOVAR: annotating genetic variants for personal genomes via the web. J Med Genet. 2012;49:433–436. doi: 10.1136/jmedgenet-2012-100918. [DOI] [PMC free article] [PubMed] [Google Scholar]
- 9.McDaniel AS, Zhai Y, Cho KR, et al. HRAS mutations are frequent in inverted urothelial neoplasms. Hum Pathol. 2014;45:1957–1965. doi: 10.1016/j.humpath.2014.06.003. [DOI] [PMC free article] [PubMed] [Google Scholar]
- 10.Grasso CS, Wu YM, Robinson DR, et al. The mutational landscape of lethal castration-resistant prostate cancer. Nature. 2012;487:239–243. doi: 10.1038/nature11125. [DOI] [PMC free article] [PubMed] [Google Scholar]
- 11.Lonigro RJ, Grasso CS, Robinson DR, et al. Detection of somatic copy number alterations in cancer using targeted exome capture sequencing. Neoplasia. 2011;13:1019–1025. doi: 10.1593/neo.111252. [DOI] [PMC free article] [PubMed] [Google Scholar]
- 12.Rhodes DR, Yu J, Shanker K, et al. ONCOMINE: a cancer microarray database and integrated data-mining platform. Neoplasia. 2004;6:1–6. doi: 10.1016/s1476-5586(04)80047-2. [DOI] [PMC free article] [PubMed] [Google Scholar]
- 13.Rhodes DR, Kalyana-Sundaram S, Mahavisno V, et al. Oncomine 3.0: genes, pathways, and networks in a collection of 18,000 cancer gene expression profiles. Neoplasia. 2007;9:166–180. doi: 10.1593/neo.07112. [DOI] [PMC free article] [PubMed] [Google Scholar]
- 14.Pickering CR, Zhang J, Yoo SY, et al. Integrative genomic characterization of oral squamous cell carcinoma identifies frequent somatic drivers. Cancer Discov. 2013;3:770–781. doi: 10.1158/2159-8290.CD-12-0537. [DOI] [PMC free article] [PubMed] [Google Scholar]
- 15.Seiwart TY, Zuo Z, Keck MK, et al. Integrative and comparative genomic analysis of HPV-positive and HPV-negative head and neck squamous cell carcinomas. Clin Cancer Res. 2015;21:632–641. doi: 10.1158/1078-0432.CCR-13-3310. [DOI] [PMC free article] [PubMed] [Google Scholar]
- 16.Bottcher RT, Niehrs C. Fibroblast growth factor signaling during early vertebrate development. Endocr Rev. 2005;26:63–77. doi: 10.1210/er.2003-0040. [DOI] [PubMed] [Google Scholar]
- 17.Plotnikov AN, Schlessinger J, Hubbard SR, et al. Structural basis for FGF receptor dimerization and activation. Cell. 1999;98:641–650. doi: 10.1016/s0092-8674(00)80051-3. [DOI] [PubMed] [Google Scholar]
- 18.Wesche J, Haglund K, Haugsten EM. Fibroblast growth factors and their receptors in cancer. Biochem J. 2011;437:199–213. doi: 10.1042/BJ20101603. [DOI] [PubMed] [Google Scholar]
- 19.Dutt A, Ramos AH, Hammerman PS, et al. Inhibitor-sensitive FGFR1 amplification in human non-small cell lung cancer. PLoS One. 2011;6:e20351. doi: 10.1371/journal.pone.0020351. [DOI] [PMC free article] [PubMed] [Google Scholar]
- 20.Cancer Genome Atlas Research Network: Comprehensive genomic characterization of squamous cell lung cancers. Nature. 2012;489:519–525. doi: 10.1038/nature11404. [DOI] [PMC free article] [PubMed] [Google Scholar]
- 21.Weiss J, Sos ML, Seidel D, et al. Freqeuent and focal FGFR1 amplification associates with therapeutically tractable FGFR1 dependency in squamous cell lung cancer. Sci Transl Med. 2010;2:62ra93. doi: 10.1126/scitranslmed.3001451. [DOI] [PMC free article] [PubMed] [Google Scholar]
- 22.Ohta T, Yamamoto M, Numata M, et al. Expression of basic fibroblast growth factor and its receptor in human pancreatic carcinomas. Br J Cancer. 1995;72:824–831. doi: 10.1038/bjc.1995.420. [DOI] [PMC free article] [PubMed] [Google Scholar]
- 23.Shah RN, Ibbitt JC, Alitalo K, Jurst HC. FGFR4 overexpression in pancreatic cancer is mediated by an intronic enhancer activated by HNF1apha. Oncogene. 2002;21:8251–8261. doi: 10.1038/sj.onc.1206020. [DOI] [PubMed] [Google Scholar]
- 24.Shingu K, Fujimori M, Ito K, et al. Expression of fibroblast growth factor-2 and fibroblast growth factor receptor-1 in thyroid diseases: difference between neoplasms and hyperplastic lesions. Endocr J. 1998;45:35–43. doi: 10.1507/endocrj.45.35. [DOI] [PubMed] [Google Scholar]
- 25.Eggo MC, Quiney VM, Campbell S. Local factors regulating growth and function of human thyroid cells in vitro and in vivo. Mol Cell Endocrinol. 2003;213:47–58. doi: 10.1016/j.mce.2003.10.034. [DOI] [PubMed] [Google Scholar]
- 26.Yoshida T, Sakamoto H, Terada M. Amplified genes in cancer in upper digestive tract. Semin Cancer Biol. 1993;4:33–40. [PubMed] [Google Scholar]
- 27.Tsujimoto H, Sugihara H, Hagiwara A, Hattori T. Amplification of growth factor receptor genes and DNA ploidy pattern in the progression of gastric cancer. Virchows Arch. 1997;431:383–389. doi: 10.1007/s004280050115. [DOI] [PubMed] [Google Scholar]
- 28.Cappellen D, De Oliveira C, Ricol D, et al. Frequent activating mutations in FGFR3 in human bladder and cervix carcinomas. Nat Genet. 1999;23:18–20. doi: 10.1038/12615. [DOI] [PubMed] [Google Scholar]
- 29.Courjal F, Cuny M, Simony-Lafontaine J, et al. Mapping of DNA amplifications at 15 chromosomal localizations in 1875 breast tumors: definition of phenotypic groups. Cancer Res. 1997;57:4360–4367. [PubMed] [Google Scholar]
- 30.Turner N, Pearson A, Sharpe R, et al. FGFR1 amplification drives endocrine therapy resistance and is a therapeutic target in breast cancer. Cancer Res. 2010;70:2085–2094. doi: 10.1158/0008-5472.CAN-09-3746. [DOI] [PMC free article] [PubMed] [Google Scholar]
- 31.Andre F, Bachelot T, Campone M, et al. Targeting FGFR with dovitinib (TKI258): preclinical and clinical data in breast cancer. Clin Cancer Res. 2013;19:3693–3702. doi: 10.1158/1078-0432.CCR-13-0190. [DOI] [PubMed] [Google Scholar]
- 32.Gibcus JH, Kok K, Menkema L, et al. High-resolution mapping identifies a commonly amplified 11q13.3 region containing multiple genes flanked by segmental duplications. Hum Genet. 2007;121:187–201. doi: 10.1007/s00439-006-0299-6. [DOI] [PubMed] [Google Scholar]
- 33.Schödel J, Bardella C, Sciesielski LK, et al. Common genetic variants at the 11q13.3 renal cancer susceptibility locus influence binding of HIF to an enhancer of cyclin D1 expression. Nat Genet. 2012;44:420–425. doi: 10.1038/ng.2204. [DOI] [PMC free article] [PubMed] [Google Scholar]
- 34.Kim KB, Chesney J, Robinson D, et al. Phase I/II and pharmacodynamic study of dovitinib (TKI258), an inhibitor of fibroblast growth factor receptors and VEGF receptors, in patients with advanced melanoma. Clin Cancer Res. 2011;17:7451–7461. doi: 10.1158/1078-0432.CCR-11-1747. [DOI] [PubMed] [Google Scholar]
- 35.Conley BA, Doroshow JH. Molecular analysis for therapy choice: NCI MATCH. Semin Oncol. 2014;41:297–299. doi: 10.1053/j.seminoncol.2014.05.002. [DOI] [PubMed] [Google Scholar]
- 36.Brenner C, Birkeland AC. Personalizing medicine in head and neck squamous cell carcinoma: The rationale for combination therapies. Med Res Arch. 2015;3 doi: 10.18103/mra.v0i3.77. [DOI] [PMC free article] [PubMed] [Google Scholar]
Associated Data
This section collects any data citations, data availability statements, or supplementary materials included in this article.
Supplementary Materials
Prevalence of FGF3, FGF4, FGF19, and CCND1 amplifications compared between colorectal adenocarcinoma, cutaneous melanoma, HNSCC, and prostate carcinoma. These genes are located in a locus on chromosome 11q13. Co-amplifications of FGF3/4/19 and CCND1 are evidenced in cutaneous melanoma, HNSCC, and prostate carcinoma, with significantly higher prevalence of amplifications in HNSCC.
Correlation between FGF19 gene amplification and actual RNA level (A). Comparison between FGF19 expression levels across multiple tumor types, including HNSCC (B). FGF19 RNA levels are higher in HNSCC in comparison to cutaneous melanoma and prostate carcinoma.
Percentage of FGFR1 amplification is denoted on the Y-axis and patient population is on the X-axis. This demonstrates that 13.8% (4/29) of African American patients were found to have FGFR1 amplifications while only 3.1% (8/259) of Caucasian patients possessed the aberration. (**p < 0.01).


