

Abstract
Purpose of review
Particulate matter (PM) air pollution is a ubiquitous exposure linked with multiple adverse health outcomes for children and across the life course. The recent development of satellite based remote sensing models for air pollution enables the quantification of these risks and addresses many limitations of previous air pollution research strategies. We review the recent literature on the applications of satellite remote sensing in air quality research, with a focus on their use in epidemiological studies.
Recent findings
Aerosol optical depth (AOD) is a focus of this review and a significant number of studies show that ground-level PM can be estimated from columnar AOD. Satellite measurements have been found to be an important source of data for PM model-based exposure estimates, and recently have been used in health studies to increase the spatial breadth and temporal resolution of these estimates.
Summary
It is suggested that satellite-based models improve our understanding of the spatial characteristics of air quality. Although the adoption of satellite-based measures of air quality in health studies is in its infancy, it is rapidly growing. Nevertheless, further investigation is still needed in order to have a better understanding of the AOD contribution to these prediction models in order to use them with higher accuracy in epidemiological studies.
Keywords: remote sensing, AOD, air quality, health outcomes
1. Introduction
The World Health Organization has estimated that fine particulate matter (PM2.5) contributes to approximately 800,000 premature deaths per year, ranking PM2.5 as the 13th leading cause of mortality worldwide (1). PM2.5 has been associated inter alia with increased risk of myocardial infarction (2,3), reduced birth weight (4–6), cardiovascular disease (7–9) and respiratory disease (9,10). Most of the epidemiological studies on the health effects of air pollution have been conducted using measures of PM collected from sparse networks of stationary ground monitors as the exposure metric. The availability of these monitors can vary widely, particularly in rural or developing areas. These limitations can potentially bias estimates of health effects, due to exposure estimation errors (i.e., assigning inaccurate exposure from spatially misaligned ground monitoring locations). The development of models to assess air pollution exposures for health studies is a growing field of environmental research. Generally, six classes of models can be identified (i) proximity-based assessments (e.g. distance to major roadways), (ii) statistical interpolation between sparse monitoring networks, (iii) land use regression models that parameterize spatial characteristics on a training dataset, (iv) line dispersion models, (v) integrated emission-meteorological models, and (vi) hybrid models (11). Hybrid models include those that combine elements of land use regression, accounting for local features, augmented with proxy measures of aerosol distribution from satellite remote sensing. These new hybrid models have been able to obtain population representative samples over large areas while capturing the role of exposure variation at the individual level. Furthermore, in areas where surface monitoring is sparse or not available, satellite remote sensing can be used to assess PM2.5 concentrations (12–16).
1.1 Satellite remote sensing measurements
Satellites carry instruments which measure electromagnetic radiation coming from the Earth-Ocean-Land-Atmosphere System, including back reflected solar radiation and emitted infrared radiation. This review is focused on the use of satellite-based models for PM exposure assessment. Since the mid-1990s a new generation of Earth-observing satellites has been able to detect tropospheric air pollution at increasingly high spatial and temporal resolution (17). This review article summarizes recent work that relates satellite measurements to quantification of primary emissions, with a focus on the relation between the common satellite-based Aerosol Optical Depth (AOD), also known as Aerosol Optical Thickness (AOT), and PM. AOD is a unitless measure defined as the integral of the aerosol extinction coefficients along the vertical atmospheric column from Earth's surface to the top of the atmosphere at given wavelengths due to scattering and absorption along the measured atmospheric column. Generally, low AOD values are observed on clear days while AOD values greater than 0.5 are mostly related to the presence of atmospheric dust/pollution (18).
1.2 Satellite instruments
One commonly used instrument for measuring AOD is the Moderate Resolution Imaging Spectroradiometer (MODIS), which measures particle abundance with nearly global coverage at moderate spatial resolutions (10 km / 3 km at nadir), even over complex land surfaces. There are MODIS instruments aboard both the Terra (equator crossing time 10:30) and Aqua (equator crossing time 13:30) satellites (19). AOD can also be observed from a geostationary orbit, offering high temporal resolution (e.g. every 30 minutes). Examples of geostationary platforms with AOD products include the U.S. Geostationary Orbiting Earth Satellite (GOES) series (20), the Japanese GMS and MTSAT, and the European SEVIRI (21). The geostationary AOD products offer higher observation frequency but have larger errors than MODIS (22). The Suomi-NPP VIIRS instrument was launched in October 2011 and has similar capabilities to MODIS but with higher resolution (6 km at nadir), and the retrieval algorithm necessary to generate AOD products for use in satellite models of air pollution is developing rapidly (21). Techniques that enhance the usefulness of current retrievals are discussed including the use of a higher resolution (1 km) derived AOD product called the Multi-Angle Implementation of Atmospheric Correction (MAIAC) (23,24). In addition to AOD, other sources of information have been used to estimate PM speciation in air quality investigations (e.g. augmenting with the GEOS-Chem chemical transport model; (12,25).
Over the recent years there has been a growing use of satellite modeling in epidemiological studies. Multiple studies have reliably shown the use of exposure assessment from satellite-based models. These studies include investigation of the association between PM air pollution and cardiovascular disorders (26), emergency room admissions (6,27), and birth outcomes (28–31), and specific health disorders due to specific exposures such as dust events (32), or traffic-pollution (33), among others (34–36). The following sections further discuss these studies. Section (2) summarizes the use of satellite observations in air quality estimation studies with a focus on their use in environmental health studies (2.1) and in Pediatrics (2.2). Section (3) explains the gaps and limitations of using satellite-borne data in PM estimation models for health applications and Section (4) concludes this work.
2. Using satellite observations for air quality monitoring
The use of AOD to assess ground-based PM concentrations has been actively researched for over a decade. Most advanced models using AOD can estimate daily PM2.5 concentrations with relatively high accuracy. These estimates are then averaged spatially (e.g., from a fixed grid up to larger areas such as census tracts or zip codes in order to be linked to population and disease characteristics) and/or temporally (e.g., from daily to weekly, monthly, or a longer period for trend analysis) (37**).
Following is a summary of recent publications exploring the AOD-PM relationships and its use in epidemiological studies. Typically, exposure to PM2.5 in such epidemiological studies is assessed using measurements from air quality monitoring stations. However, in many geographical areas, ground PM2.5 monitoring networks are sparse and non-ideally deployed for environmental health studies. Satellite remote sensing can be used to assess PM2.5 in areas where surface monitoring is limited or not available. Figure 1 demonstrates the expanded spatial coverage of a 10 km satellite-based model compared to the PM2.5 monitoring network in the mid-Atlantic USA. While many studies explored the use of a univariate satellite-based prediction model (12–16,38–41), Kloog and colleagues demonstrated that a hybrid approach incorporating MODIS AOD and commonly used LUR variables and meteorological variables, improved the PM2.5 predictions (42**,43). The hybrid model was fit with mixed effects regression models with random slopes and intercepts for the AOD-PM relationship for day, based on 8 years of data across New-England, USA (mean R2 = 0.83). Furthermore they used spatial smoothing to predict PM2.5 concentrations for day-locations with missing AOD measurements. Finally, local (100 m) land use terms were used to model the residual difference between grid cell predictions and monitored values to capture very local particle sources.
Figure 1.
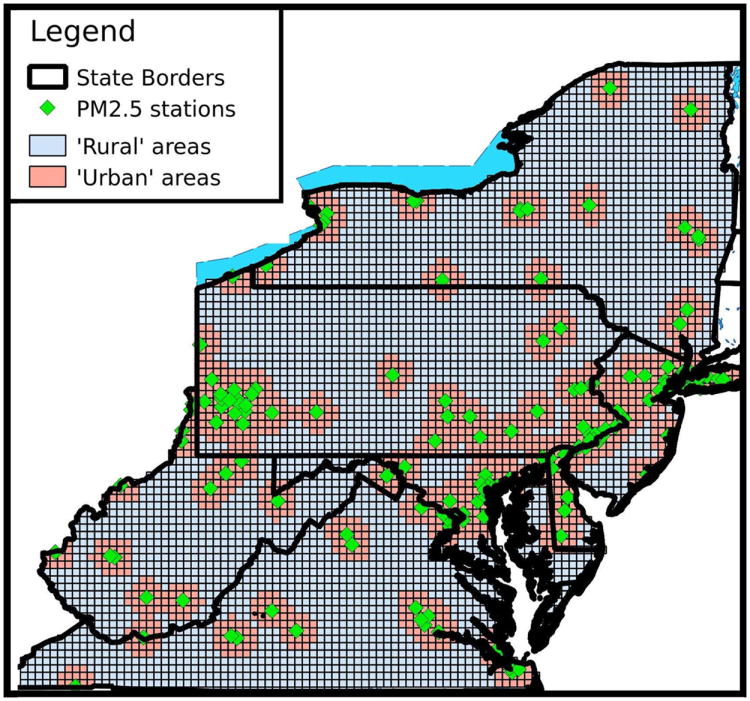
Example of how a satellite-based model (shown as a 10-km grid) can cover the entire population and not just those living near PM2.5 stations (30km buffer in red) in the mid-Atlantic, USA, which are predominantly sited in urban areas.
This approach of incorporating LUR variables and calibrating with a mixed effects model was applied in several studies based on AOD from the MODIS 10 km algorithm (44–46) and from the MAIAC 1 km AOD retrieval algorithm (47–51). Using high spatial resolution satellite data improved prediction results in Israel (48) and in the Northeast USA, where (49) reported mean cross-validated R2 of 0.88 for PM prediction with spatial and temporal components of R2=0.87. These studies also used inverse probability weighting (IPW) to account for nonrandom missingness of AOD, usually due to seasonality (e.g. seasonal cloud cover patterns). This approach enabled control for the inherent day-to-day variability in the AOD-PM relationship, which depends on time-varying parameters such as particle optical properties, vertical and diurnal concentration profiles and ground surface reflectance among others (52). Lee and colleagues developed a model for the Southeast USA, based on over 10 years of data (53). They divided the study area into three regions and applied separate mixed-effect models to calibrate AOD to each region as the optical properties may vary over large areas, even within a single day. Similar results were obtained to models in the Northeast USA, with R2 values of 0.7-0.81, and root mean squared prediction errors of 1-2.89 μg/m3. Similar results were found by (46) which applied these methods over Northern Italy for estimating PM10 concentrations. The three-stage model allows the assessment of short term and long-term human exposures in order to investigate both the acute and chronic effects of ambient particles, respectively (42**). The model results show high predictive accuracy at high spatial resolutions, in different locations, and will be useful in reconstructing worldwide exposure histories for epidemiological studies (49). Other calibration modeling approaches, apart from the mixed model, used in this field include Geographically Weighted Regression (GWR) (54,55), GAM and MARS (56), Kriging (57), and the addition of other non-satellite sources with likely independent sources of error (e.g. Geos-Chem chemical transport model) have been used to better understand the sources, seasonality, and trends of aerosols (58,59).
2.1 The use of satellite data in environmental health studies
The use of satellite observations in environmental health studies started during 2009 in the United States (26,60). It has been the first time AOD was used to expand the PM2.5 exposure matrix to obtain a spatially complete PM surface, for investigating the association between PM2.5 concentrations and coronary heart disease outcomes in the USA. Both studies focused on the Eastern part of the USA where better correlations between AOD and PM2.5 exist because of the spectral properties of the background surfaces (dark and vegetated).
This ability to estimate PM concentrations based on satellite data should greatly speed up the progress of air pollution health effects studies, particularly in developing countries which may have substantially worse air quality but fewer dense ground monitoring networks (61). Chiu et al. examined the effects of prenatal community-level psychosocial (exposure to community violence (ECV) and physical (air pollution) stressors on repeated wheeze in 708 urban children followed to age of 2 years (62). They used the methodology developed by (42**) based on MODIS 10 km AOD data and found associations between ECV and satellite based PM2.5 estimations. Van Rossem and colleagues examined associations of antenatal exposure to ambient air pollution with newborn systolic blood pressure (SBP). Estimated PM2.5 exposure data were generated by previously described prediction models validated for the New England region (43) for the period 2000-2008. The prediction model was also based on the 10 km MODIS AOD product. They found, among others, that exposures to PM2.5 and modeled black carbon (BC) in late pregnancy were positively associated with newborn SBP e.g., 1.0 mmHg; 95% CI: 0.1, 1.8 for a 0.32-μg/m3 increase in mean 90-day residential BC) (63). Wang and colleagues demonstrated a method for directly assessing PM-induced acute adverse health effects by satellite remote sensing, without a prior calibration stage based on ground monitoring data (64**). They examined the acute health impacts of airborne particles estimated directly from the MODIS 10 km AOD product in China for the year 2006 and found positive associations. Recently, a cohort-based study was published presenting results over 16 years of studying the associations between exposure to ambient PM2.5, O3, and NO2 with mortality in Canada (65**). Additionally, other health outcomes were studied with use of satellite-based models, such as deep vein thrombosis (27) and other variables, apart from PM, estimated from remote sensing products have also been associated with health outcomes, including ambient temperature (29,66). Given the recently achieved worldwide coverage of high resolution satellite data, applications in health studies are rapidly expanding.
2.2 The use of satellite data in the field of Pediatrics
In recent years, the advantages of using satellite data to expand the spatiotemporal PM exposure matrix has expanded the scope of air pollution research in the field of pediatrics. Anderson and colleagues investigated community-level associations between asthma prevalence data from the International Study of Asthma and Allergies in Childhood (ISAAC) and satellite-based estimates of PM2.5 and nitrogen dioxide (NO2) (67). Compositional data was obtained from the global chemical transport model GEOS-Chem (http://www.geos-chem.org/) and total columnar AOD was obtained from two spectroradiometers (MODIS and MISR) to estimate PM2.5 and NO2 at a spatial resolution of 10 km. In contrast to reports from within-community studies of individuals exposed to traffic pollution, they did not find evidence of a positive association between ambient air pollution and asthma prevalence as measured at the community level.
Kloog et al. (2012) studied the association between adverse birth outcomes, such as low birth weight and premature birth exposure, and ambient air pollution (68). They evaluated estimated PM2.5 concentrations during pregnancy in Massachusetts for a 9-year period (2000–2008). Similar to previously discussed studies, they also used a multi-stage calibration detailed in (42**) on a spatial resolution of a 10 km grid. They used a two-stage model using both linear and logistic mixed models. Their conclusions suggest that exposure to PM2.5 during the last month of pregnancy contributes to risks for lower birth weight and preterm birth in infants. Lakshmanan and colleagues also studied birth outcomes in relation to prenatal traffic-related air pollution exposure (30). Fine particulate matter (PM2.5) was estimated using a hybrid LUR model incorporating satellite-derived AOD measurements. Their findings support existing associations of prenatal exposure to traffic-related air pollution and reduced birth weight, which were most evident among males born to obese mothers.
Utilizing the same satellite-based estimation model, Kloog et al. looked at the association between ambient temperature (Ta), PM2.5 and birth outcomes (29). They evaluated birth outcomes and average daily Ta during various prenatal exposure periods in Massachusetts (USA) using both ground measured Ta and satellite-based modeled Ta, and found that Ta during pregnancy was associated with lower birth weight and shorter gestational age in the studied population. Hyder et al. used an integrated database of ground measurements and satellite-based observations to study the relation between air pollution and adverse birth outcomes in the Northeast US for the years 2000-2006 (69). They used the statistical method developed by Lee et al., for using satellite-based AOD and spatial clustering to predict PM2.5 concentrations (70). Their results support the increasing usefulness of satellite data in health effects studies. Future studies should consider the spatial and temporal resolution of satellite data and other limitations as detailed in Section (3).
Recent health studies in Pediatrics presented in this section, and others, are summarized in Table 1.
Table 1.
Summary of recent studies in pediatrics using satellite-based modeling to estimate exposure to ground PM concentrations. Most studies have been conducted on data from MA, USA where currently, the satellite-based model is the most developed.
| Health Outcome | Author | Estimated exposure matrix | Time period |
|---|---|---|---|
| Childhood Cognition | Harris et al., 2015 (71) | BC, PM2.5 | Viva birth cohort |
| Fetal Growth and Birth Outcomes | Kloog et al., 2012 (68) | PM2.5 | 2002-2008 |
| Fleisch et al., 2014 (72) | Traffic related | Viva birth cohort | |
| van Rossem et al. 2015 (63) | BC, PM2.5 | During pregnancy of over 1000 woman | |
| Fleisch et al., 2015 (33) | PM2.5 | Viva birth cohort | |
| Lakshmanan et al., 2015 (30) | BC, PM2.5 | 2002-2009 | |
| Hyder et al., 2014 (69) | PM2.5 | 2000-2006 | |
| Kloog et al., 2015 (29) | temperature | 2000-2008 | |
| Respiratory | Anderson et al., 2012 (67) | PM2.5, O3, NO2 | Global scale |
| Chiu et al., 2013 (62) | BC, PM2.5 | 2002-2009 |
3. Gaps in satellite remote sensing
Although many studies point out promising results of improved PM predictions based on satellite data, health researchers seeking to use these data should be familiar with common limitations.
Ground PM concentrations are point measurements measured at fixed locations that may be more representative of the breathing zone compared to the raw AOD that represents the integration of the whole atmospheric column. For example, the AOD can capture aerosols aloft that are not captured by the ground monitors.
Ground PM concentrations are monitored on a continuous (e.g. half hourly/hourly/daily) scale while the AOD is retrieved only when the satellite passes overhead which is typically once a day for the most frequently used instruments. The measure derived at the overpass hour thus will not necessarily represent diurnal variability at each location.
The AOD used by itself doesn't represent the PM speciation nor the size distribution, two important characteristics of the toxicity of PM, and therefore should be used with caution in health studies.
Knowing the aerosol vertical profile and composition may assist in understanding more accurately what underlies the AOD physical measurements and therefore the contribution of AOD to PM estimation. Studies with data on ground level PM, boundary layer conditions, and the aerosol vertical profile, are better able to augment exposure models with AOD.
Remote sensing is most useful for estimating ambient exposures and will not reflect indoor exposure levels or personal sources of exposure (e.g. cook stoves).
Satellite data is available on clear days as cloudiness masks retrieval abilities. Estimation of exposure in the absence of AOD requires data augmentation or statistical modeling.
Although satellite-based models have proved to be useful for assessing ground measurements in health outcome studies, their limitations should be taken in account.
4. Conclusions
In conclusion, statistical models driven by satellite aerosol remote sensing data can be valuable tools to generate PM2.5 exposure estimates over large areas. Aerosols have been quantified using AOD and the relationship between AOD and PM2.5 and PM10 is being actively investigated. Furthermore, in recent years there is an increasing use of satellite data in epidemiological studies. Although the desire for the use of satellite data for air quality purposes is widely stated, many of the measurements are still limited. Satellite observations fill gaps in areas where there are insufficient ground sensors, but don't allow for the quantification of the aerosol size distribution or composition. Satellite based modelling is still in its infancy. Modern multisensor platforms from polar and geostationary orbits have accrued less than 15 years of recorded data, however these are currently available as prospective measures for contemporary health studies. As the satellite data are publicly available and easy to obtain, in combination with limited ground observations, the spatial and temporal characteristics of regional PM2.5 levels can be established quantitatively in a relatively short period. This ability should greatly speed up the progress of air pollution health effects studies, particularly in developing countries. Moreover, as satellite remote sensing evolves, higher spatial resolution data (e.g 3×3 km and 1×1 km) has more recently become available. This finer resolution will further reduce exposure error in epidemiologic applications quantifying the health impacts of air pollution and should enable us to more precisely estimate daily exposures and better understand how they vary across different spatial locations.
For researchers looking into adding environmental exposure to their research we would suggest contacting any of the above groups working with satellite-based modeling to explore the feasibility of developing such models in the area of interest. We should note that many of the groups are working to expand their model to the whole USA and other areas around the world. These models should be available in the upcoming years.
Key points.
We review the applications of satellite remote sensing in air quality research, focusing on epidemiologic studies
We focus on the use of such satellite data in the field of Pediatrics
We also discuss the gaps and limitations of using these satellite based models
Acknowledgments
None
Financial support and sponsorship: This work was partially supported by NIH grants R00ES023450, P30ES023515.
Footnotes
Conflicts of interest: None
References
Papers of particular interest, published within the annual period of review, have been highlighted as:
* of special interest
** of outstanding interest
- 1.WHO. WHO | The world health report 2002 - Reducing Risks, Promoting Healthy Life. Geneva, Switzerland: 2002. [DOI] [PubMed] [Google Scholar]
- 2.D'Ippoliti D, Forastiere F, Ancona C, Agabiti N, Fusco D, Michelozzi P, et al. Air pollution and myocardial infarction in Rome: a case-crossover analysis. Epidemiology. 2003;14(5):528–35. doi: 10.1097/01.ede.0000082046.22919.72. [DOI] [PubMed] [Google Scholar]
- 3.Zanobetti A, Schwartz J. The Effect of Particulate Air Pollution on Emergency Admissions for Myocardial Infarction: A Multicity Case-Crossover Analysis. Environ Health Perspect. 2005 Aug;113(8):978–82. doi: 10.1289/ehp.7550. [DOI] [PMC free article] [PubMed] [Google Scholar]
- 4.Zeka A, Schwartz J, Melly S. Traffic-Related and Socioeconomic Indicators in Association With Low Birth Weight and Preterm Births in Eastern Massachusetts Between 1996 and 2002. Epidemiology. 2006;17(6):S105. [Google Scholar]
- 5.Bell ML, Ebisu K, Belanger K. Ambient air pollution and low birth weight in Connecticut and Massachusetts. Env Heal Perspect. 2007;115(7):1118. doi: 10.1289/ehp.9759. [DOI] [PMC free article] [PubMed] [Google Scholar]
- 6.Kloog I, Melly SJ, Ridgway WL, Coull Ba, Schwartz J. Using new satellite based exposure methods to study the association between pregnancy PM2.5 exposure, premature birth and birth weight in Massachusetts. [cited 2014 Dec 28];Environ Health [Internet] 2012 Jan;11(1):40. doi: 10.1186/1476-069X-11-40. Available from: http://www.pubmedcentral.nih.gov/articlerender.fcgi?artid=3464884&tool=pmcentrez&rendertype=abstract. [DOI] [PMC free article] [PubMed] [Google Scholar]
- 7.Schwartz J. Air pollution and hospital admissions for cardiovascular disease in Tucson. Epidemiology. 1997;8(4):371–7. doi: 10.1097/00001648-199707000-00004. [DOI] [PubMed] [Google Scholar]
- 8.Mann JK, Tager IB, Lurmann F, Segal M, Quesenberry CP, Jr, Lugg MM, et al. Air pollution and hospital admissions for ischemic heart disease in persons with congestive heart failure or arrhythmia. Env Heal Perspect. 2002;110(12):1247. doi: 10.1289/ehp.021101247. [DOI] [PMC free article] [PubMed] [Google Scholar]
- 9.Dominici F, Peng RD, Bell ML, Pham L, McDermott A, Zeger SL, et al. Fine particulate air pollution and hospital admission for cardiovascular and respiratory diseases. Jama. 2006;295(10):1127–34. doi: 10.1001/jama.295.10.1127. [DOI] [PMC free article] [PubMed] [Google Scholar]
- 10.Schwartz J. Air pollution and hospital admissions for respiratory disease. Epidemiology. 1996;7(1):20–8. doi: 10.1097/00001648-199601000-00005. [DOI] [PubMed] [Google Scholar]
- 11.Jerrett M, Arain A, Kanaroglou P, Beckerman B, Potoglou D, Sahsuvaroglu T, et al. A review and evaluation of intraurban air pollution exposure models. J Expo Anal Environ Epidemiol. 2005;15(2):185–204. doi: 10.1038/sj.jea.7500388. [DOI] [PubMed] [Google Scholar]
- 12.van Donkelaar A, Martin RV, Brauer M, Kahn R, Levy R, Verduzco C, et al. Global estimates of ambient fine particulate matter concentrations from satellite-based aerosol optical depth: development and application. [cited 2014 Oct 9];Environ Health Perspect [Internet] 2010 Jun;118(6):847–55. doi: 10.1289/ehp.0901623. Available from: http://www.pubmedcentral.nih.gov/articlerender.fcgi?artid=2898863&tool=pmcentrez&rendertype=abstract. [DOI] [PMC free article] [PubMed] [Google Scholar]
- 13.Gupta P, Christopher Sa. Seven year particulate matter air quality assessment from surface and satellite measurements. Atmos Chem Phys Discuss [Internet] 2008 Jan 9;8(1):327–65. Available from: http://www.atmos-chem-phys-discuss.net/8/327/2008/ [Google Scholar]
- 14.Gupta P, Christopher Sa, Wang J, Gehrig R, Lee Y, Kumar N. Satellite remote sensing of particulate matter and air quality assessment over global cities. [cited 2014 Nov 12];Atmos Environ [Internet] 2006 Sep;40(30):5880–92. Available from: http://linkinghub.elsevier.com/retrieve/pii/S1352231006002858. [Google Scholar]
- 15.Koelemeijer RBa, Homan CD, Matthijsen J. Comparison of spatial and temporal variations of aerosol optical thickness and particulate matter over Europe. [cited 2014 Dec 28];Atmos Environ [Internet] 2006 Sep;40(27):5304–15. Available from: http://linkinghub.elsevier.com/retrieve/pii/S1352231006004183. [Google Scholar]
- 16.Engel-Cox JA, Holloman CH, Coutant BW, Hoff RM. Qualitative and quantitative evaluation of MODIS satellite sensor data for regional and urban scale air quality. Atmos Environ. 2004;38(16):2495–509. [Google Scholar]
- 17.Hoff RM, Christopher SA. Remote sensing of particulate pollution from space: have we reached the promised land? J Air Waste Manage Assoc. 2009;59(6):645–75. [PubMed] [Google Scholar]
- 18.Gupta P, Mattoo S, Munchak L, Kleidman R, Patadi FLRC. Overview of Collection 6 Dark-Target aerosol product, MODIS Atmosphere Team Collection 6 Webinar Series. 2014 2014. Available from: http://aerocenter.gsfc.nasa.gov/ext/registration/
- 19.Levy RC, Remer LA, Mattoo S, Kaufman YJ, Systems S. Algorithm for Remote Sensing of Tropospheric Aerosol Over Dark Targets From Modis : Collections 005 and 051 : Revision 2. 2009 Feb;2009:1–96. [Google Scholar]
- 20.Prados AI, Kondragunta S, Ciren P, Knapp KR. GOES Aerosol/Smoke Product (GASP) over North America: Comparisons to AERONET and MODIS observations. J Geophys Res [Internet] 2007;112(D15):D15201. Available from: http://doi.wiley.com/10.1029/2006JD007968. [Google Scholar]
- 21*.Streets DG, Canty T, Carmichael GR, de Foy B, Dickerson RR, Duncan BN, et al. Emissions estimation from satellite retrievals: A review of current capability. Atmos Environ [Internet] 2013;77:1011–42. Available from: http://linkinghub.elsevier.com/retrieve/pii/S1352231013004007. [Google Scholar]
- 22.Paciorek CJ, Liu Y, Moreno-Macias H, Kondragunta S. Spatiotemporal Associations between GOES Aerosol Optical Depth Retrievals and Ground-Level PM 2.5. [cited 2014 Dec 28];Environ Sci Technol [Internet] 2008 Aug;42(15):5800–6. doi: 10.1021/es703181j. Available from: http://pubs.acs.org/doi/abs/10.1021/es703181j. [DOI] [PubMed] [Google Scholar]
- 23.Lyapustin A, Martonchik J, Wang Y, Laszlo I, Korkin S. Multiangle implementation of atmospheric correction (MAIAC): 1. Radiative transfer basis and look-up tables. J Geophys Res Atmos [Internet] 2011;116(D3) Available from: http://onlinelibrary.wiley.com/doi/10.1029/2010JD014985/full. [Google Scholar]
- 24.Lyapustin A, Wang Y, Laszlo I, Kahn R, Korkin S, Remer L, et al. Multiangle implementation of atmospheric correction (MAIAC): 2. Aerosol algorithm. J Geophys Res Atmos [Internet] 2011;116(D3) Available from: http://www.agu.org/journals/jd/jd1103/2010JD014986/ [Google Scholar]
- 25.Henze DK, Seinfeld JH, Shindell DT. Inverse modeling and mapping US air quality influences of inorganic PM2.5 precursor emissions using the adjoint of GEOS-Chem. Atmos Chem Phys Discuss [Internet] 2008;8(16):15031–99. Available from: http://www.atmos-chem-phys.net/9/5877/2009/ [Google Scholar]
- 26.Hu Z. Spatial analysis of MODIS aerosol optical depth, PM2.5, and chronic coronary heart disease. [cited 2014 Dec 28];Int J Health Geogr [Internet] 2009 Jan;8(Ci):27. doi: 10.1186/1476-072X-8-27. Available from: http://www.pubmedcentral.nih.gov/articlerender.fcgi?artid=2698917&tool=pmcentrez&rendertype=abstract. [DOI] [PMC free article] [PubMed] [Google Scholar]
- 27*.Kloog I, Zanobetti A, Nordio F, Coull B, Baccarelli A, Schwartz J. Effects of airborne fine particles (PM2.5) on Deep Vein Thrombosis Admissions in North Eastern United States. J Thromb Haemost [Internet] 2015 Jan;:n/a–n/a. doi: 10.1111/jth.12873. Available from: http://doi.wiley.com/10.1111/jth.12873. [DOI] [PMC free article] [PubMed]
- 28.Kloog I, Portnov B. Detecting the Association between Children Health and Lead Exposure Using Voronoi Polygon Rezoning. Geogr Res Forum. 2012;32:46–61. [Google Scholar]
- 29*.Kloog I, Melly SJ, Coull BA, Nordio F, Schwartz JD. Using Satellite-Based Spatiotemporal Resolved Air Temperature Exposure to Study the Association between Ambient Air Temperature and Birth Outcomes in Massachusetts. Env Heal Perspect [Internet] 2015 doi: 10.1289/ehp.1308075. Available from: http://dx.doi.org/10.1289/ehp.1308075. [DOI] [PMC free article] [PubMed]
- 30*.Lakshmanan A, Chiu YHM, Coull BA, Just AC, Maxwell SL, Schwartz J, et al. Associations between prenatal traffic-related air pollution exposure and birth weight: Modification by sex and maternal pre-pregnancy body mass index. Env Res [Internet] 2015;137C:268–77. doi: 10.1016/j.envres.2014.10.035. Available from: http://dx.doi.org/10.1016/j.envres.2014.10.035. [DOI] [PMC free article] [PubMed] [Google Scholar]
- 31.Andersen ZJ, Raaschou-Nielsen O, Ketzel M, Jensen SS, Hvidberg M, Loft S, et al. Diabetes Incidence and Long-Term Exposure to Air Pollution: A cohort study. Diabetes Care [Internet] 2012;35(1):92–8. doi: 10.2337/dc11-1155. Available from: http://www.ncbi.nlm.nih.gov/pubmed/22074722. [DOI] [PMC free article] [PubMed] [Google Scholar]
- 32.Goudie AS. Desert dust and human health disorders. [cited 2014 Dec 28];Environ Int [Internet] 2014 Feb;63:101–13. doi: 10.1016/j.envint.2013.10.011. Available from: http://www.sciencedirect.com/science/article/pii/S0160412013002262. [DOI] [PubMed] [Google Scholar]
- 33*.Fleisch AF, Rifas-Shiman SL, Koutrakis P, Schwartz JD, Kloog I, Melly S, et al. Prenatal Exposure to Traffic Pollution: Associations with Reduced Fetal Growth and Rapid Infant Weight Gain. Epidemiology [Internet] 2015;26(1):–. doi: 10.1097/EDE.0000000000000203. Available from: http://journals.lww.com/epidem/Fulltext/2015/01000/Prenatal_Exposure_to_Traffic_Pollution__.8.aspx. [DOI] [PMC free article] [PubMed] [Google Scholar]
- 34.Zanobetti A, Coull BA, Gryparis A, Kloog I, Sparrow D, Vokonas PS, et al. Associations between arrhythmia episodes and temporally and spatially resolved black carbon and particulate matter in elderly patients. Occup Environ Med [Internet] 2013 doi: 10.1136/oemed-2013-101526. oemed – 2013. Available from: http://oem.bmj.com/content/early/2013/10/18/oemed-2013-101526.short. [DOI] [PMC free article] [PubMed]
- 35.Madrigano J, Kloog I, Goldberg T, Coull BA, Mittleman MA, Schwartz J, et al. Long-term exposure to PM2.5 and incidence of acute myocardial infarction. Environ Health Perspect [Internet] 2013 Nov;121(2):192–6. doi: 10.1289/ehp.1205284. Available from: http://www.pubmedcentral.nih.gov/articlerender.fcgi?artid=3569684&tool=pmcentrez&rendertype=abstract\nhttp://dx.doi.org/10.1289/ehp.1205284. [DOI] [PMC free article] [PubMed] [Google Scholar]
- 36*.Wilker EH, Ljungman PL, Rice MB, Kloog I, Schwartz J, Gold DR, et al. Relation of Long-Term Exposure to Air Pollution to Brachial Artery Flow-Mediated Dilation and Reactive Hyperemia. Am J Cardiol. 2014;113(12):2057–63. doi: 10.1016/j.amjcard.2014.03.048. [DOI] [PMC free article] [PubMed] [Google Scholar]
- 37**.Duncan BN, Prados AI, Lamsal LN, Liu Y, Streets DG, Gupta P, et al. Satellite data of atmospheric pollution for U.S. air quality applications: Examples of applications, summary of data end-user resources, answers to FAQs, and common mistakes to avoid. [cited 2015 Apr 8];Atmos Environ [Internet] 2014 Sep;94:647–62. Available from: http://linkinghub.elsevier.com/retrieve/pii/S1352231014004270 This is the most recent review on satellite data applications in air quality in the USA. [Google Scholar]
- 38.Liu Y, Sarnat Ja, Kilaru V, Jacob DJ, Koutrakis P. Estimating Ground-Level PM 2.5 in the Eastern United States Using Satellite Remote Sensing. [cited 2014 Dec 23];Environ Sci Technol [Internet] 2005 May;39(9):3269–78. doi: 10.1021/es049352m. Available from: http://pubs.acs.org/doi/abs/10.1021/es049352m. [DOI] [PubMed] [Google Scholar]
- 39.Liu LJS, Curjuric I, Keidel D, Heldstab J, K, Bayer-Oglesby L, et al. Characterization of source-specific air pollution exposure for a large population-based Swiss cohort (SAPALDIA) Env Heal Perspect. 2007;115(11):1638–45. doi: 10.1289/ehp.10177. [DOI] [PMC free article] [PubMed] [Google Scholar]
- 40.Chudnovsky A, Tang C, Lyapustin A, Wang Y, Schwartz J, Koutrakis P. A critical assessment of high-resolution aerosol optical depth retrievals for fine particulate matter predictions. Atmos Chem Phys [Internet] 2013;13(21):10907–17. Available from: http://www.atmos-chem-phys.net/13/10907/2013/acp-13-10907-2013.html. [Google Scholar]
- 41.Lee HJ, Kang CM, Coull Ba, Bell ML, Koutrakis P. Assessment of primary and secondary ambient particle trends using satellite aerosol optical depth and ground speciation data in the New England region, United States. [cited 2015 Sep 28];Environ Res [Internet] 2014 Aug;133:103–10. doi: 10.1016/j.envres.2014.04.006. Available from: http://www.ncbi.nlm.nih.gov/pubmed/24906074. [DOI] [PMC free article] [PubMed] [Google Scholar]
- 42**.Kloog I, Koutrakis P, Coull BA, Lee HJ, Schwartz J. Assessing temporally and spatially resolved PM2.5 exposures for epidemiological studies using satellite aerosol optical depth measurements. Atmos Environ [Internet] 2011;45(35):6267–75. Available from: http://www.sciencedirect.com/science/article/pii/S1352231011009125 This study presents the initial satellite-based model for estimating PM, that many health studies have been used. [Google Scholar]
- 43.Kloog I, Nordio F, Coull BA, Schwartz J. Incorporating Local Land Use Regression And Satellite Aerosol Optical Depth In A Hybrid Model Of Spatiotemporal PM 2.5 Exposures In The Mid-Atlantic States. 2012 doi: 10.1021/es302673e. [DOI] [PMC free article] [PubMed] [Google Scholar]
- 44.Chudnovsky Aa, Lee HJ, Kostinski A, Kotlov T, Koutrakis P. Prediction of daily fine particulate matter concentrations using aerosol optical depth retrievals from the Geostationary Operational Environmental Satellite (GOES) [cited 2014 Nov 28];J Air Waste Manage Assoc [Internet] 2012 Sep;62(9):1022–31. doi: 10.1080/10962247.2012.695321. Available from: http://www.tandfonline.com/doi/abs/10.1080/10962247.2012.695321. [DOI] [PubMed] [Google Scholar]
- 45*.Sorek-Hamer Meytar, Kloog Itai, Koutrakis Petros, Strawa Anthony W, Chatfield Robert, Cohen Ayala, Ridgway William L, B DM. Assessment of PM 2.5 Concentrations over Bright Surfaces using MODIS Satellite Observations. RSOE. 2015 [Google Scholar]
- 46.Nordio F, Kloog I, Coull BA, Chudnovsky A, Grillo P, Bertazzi PA, et al. Estimating spatio-temporal resolved PM10 aerosol mass concentrations using MODIS satellite data and land use regression over Lombardy, Italy. Atmos Environ [Internet] 2013;74:227–36. Available from: http://www.sciencedirect.com/science/article/pii/S1352231013002197. [Google Scholar]
- 47.Chudnovsky AA, Koutrakis P, Kloog I, Melly S, Nordio F, Lyapustin A, et al. Fine particulate matter predictions using high resolution Aerosol Optical Depth (AOD) retrievals. Atmos Environ [Internet] 2014;89:189–98. Available from: http://www.sciencedirect.com/science/article/pii/S1352231014001150. [Google Scholar]
- 48*.Kloog I, Sorek-Hamer M, Lyapustin A, Coull B, Wang Y, Just AC, et al. Estimating daily PM2.5 and PM10 across the complex geo-climate region of Israel using MAIAC satellite-based AOD data. [cited 2015 Oct 24];Atmos Environ [Internet] 2015 Oct; doi: 10.1016/j.atmosenv.2015.10.004. Available from: http://www.sciencedirect.com/science/article/pii/S1352231015304234. [DOI] [PMC free article] [PubMed]
- 49*.Kloog I, Chudnovsky AA, Just AC, Nordio F, Koutrakis P, Coull BA, et al. Atmos Environ [Internet] 2. Vol. 95. Nature Publishing Group; 2014. Apr, [cited 2014 Nov 26]. A new hybrid spatio-temporal model for estimating daily multi-year PM2.5 concentrations across northeastern USA using high resolution aerosol optical depth data; pp. 581–90. Available from: http://linkinghub.elsevier.com/retrieve/pii/S1352231014005354. [DOI] [PMC free article] [PubMed] [Google Scholar]
- 50*.Just AC, Wright RO, Schwartz J, Coull BA, Baccarelli AA, Tellez-Rojo MM, et al. Environ Sci Technol [Internet] 14. Vol. 49. American Chemical Society; 2015. Jul 21, Using High-Resolution Satellite Aerosol Optical Depth To Estimate Daily PM 2.5 Geographical Distribution in Mexico City; pp. 8576–84. Available from: http://pubs.acs.org/doi/abs/10.1021/acs.est.5b00859. [DOI] [PMC free article] [PubMed] [Google Scholar]
- 51.Emili E, Lyapustin A, Wang Y, Popp C, Korkin S, Zebisch M, et al. High spatial resolution aerosol retrieval with MAIAC: Application to mountain regions. J Geophys Res [Internet] 2011;116(D23):D23211. Available from: http://www.agu.org.ezp-prod1.hul.harvard.edu/pubs/crossref/2011/2011JD016297.shtml. [Google Scholar]
- 52.Lee HJ, Liu Y, Coull Ba, Schwartz J, Koutrakis P. A novel calibration approach of MODIS AOD data to predict PM2.5 concentrations. [cited 2014 Dec 28];Atmos Chem Phys [Internet] 2011 Aug 5;11(15):7991–8002. Available from: http://www.atmos-chem-phys.net/11/7991/2011/ [Google Scholar]
- 53.Lee M, Kloog I, Chudnovsky A, Lyapustin A, Wang Y, Melly S, et al. J Expo Sci Environ Epidemiol [Internet] Nature Publishing Group; 2015. Apr, Spatiotemporal prediction of fine particulate matter using high-resolution satellite images in the Southeastern US 2003–2011; pp. 1–8. Available from: http://www.nature.com/doifinder/10.1038/jes.2015.41. [DOI] [PMC free article] [PubMed] [Google Scholar]
- 54.Hu X, Waller La, Al-Hamdan MZ, Crosson WL, Estes MG, Estes SM, et al. Environ Res [Internet] Vol. 121. Elsevier; 2013. Feb, [cited 2014 Dec 28]. Estimating ground-level PM(2.5) concentrations in the southeastern U.S using geographically weighted regression; pp. 1–10. Available from: http://www.ncbi.nlm.nih.gov/pubmed/23219612. [DOI] [PubMed] [Google Scholar]
- 55.Song W, Jia H, Huang J, Zhang Y. Remote Sens Environ [Internet] Vol. 154. Elsevier Inc.; 2014. Nov, [cited 2014 Dec 12]. A satellite-based geographically weighted regression model for regional PM2.5 estimation over the Pearl River Delta region in China; pp. 1–7. Available from: http://linkinghub.elsevier.com/retrieve/pii/S0034425714003058. [Google Scholar]
- 56.Sorek-Hamer M, Strawa AW, Chatfield RB, Esswein R, Cohen A, Broday DM. Improved retrieval of PM 2.5 from satellite data products using non-linear methods. Environ Pollut. 2013;182:417–23. doi: 10.1016/j.envpol.2013.08.002. [DOI] [PubMed] [Google Scholar]
- 57*.Alexeeff SE, Schwartz J, Kloog I, Chudnovsky A, Koutrakis P, Coull BA. Consequences of kriging and land use regression for PM2. 5 predictions in epidemiologic analyses: insights into spatial variability using high-resolution satellite data. J Expo Sci Environ Epidemiol [Internet] 2014 doi: 10.1038/jes.2014.40. Available from: http://www.nature.com/jes/journal/vaop/ncurrent/full/jes201440a.html. [DOI] [PMC free article] [PubMed]
- 58.Wang Z, Chen L, Tao J, Zhang Y, Su L. Satellite-based estimation of regional particulate matter (PM) in Beijing using vertical-and-RH correcting method. [cited 2014 Dec 28];Remote Sens Environ [Internet] 2010 Jan;114(1):50–63. Available from: http://linkinghub.elsevier.com/retrieve/pii/S003442570900251X. [Google Scholar]
- 59.Hu X, Waller LA, Lyapustin A, Wang Y, Al-Hamdan MZ, Crosson WL, et al. Estimating ground-level PM2.5 concentrations in the Southeastern United States using MAIAC AOD retrievals and a two-stage model. Remote Sens Environ [Internet] 2014;140:220–32. Available from: http://www.sciencedirect.com/science/article/pii/S0034425713002903. [Google Scholar]
- 60.Hu Z, Rao KR. Particulate air pollution and chronic ischemic heart disease in the eastern United States: a county level ecological study using satellite aerosol data. [cited 2014 Dec 24];Environ Health [Internet] 2009 Jan;8:26. doi: 10.1186/1476-069X-8-26. Available from: http://www.pubmedcentral.nih.gov/articlerender.fcgi?artid=2707366&tool=pmcentrez&rendertype=abstract. [DOI] [PMC free article] [PubMed] [Google Scholar]
- 61.Liu Y. Atmos Environ [Internet] Vol. 68. Elsevier Ltd; 2013. Apr, [cited 2014 Dec 28]. New Directions: Satellite driven PM2.5 exposure models to support targeted particle pollution health effects research; pp. 52–3. Available from: http://linkinghub.elsevier.com/retrieve/pii/S1352231012011119. [Google Scholar]
- 62.Chiu YHM, Coull BA, Sternthal MJ, Kloog I, Schwartz J, Cohen S, et al. Effects of prenatal community violence and ambient air pollution on childhood wheeze in an urban population. J Allergy Clin Immunol. 2013;133(3):713–22. doi: 10.1016/j.jaci.2013.09.023. [DOI] [PMC free article] [PubMed] [Google Scholar]
- 63*.van Rossem Lenie, Rifas-Shiman Sheryl L, Melly Steven J, Kloog Itai, Luttmann-Gibson Heike, Zanobetti Antonella, Coull Brent A, Schwartz Joel D, Mittleman Murray A, Oken Emily, Gillman Matthew W, Koutrakis Petros, G DR. Prenatal Air Pollution Exposure and Newborn Blood Pressure. Environ Health Perspect [Internet] 2015 doi: 10.1289/ehp.1307419. Available from: http://dx.doi.org/10.1289/ehp.1307419. [DOI] [PMC free article] [PubMed]
- 64**.Wang Z, Liu Y, Hu M, Pan X, Shi J, Chen F, et al. Acute health impacts of airborne particles estimated from satellite remote sensing. [cited 2014 Dec 28];Environ Int [Internet] 2013 Jan;51:150–9. doi: 10.1016/j.envint.2012.10.011. Available from: http://www.pubmedcentral.nih.gov/articlerender.fcgi?artid=3711510&tool=pmcentrez&rendertype=abstract This is the first study to estimate health outcomes directly from satellite data. [DOI] [PMC free article] [PubMed] [Google Scholar]
- 65**.Crouse DL, Peters PA, Hystad P, Brook JR, van Donkelaar A, Martin RV, et al. Ambient PM 2.5, O 3, and NO 2 Exposures and Associations with Mortality over 16 Years of Follow-Up in the Canadian Census Health and Environment Cohort (CanCHEC) Environ Health Perspect [Internet] 2015;123(11):1180–6. doi: 10.1289/ehp.1409276. Available from: http://ehp.niehs.nih.gov/14-09276 This study demonstrates the complimentry use of satellite data in health studies based on a large population. [DOI] [PMC free article] [PubMed] [Google Scholar]
- 66.White-newsome JL, Brines SJ, Brown DG, Dvonch JT, Gronlund CJ, Zhang K, et al. Validating Satellite-Derived Land Surface Temperature with in Situ Measurements: A Public Health Perspective. EHP. 2013;121(8):925–31. doi: 10.1289/ehp.1206176. [DOI] [PMC free article] [PubMed] [Google Scholar]
- 67.Ross Anderson HR, Butland BK, van Donkelaar A, Brauer M, Strachan DP, Clayton T, et al. Satellite-based estimates of ambient air pollution and global variations in childhood asthma prevalence. Environ Health Perspect. 2012;120(9):1333–9. doi: 10.1289/ehp.1104724. [DOI] [PMC free article] [PubMed] [Google Scholar]
- 68.Kloog I, Melly SJ, Ridgway WL, Coull BA, Schwartz J. Using new satellite based exposure methods to study the association between pregnancy pm2.5 exposure, premature birth and birth weight in Massachusetts. Environ Heal. 2012 Jun;11(1):40. doi: 10.1186/1476-069X-11-40. [DOI] [PMC free article] [PubMed] [Google Scholar]
- 69*.Ayaz H, Lee HJ, Ebisu K, Koutrakis P. PM2.5 exposure and birth outcomes: Use of satellite- and monitor-based data. 2014;25(1):58–67. doi: 10.1097/EDE.0000000000000027. [DOI] [PMC free article] [PubMed] [Google Scholar]
- 70.Lee HJ, Coull Ba, Bell ML, Koutrakis P. Environ Res [Internet] Vol. 118. Elsevier; 2012. Oct, [cited 2014 Dec 8]. Use of satellite-based aerosol optical depth and spatial clustering to predict ambient PM2.5 concentrations; pp. 8–15. Available from: http://www.pubmedcentral.nih.gov/articlerender.fcgi?artid=3454441&tool=pmcentrez&rendertype=abstract. [DOI] [PMC free article] [PubMed] [Google Scholar]
- 71*.Harris Maria H, Gold Diane R, Rifas-Shiman Sheryl L, Melly Steven J, Zanobetti Antonella, Coull Brent A, Schwartz Joel D, Gryparis Alexandros, Kloog Itai, Koutrakis Petros, Bellinger David C, White Roberta F, Sagiv Sharon K, O E. Prenatal and Childhood Traffic-Related Pollution Exposure and Childhood Cognition in the Project Viva Cohort (Massachusetts, USA) EHP. 2015 doi: 10.1289/ehp.1408803. [DOI] [PMC free article] [PubMed] [Google Scholar]
- 72*.Fleisch AF, Gold DR, Rifas-Shiman SL, Koutrakis P, Schwartz JD, Kloog I, et al. Air pollution exposure and abnormal glucose tolerance during pregnancy: The project viva cohort. Env Heal Perspect [Internet] 2014 doi: 10.1289/ehp.1307065. Available from: http://ww.ademloos.be/sites/default/files/gezondheid_docs/Fleisch_Air%2Bpollution%2Band%2Bglucose%2Bpregnancy_2014.pdf. [DOI] [PMC free article] [PubMed]