Abstract
Objectives
Post-lingually deaf cochlear implant users’ speech perception improves over several months after implantation due to a learning process which involves integration of the new acoustic information presented by the device. Basic tests of hearing acuity might evaluate sensitivity to the new acoustic information and be less sensitive to learning effects. It was hypothesized that, unlike speech perception, basic spectral and temporal discrimination abilities will not change over the first year of implant use. If there were limited change over time and the test scores were correlated with clinical outcome, the tests might be useful for acute diagnostic assessments of hearing ability and also useful for testing speakers of any language, many of which do not have validated speech tests.
Design
Ten newly implanted cochlear implant users were tested for speech understanding in quiet and in noise at 1 and 12 months post activation. Spectral-ripple discrimination, temporal-modulation detection, and Schroeder-phase discrimination abilities were evaluated at 1, 3, 6, 9 and 12 months post activation.
Results
Speech understanding in quiet improved between 1 and 12 months post activation (mean 8% improvement). Speech in noise performance showed no statistically significant improvement. Mean spectral-ripple discrimination thresholds and temporal-modulation detection thresholds for modulation frequencies of 100 Hz and above also showed no significant improvement. Spectral-ripple discrimination thresholds were significantly correlated with speech understanding. Low frequency modulation detection and Schroeder-phase discrimination abilities improved over the period. Individual learning trends varied, but the majority of listeners followed the same stable pattern as group data.
Conclusions
Spectral-ripple discrimination ability and temporal-modulation detection at 100-Hz modulation and above might serve as a useful diagnostic tool for early acute assessment of cochlear implant outcome for listeners speaking any native language.
Introduction
The ability to discriminate physical spectral-temporal properties of sound is a fundamental aspect of how well people hear. Efficient psychophysical tests can measure these acuities and thus could provide a basic assessment of how well people are hearing for clinical purposes. Performance on these tests is influenced by pathology of the ear. If an intervention is introduced, such as a cochlear implant (CI), which introduces new signals to the auditory nerve, it is known that CI users take some time to learn how to integrate the new acoustic information that comprises speech (Oh et al. 2003; Ruffin et al. 2007; Tyler et al. 1997). Evaluation of basic psychophysical capabilities, however, might yield a measure of hearing that does not change over time, because it measures hearing ability rather than the effects of plastic mechanisms that contribute to speech perception improvements over time. These mechanisms might include adaptation to frequency mismatching during the first year of cochlear implant use (Svirsky et al. 2015) or learning new speech cues (e.g., Moberly et al. 2015). Three psychophysical tests were chosen to evaluate hearing acuity: spectral-ripple discrimination, temporal-modulation detection and Schroeder-phase discrimination. It is hypothesized that these psychophysical capabilities will remain nearly constant over the first year of implantation, but speech understanding ability will improve over that time. The plasticity that contributes to improved speech performance is not expected to influence performance on these broad-band tasks.
The spectral-ripple discrimination test was designed to measure spectral acuity. This ability correlates with speech understanding ability in CI users in quiet and in noise (Henry et al. 2003; Won et al. 2007) and across a range of hearing impairments (Henry et al. 2005). The test has been shown by multiple studies to be closely related to channel interaction and is clearly spectral in nature (Jones et al. 2013a; Scheperle et al. 2015; Won et al. 2014a; Won et al. 2011b). Related tests of spectral-ripple detection have also shown strong correlations with speech performance (Gifford et al. 2014; Litvak et al. 2007; Saoji et al. 2009; Spahr et al. 2011). Spectral-ripple discrimination is a reliable test (Drennan et al. 2014; Won et al. 2007) that is sensitive to acute processing changes in CI users (Drennan et al. 2010). When used to diagnose CI candidacy, the test has good specificity and sensitivity to aided speech testing in candidacy evaluation (Shim et al. 2014). Spectral-ripple discrimination ability has also shown significant correlations with music perception abilities (Won et al. 2010), another clinically important ability. After speech, music stimuli are the self-reported second most important stimuli for CI users (Gfeller et al. 2002).
Temporal modulation detection has been shown to correlate with speech perception in CI users both with direct electrode stimulation (Fu 2002) and using CI processing, independently of spectral-ripple discrimination ability with the acoustic temporal modulation detection task (Bacon et al. 1985; Won et al. 2011a). Temporal modulation detection ability also correlates significantly with music perception performance (Won et al. 2010).
Acoustic Schroeder-phase stimuli have limited temporal modulations and repeating frequency modulations (FM) (Schroeder 1970). The CI does not process this FM information as such, but rather, via filtering. The frequency changing across filters converts the information to amplitude modulations (Won et al. 2012; Won et al. 2014b). Therefore, in CI users, the Schroeder-phase test evaluates the ability of CI users to hear rapid changes in the spatial distribution of electrical stimulation (Drennan. et al. 2008), creating variations in amplitude modulation across electrodes. Like temporal modulation sensitivity (Won et al. 2011a), this ability has also been shown to correlate with speech performance independently of spectral-ripple discrimination ability (Drennan. et al. 2008). Schroeder-phase discrimination ability also responded to acute changes in CI signal processing (Drennan et al. 2010).
The authors’ broader aim is to develop tests of hearing acuity for the evaluation of treatments for hearing loss. Efficient and validated behavioral tests addressing sensitivity to clinically relevant acoustic attributes could serve as valuable clinical research tools, and, if made sufficiently efficient, as clinical tools (Drennan et al. 2014; Gifford et al. 2014; Shim et al. 2014). These non-linguistic psychophysical tests could assess CI hearing ability acutely with limited acclimatization and less dependence on learning than speech tests. This could reduce the necessity for longitudinal assessments of hearing ability in evaluating CI processing strategies and mapping approaches. These behavioral tests, designed to evaluate sensitivities to basic physical attributes of sound, could be beneficial in clinical evaluations due to their lack of dependence on language familiarity and might, therefore, also be beneficial for global health, evaluating outcomes across languages.
Methods
Subjects
Fourteen listeners enrolled and 10 listeners completed the study. There were 6 users of Cochlear Ltd. devices and 4 users of Advanced Bionics devices. They were implanted between 2009 and 2012. Their ages ranged from 41 to 77 with a mean of 59.3 years. Additional details are provided in Table 1. The work was approved by the University of Washington Institutional Review Board.
Table 1.
Shows demographic data for all listeners who completed the study. The years of severe impairment is defined as the number of years prior to implantation since they were able to talk on the phone.
| Listener Number | Device Manufacturer | Age | Years severely impaired | Gender |
|---|---|---|---|---|
| 77 | Cochlear | 59 | 7 | M |
| 80 | AB | 58 | 2 | M |
| 82 | AB | 73 | 3 | F |
| 84 | AB | 46 | 0 | M |
| 86 | Cochlear | 70 | 20 | M |
| 89 | Cochlear | 62 | 2 | F |
| 97 | Cochlear | 57 | 6 | F |
| 111 | Cochlear | 41 | 29 | F |
| 112 | Cochlear | 77 | NA | M |
| 114 | AB | 50 | 46 | M |
Speech Testing
Speech perception testing was done at 1 and 12 months post activation. This time frame was chosen because it is known that speech scores improve over the first year after activation (Ruffin et al. 2007; Tye-Murray et al. 1992; Tyler et al. 1997). Non-linguistic hearing tests were completed at 1, 3, 6, 9, and 12 months post activation in 10 post-lingually deafened adults. The order of all tests was randomized for each listener and each visit.
Tests were performed in a double-walled Acoustic Systems sound booth, 6 × 9 feet interior dimensions. Listeners were seated 1 meter from the speaker and used their clinical sound processing strategy. Sounds were presented at 65 dBA root mean square (rms) level unless otherwise noted. Custom MATLAB (The Mathworks, Inc.) programs were used for testing which was completed with a Macintosh G5 computer and a Crown D45 amplifier routed into a B&W DM303 studio monitor with a frequency and phase response that exceed ANSI standards for speech audiometry. For all tests except the consonant-nucleus-consonant (CNC) word test (Peterson et al. 1962), listeners responded with a computer mouse.
CNC words
Two 50-word CNC lists were selected from 10 lists (Peterson and Lehiste 1962) for testing at 1 and 12 months post activation. Words were presented at 62 dBA (rms) through the same amplifier and speaker. Listeners repeated the word that they heard through an in-booth monitor. The words were recorded on paper and scored by the experimenter.
Speech reception thresholds (SRT) in steady noise
Previous longitudinal studies (Dorman et al. 1990; Oh et al. 2003; Ruffin et al. 2007; Tyler et al. 1997) did not evaluate speech-in noise performance over time; therefore, speech-in-noise performance was evaluated. The SRT test used a 12-AFC, one-up & one-down adaptive procedure (Turner et al. 2004; Won et al. 2007) converging on 50% correct (Levitt 1971). Twelve equally difficult spondees spoken by a female were used for target speech (Harris 1991). A spondee is a two-syllable word that has equal emphasis on both syllables such as “northwest”, “padlock”, or “mousetrap”. Speech-shaped, steady-state noise was used. The noise level was varied with a step size of 2 dB. The speech level was fixed. In each trial, the noise lasted 2.0 s, and the word began 500 ms after the noise. The starting signal-to-noise ratio (SNR) was +10 dB. Threshold was calculated as the average SNR visited for the last 10 of 14 reversals. Tracking histories were repeated 6 times in two sets of 3 tracks.
Spectral-ripple discrimination
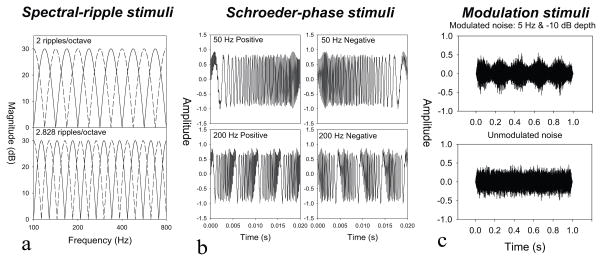
Based on methodology in previous publications (Henry et al. 2005; Won et al. 2007), two-hundred pure-tone frequency components were summed, with a spectral-ripple shape as shown in Figure 1a. The starting phase of the individual tones was randomized. A full-wave rectified sinusoidal envelope was used to determine the spectral shape on logarithmic frequency and amplitude scales. A speech-shaped filter (Byrne et al. 1994) was applied. A 2-down 1-up adaptive procedure (Levitt 1971) was used with a 3-alternative forced choice (3AFC) task to measure the smallest spectral density CI users can discriminate between standard and inverted ripple stimuli. Within each trial, one ripple was inverted in the frequency domain such that the peaks were at the locations of the troughs and vice versa. Listeners identified one stimulus of three that was different. No feedback was provided. Spectral-ripple stimuli had a bandwidth of 100–5,000Hz with a peak-to-valley ratio of 30 dB. Six repetitions were tested in 2 groups of 3. Starting with 0.176 ripples per octave, ripple densities tracked up and down using a ratio of 1.414. The presentation level was roved within trials over a 9-dB range, +/− 4 dB in 1-dB steps. The threshold was taken as the mean ripple density visited of the last 8 of 13 reversals. Performance is related to behavioral and objective channel interactions (Jones et al. 2013b; Scheperle and Abbas 2015; Won et al. 2014a), correlated with behavioral tuning curve measures (Anderson et al. 2011), and not dependent upon level differences at the edge of the stimuli nor on the spectral centroid of the stimuli (Jones et al. 2013b; Won et al. 2011b).
Figure 1.
Figure 1a) Spectral ripple stimuli for 2.0 and 2.282 ripples per octave. The solid lines show the standard stimulus and the dotted line shows the inverted, comparison stimulus. 1b) Positive and negative Schroeder-phase stimuli at 50- and 200-Hz. 1c) Temporally modulated and unmodulated stimuli with a 5-Hz modulation rate with a −10 dB modulation depth.
Temporal amplitude modulation detection
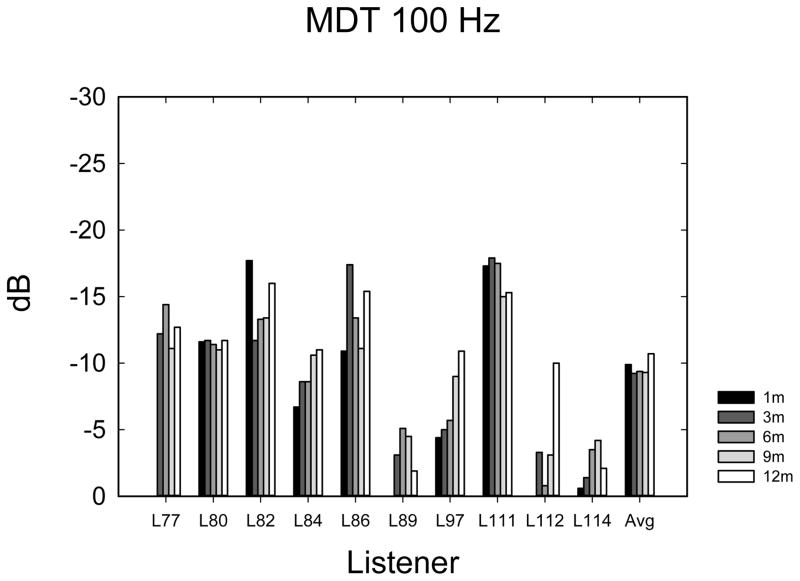
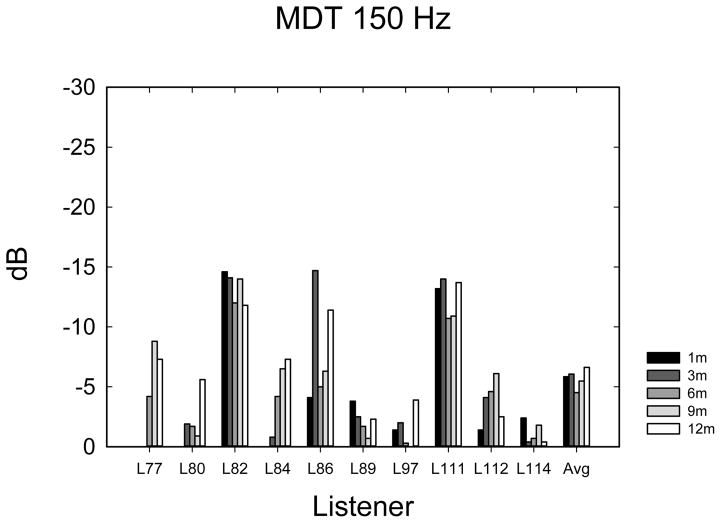
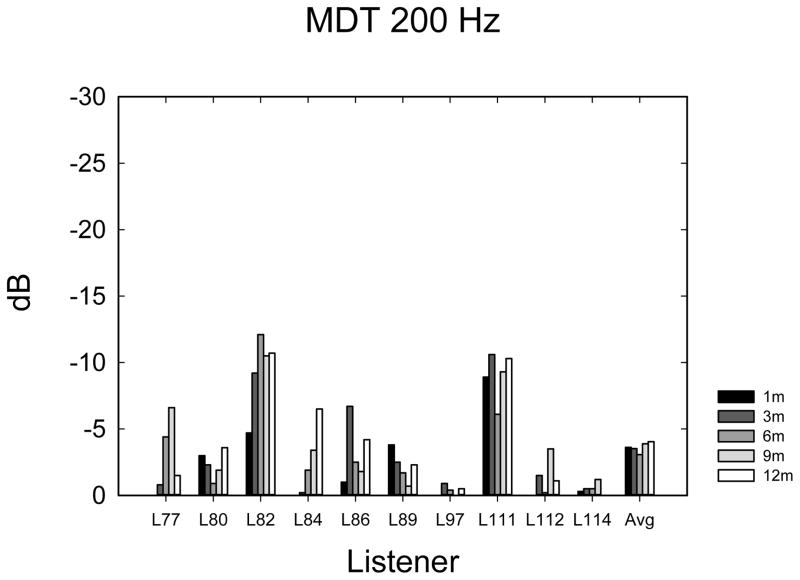
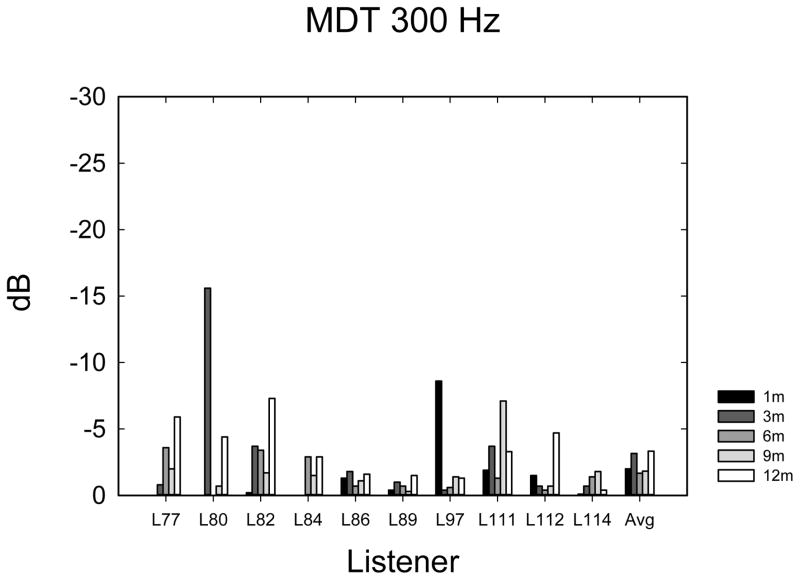
The method was adopted from Bacon and Viemeister (1985) and Won et al. (2011a). A 2-AFC task was used with two 1-s intervals. One interval contained steady noise and the other was temporally modulated. Sample stimuli are shown in Figure 1c. For the modulated stimuli, sinusoidal amplitude modulation was applied to a wideband noise carrier using the following equation: , where f(t) is a wideband noise carrier, mi is the modulation index, i.e., the modulation depth, and fm is the frequency of modulation. To compensate for the acoustic intensity increment in the modulated stimuli, the intensity of the modulated waveform was divided by a factor of 1 + (mi2/2) (Bacon and Viemeister 1985; Viemeister 1979). A 10-ms linear ramp was added to the beginning and end of both the modulated and unmodulated segments. The two stimuli were concatenated with no gap between. The listeners were instructed to identify the modulated interval. A 2-down, 1-up procedure approaching 70.7% correct (Levitt 1971) was used in which the modulation depth was tracked. The starting modulation depth was 100%. The step size was initially 4 dB and decreased to 2 dB after 4 reversals. The threshold was calculated as the mean modulation depth (MDT) visited for the last 10 of 14 reversals. MDTs are reported in dB relative to 100% modulation [20 log10(mi)]. Three tracking histories were run for 10-, 50-, 100-, 150-, 200-, and 300-Hz modulation frequencies, although some listeners did not complete all tracking histories due to personal time constraints. The order of the modulation frequencies tested was randomized.
Schroeder-phase discrimination
Listeners discriminated positive and negative Schroeder-phase pairs with fundamental frequencies (F0s) of 50 and 200 Hz using the methods described in Drennan et al. (2008) and adapted from Dooling et al. (2002). See Figure 1b. The approach used a 4-interval, 2-AFC task with feedback provided to the listeners. Three negative-phase stimuli were presented with one positive-phase stimulus. The 2nd or 3rd interval was randomly a positive-phase Schroeder stimulus. The method of constant stimuli was used yielding a percent correct score for each frequency. Six repetitions were run in which the order of Schroeder frequencies was randomized. For each fundamental frequency, equal-amplitude cosine harmonics from the fundamental frequency up to 5 kHz were summed. Each harmonic was given a phase according to the following equation:
in which θn is the phase of the nth harmonic, n is the nth harmonic, N is the total number of harmonics in the complex and the positive or negative sign is used when creating positive and negative Schroeder-phase signals, respectively. During each presentation of stimuli, the starting phase of the harmonic complex was random. A longer stimulus was multiplied by a 500-ms time window with 10-ms linear onset and offset ramps whose position in time was random relative to the starting phase of the Schroeder-phase stimulus. This was done so that the part of the stimuli that occurred during beginning and end of the presentation could not be used as a reliable cue for discrimination. After 8 training trials, 6 blocks of 48 trials were completed with 24 presentations of each fundamental frequency. Data were reported as percent correct. Feedback was provided.
Results
Speech
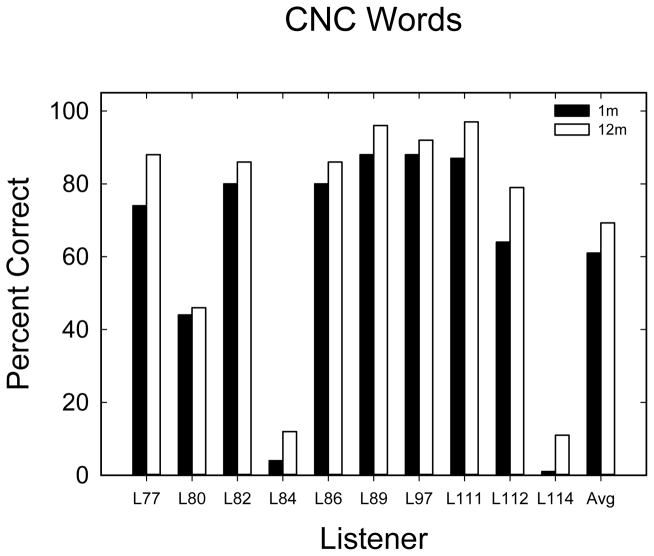
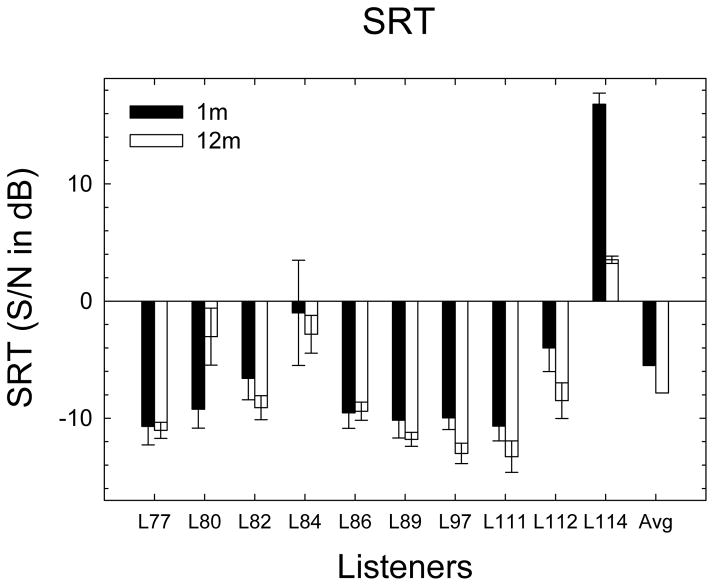
CNC word discrimination test scores at 1- and 12-months post activation are shown in Figure 2. For all listeners, CNC word scores improved over the time period. The mean difference between 1 and 12 months was 8.3%. A paired t-test showed a statistically significant difference (t9 = −6.385, p < 0.0002). SRT data are shown in Figure 3. The mean performance in SRT at 1-month was −5.5 dB SNR with a standard error of 2.7 and at 12-months, it was −7.8 dB SNR with a standard error of 1.7. A 2×6 repeated-measures ANOVA was completed with data from 2 time points and 6 repetitions during each testing session. The main effect of time was not significant at the 5% level (F1,9 = 2.36, p = 0.159). There was a significant effect of repetition (F5,45 = 2.708, p = 0.032), reflecting performance improving over the first two repetitions at the 1-month testing time. After improvement over the first two repetitions, 1-month performance averaged about −7.0 dB compared to −7.8 dB in the 12-month condition, indicating little change in speech-in-noise performance over the time period. The interaction between time period and repetition was not statistically significant (F5,45 = 1.529, p = 0.200).
Figure 2.
CNC word scores at 1- and 12-months post activation. Solid bars show 1-month scores and open bars show 12-month scores.
Figure 3.
SRT scores at 1- and 12-months post activations. Solid bars show 1-month scores and open bars show 12-month scores. Error bars show the 95% confidence interval based on 6 repetitions. Lower scores reflect better hearing ability.
Spectral ripple
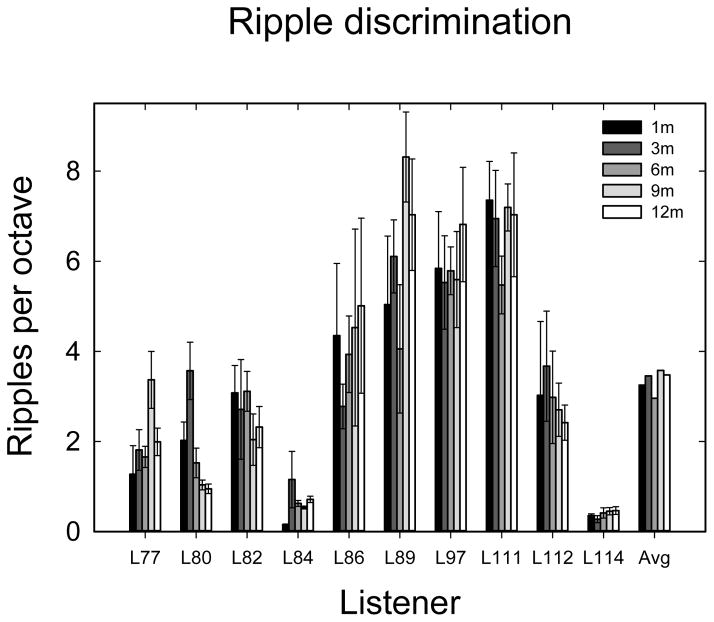
The spectral-ripple data are shown in Figure 4. Error bars show the 95% confidence intervals. The spectral-ripple discrimination data were analyzed with a 5×6 repeated-measures ANOVA with 5 levels of time and 6 repetitions (tracking history measures) done at each time interval. The results showed no significant effect of time over the 12 months (F4,36 = 0.898, p = 0.475), no significant effect of repetition (F5,36 = 1.193, p = 0.328) and no significant interaction (F20,180 = 1.190; p = 0.228). While there was some variation in performance over time and repetitions between and within listeners, there was no observable trend; mean performance was unchanged over the period.
Figure 4.
Ripple scores in ripples per octave (rpo) for 1-, 3-, 6-, 9-, and 12-months post activation. Error bars represent the 95% confidence interval based on 6 repetitions at each time.
Temporal Amplitude Modulation Detection
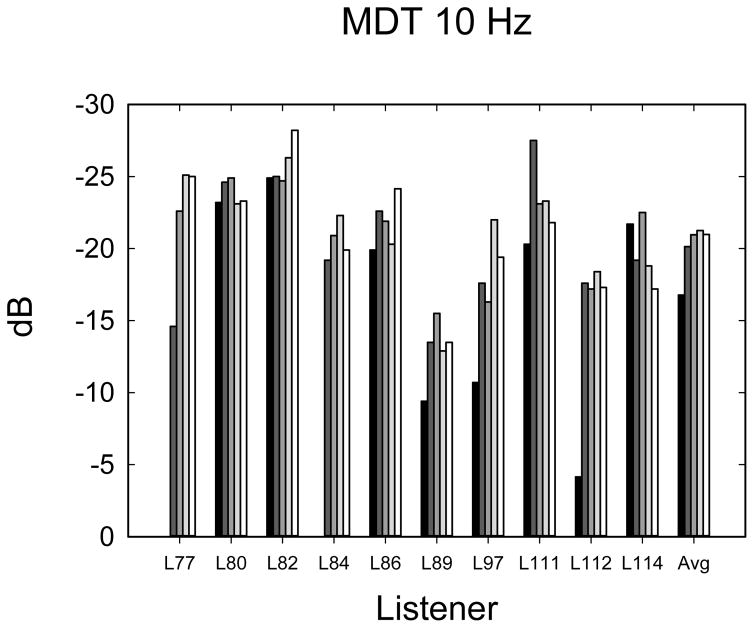
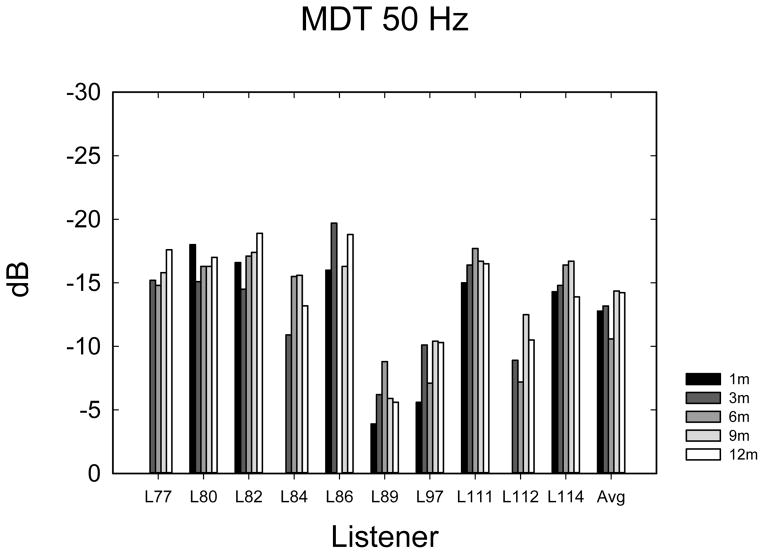
The temporal modulation detection data are shown in Figure 5A–E. Data were analyzed using 1-way ANOVAs with 5 time levels for each frequency-of-modulation condition. Not all listeners completed the same number of repetitions of each condition due to time constraints, so it was not possible to perform multi-dimensional ANOVAs using repetitions or modulation frequency as main effects. In most cases (60%), listeners completed 3 tracking histories, but the number of runs varied from 0 to 4, depending upon how much time was available to complete the tests. Eight listeners completed at least 1 adaptive run in all conditions. Given the variable number of repetitions observed at each time point, the average modulation threshold was used for each subject at each point in time. Table 2 shows F- and p-values from repeated measures ANOVAs as well as the mean threshold and mean 95% confidence intervals. Confidence intervals were calculated using the standard deviation of the cohort calculated at each time interval, and then confidence intervals were averaged across the 5 time intervals. The mean thresholds, which increase (get worse) with increasing frequency, are closely consistent with thresholds observed by Won et al. (2011a). The 10-Hz modulation condition showed an effect of the time of testing. Two paired t-tests were used to compare 1-month with 3-month data and 3-month with 12-month data, because it appeared nearly all of the improvement over time occurred between 1 and 3 months. A significant difference was observed between 1 and 3 months (t7 = 2.37; p < 0.05) but not between 3 and 12 months (t9 = 0.635; p = 0.54). None of the other frequency conditions showed a longitudinal main effect of the time of testing.
Figure 5.
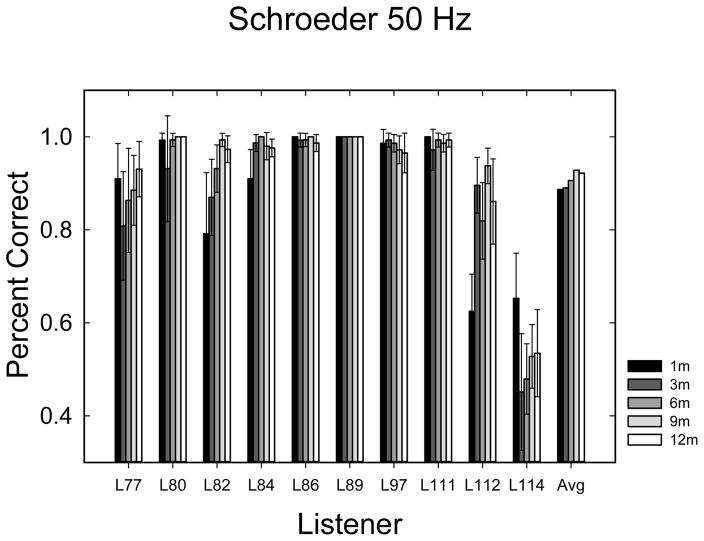
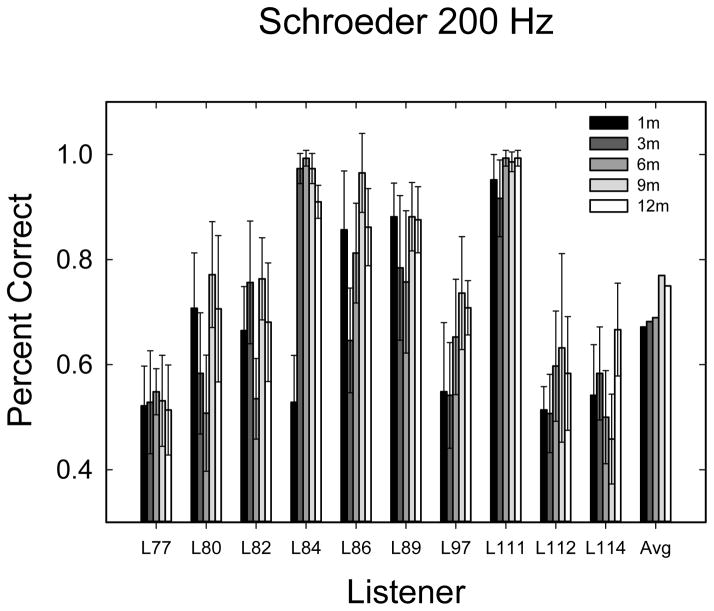
Schroeder phase scores in percent correct for 50-Hz (A) and 200-Hz (B) Schroeder phase discrimination. Error bars represent the 95% confidence interval for 6 repetitions of 24 trials. The 6 repetitions of each frequency were repeated at each time interval after activation.
Table 2.
Columns on the left show p- and F-values from a 1-way ANOVA analysis based on the mean modulation detection threshold at each point in time. P values indicate the probability that the threshold remained the same over time. Values less than 0.05 are considered statistically significant. The columns on the right show the mean thresholds averaged over all times, and the mean 95% confidence intervals at each frequency, averaged across points in time.
| Frequency of modulation | P value | F4 value | Mean Threshold | Mean 95% confidence |
|---|---|---|---|---|
| 10 Hz | 0.02 | 3.40 | −20.02 | 2.91 |
| 50 Hz | 0.56 | 0.76 | −13.02 | 3.36 |
| 100 Hz | 0.55 | 0.78 | −9.70 | 3.29 |
| 150 Hz | 0.29 | 1.33 | −5.70 | 3.12 |
| 200 Hz | 0.42 | 1.03 | −3.63 | 2.23 |
| 300 Hz | 0.67 | 0.59 | −2.40 | 1.65 |
Schroeder phase
Schroeder phase discrimination data are shown in Figures 6A & B. Data were analyzed with a 3-way (2×5×6) repeated measures ANOVA with 2 Schroeder-phase frequencies (50 and 200 Hz), 5 points in time, and 6 repetitions at each time. There was an expected significant effect of frequency (F1,9 = 25.603; p = 0.001). Mean performance was 90.7% for 50 Hz and 70.8% for 200 Hz. The difference was 19.9% between the two frequencies, similar to the results of Drennan et al. (2008). There was also a statistically significant main effect of the time of testing (F4,36 = 3.471; p = 0.017), and a weak, but statistically significant main effect of the repetition (F5,45 = 2.473; p = 0.049). None of the interactions were statistically significant.
Figure 6.
Temporal modulation detection scores in dB relative to 100% modulation for noise modulated at 10 Hz (A), 50 Hz (B), 100 Hz (C), 150 Hz (D), 200 Hz (E), and 300 Hz (F) modulation rates.
Given ceiling effects in the 50-Hz condition, the two conditions were analyzed separately, each with a 5×6 repeated-measures ANOVA (5 time periods, each with 6 repetitions). The result indicated the 50-Hz condition had an effect of repetition (F5,45 = 2.77; p < 0.029) and the 200-Hz condition had a borderline significant effect of time (F4,36 = 2.67; p < 0.048). No other effects or interactions were significant when the two frequencies were analyzed separately.
Relationships between early and late performance
The question of whether early psychophysical results could predict later clinical performance was of interest. CNC scores at 12-months post activation were chosen as the primary clinical variable and were correlated with 1-month scores for CNC words, ripple discrimination, 50-Hz Schroeder phase discrimination, and 150-Hz MDT using both Pearson correlations and Spearman non-parametric correlations. The specific conditions of 50-Hz Schroeder-phase discrimination and 150-Hz MDTs were chosen because these conditions had the highest correlations vs. CNC words in previous studies (Drennan et al. 2008; Won et al. 2011a), although previous studies did not analyze performance longitudinally over time. Thus, only 4 correlations were assessed. Using parametric Pearson correlations, ripple scores and 1-month CNC scores were significantly correlated with CNC scores at 12-months at r = 0.81 (p < 0.004) and r = 0.99 (p< 0.0001), respectively. Neither Schroeder-phase discrimination (r = 0.37; p = 0.29) nor MDT 150-Hz (r = −0.37; p = 0.29) correlated significantly with CNC word scores. Applying Bonferroni-Holm (Holm 1979) corrections for multiple comparisons did not change the statistical significance of the correlations. More data would be required to determine if these weaker trends were meaningful or statistically significant. The non-parametric correlations were CNC at 1 m vs. CNC at 12 m (ρ = 0.92; p < 0.0005), ripple discrimination vs. CNC at 12 m (ρ = 0.85, p = 0.002); 50-Hz Schroeder vs. CNC at 12 m (ρ = 0.65; p = 0.04) and 150-Hz MDT vs. CNC at 12m (ρ = −0.335; p = 0.343). Applying Bonferroni-Holm (Holm 1979) corrections for multiple comparisons, the 50-Hz Schroeder vs. CNC correlation did not meet the required standard of p = 0.025.
Reliability measures
Data were reanalyzed for reliability using methods described by Bland and Altman (1996a, 1996b) and employed by Summerfield et al. (1994) and Lovett et al. (2013). These analyses were applied to evaluate the reliability of the longitudinal data. Test-retest intraclass correlation coefficients and the “repeatability” were calculated for all repeated measures. The intraclass correlation coefficients (ICCs) were calculated using SPSS v.19 with a two-way mixed model of the type for absolute agreement. Deviation from absolute agreement yields smaller ICCs. ICCs for absolute agreement are preferred to Pearson correlation analysis, because ICCs for absolute agreement will be reduced if there are absolute trends in the data, e.g. learning.
To calculate repeatability, σω is determined equal to
where di is test-retest difference in scores for the ith listener and n is the number of listeners. “Repeatability” is equal to . This defines the confidence interval between two measures in an individual subject. Using a repeated-measures design with multiple conditions, if the difference in an individual’s scores is greater than this value, there is less than 5% probability the conditions yield the same performance. There were ten possible paired combinations of repeatability data available for each condition in this study.
ICC data are shown in Table 3 for all of the non-speech conditions. All five measures are combined to calculate each ICC. ICCs over 0.8 indicate good reliability, and ICCs greater than 0.7 are considered acceptable.
Table 3.
Intraclass correlation coefficients (ICC) are based on 5 measures at 1-, 3-, 6-, 9-, and 12-months post activation. ICC values are for single measures. The * indicates the ICC was not significantly different from 0.
| Adaptive Ripple | Modulation detection | Schroeder phase | ||||||
|---|---|---|---|---|---|---|---|---|
| 10 Hz | 50 Hz | 100 Hz | 150 Hz | 200 Hz | 300 Hz | 50 Hz | 200 Hz | |
| 0.89 | 0.67 | 0.89 | 0.85 | 0.85 | 0.82 | 0.08* | 0.86 | 0.70 |
Repeatability data are shown in Tables 4–6. The tables show the time of the first score used in the paired comparison from 1- to 9-months post-activation vs. the duration of time between pairs of tests: 2–3, 5–6, 8–9, or 11 months. Note that these repeatability values are for long-term repeatability with 2 months or more between testing times, differing from short-term reliability measures over the period of a week or less reported in previous studies (Drennan et al. 2014; Drennan et al. 2008; Won et al. 2007). Short-term repeatability measures are summarized in the discussion section. For the adaptive spectral-ripple test (Table 4), long-term repeatability values ranged from 0.5 rpo to 2 rpo with a mean of 1.5 rpo. For the temporal-modulation detection tests (Table 5A), the repeatability data were averaged over all of the modulation frequencies. Table 5B shows the average repeatability for each modulation frequency averaged across all pairs of data. The grand mean repeatability for long-term MDT testing (with 2 months or greater separation between tests) was 5.9 dB. Schroeder-phase repeatability data are shown in Table 6A and B for 50 and 200 Hz, respectively. Improvement over time, particularly in the early stage of testing, likely contributed to the larger repeatability values.
Table 4.
Repeatability measures in ripples per octave for spectral ripple discrimination using all paired comparisons. Starting times show the time after activation of the initial test in the pair.
| Starting Time | Duration between tests | |||
|---|---|---|---|---|
| 2–3 months | 5–6 months | 8–9 months | 11 months | |
| 1 month | 1.9 | 1.9 | 2.0 | 1.7 |
| 3 months | 1.2 | 1.7 | 2.2 | |
| 6 months | 1.1 | 0.9 | ||
| 9 months | 0.5 | |||
Table 6A.
Repeatability measures in percent correct for 50-Hz Schroeder-phase discrimination. Starting times show the number of months after activation of the initial test in the pair.
| Time of first test | Duration between tests | |||
|---|---|---|---|---|
| 2–3 months | 5–6 months | 8–9 months | 11 months | |
| 1 month | 23 | 19 | 25 | 20 |
| 3 months | 8 | 11 | 12 | |
| 6 months | 9 | 7 | ||
| 9 months | 5 | |||
Table 5A.
Repeatability measures in dB for temporal modulation detection using all paired comparisons and repeatability measures averaged over all 6 modulation frequencies. Starting times show the number of months after activation of the initial test in the pair.
| Starting Time | Duration between tests | |||
|---|---|---|---|---|
| 2–3 months | 5–6 months | 8–9 months | 11 months | |
| 1 month | 7.6 | 6.4 | 6.9 | 6.2 |
| 3 months | 4.8 | 6.9 | 6.0 | |
| 6 months | 4.0 | 5.6 | ||
| 9 months | 4.9 | |||
Table 5B.
Average repeatability in dB for temporal modulation detection using all paired comparisons for each modulation frequency.
| Average Repeatability | Modulation frequency | |||||
| 10 Hz | 50 Hz | 100 Hz | 150 Hz | 200 Hz | 300 Hz | |
| 7.2 | 4.7 | 5.9 | 6.1 | 5.2 | 6.9 | |
Table 6B.
Repeatability measures in percent correct for 200-Hz Schroeder-phase discrimination. Starting times show the number of months after activation of the initial test in the pair.
| Time of first test | Duration between tests | |||
|---|---|---|---|---|
| 2–3 months | 5–6 months | 8–9 months | 11 months | |
| 1 month | 32 | 35 | 33 | 27 |
| 3 months | 21 | 29 | 22 | |
| 6 months | 27 | 21 | ||
| 9 months | 17 | |||
Individual trends
As noted above, group learning effects were observed with 10-Hz MDTs and with Schroeder-phase discrimination. Spectral-ripple discrimination and the higher frequency MDT tests did not show statistically significant group-wide learning effects using the ANOVA analyses; however, an item of interest was whether or not individual listeners improved over the 11-month period.
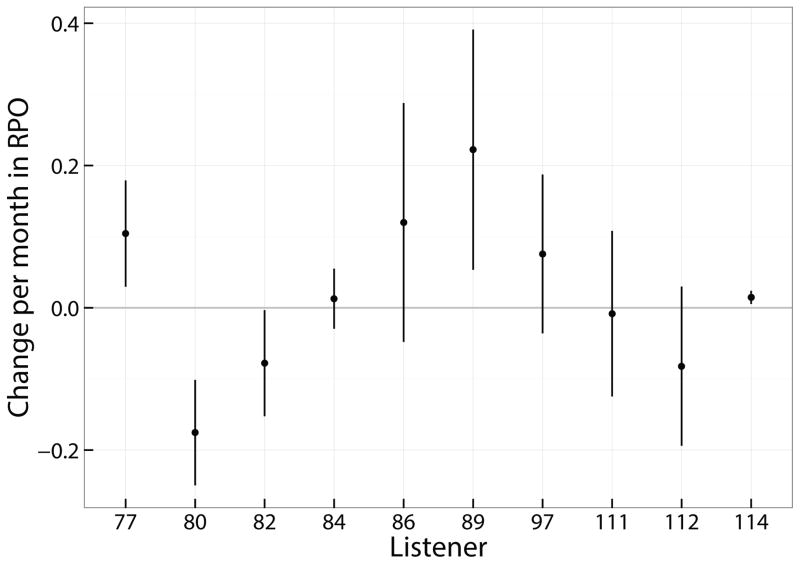
Given 6 repetitions of spectral-ripple discrimination completed for each listener at each of 5 points in time, it was possible to evaluate reliable individual regression analyses. The slopes and 95% confidence interval for the slopes of the regression lines are shown in Figure 7. In this figure, the slope of the line is shown for each listener in ripples per octave per month. Positive slopes indicate improving performance over time. The vertical lines indicate the 95% confidence interval for the slope. If these lines cross 0, the slopes are not statistically significant from 0. The mean slope was 0.02 rpo/month with a standard deviation of 0.12. Two listeners had significantly negative slopes and three had significantly positive slopes, although one of those 3 had near 0 slope and extremely poor spectral discrimination ability over the course of the study, thus only two had meaningfully positive slopes.
Figure 7.
Shows the mean and 95% confidence intervals of the slope of performance over time for all spectral ripple discrimination data using the adaptive test. Slope data are based on the output of a linear mixed model to the longitudinal data in which the individual listeners’ performance were a random effect.
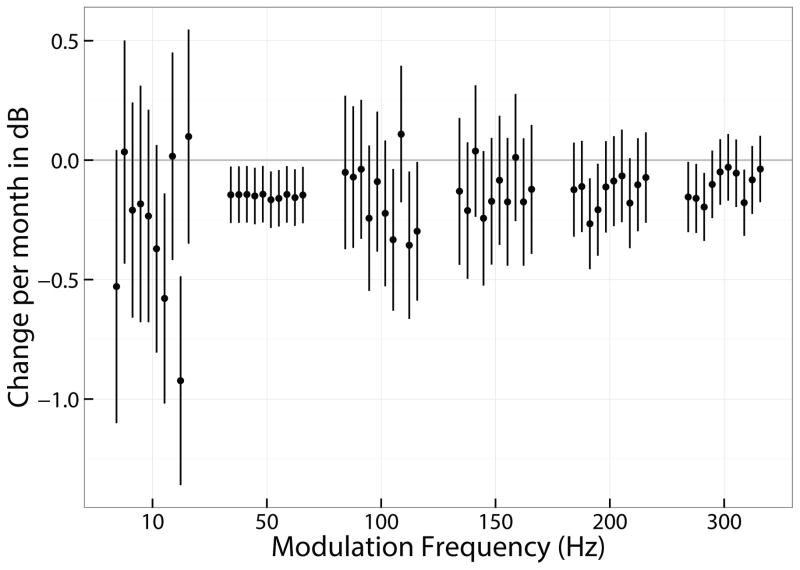
A linear mixed model was used for analysis, because there were fewer repeated measures and some missing data in the temporal-modulation detection task resulting from limitation in testing time available. In this model, the time of testing was the fixed effect and individual listeners were random effects. The model is represented by the equation: Yi = αx + β + αix + βi + εi in which α and β are the fixed-effect slope and intercept of the best-fit line, αi and βi are the random slope and intercept correction for the ith listener, and εi is an error term. The mixed model allows for the assessment of independent slopes for each listener with their associated confidence intervals. The estimated slopes in dB per month (α + αi) for each listener and for each frequency of modulation are shown in Figure 8. Negative slopes indicate improving performance. The vertical lines represent the 95% confidence interval. For all frequencies of modulation, the listeners are sorted sequentially left to right for L77 thru L114. About 2/3 of the individual confidence intervals are not significantly different from 0. The mean and standard deviation of the slopes are shown in Table 7. Given a 95% confidence interval of 1.96 times the standard deviation, all of the mean confidence intervals include 0 except the 50-Hz condition, which shows a consistent and small negative slope. Unlike the ANOVA analysis, the 10-Hz modulation is not showing a significant slope due to a large variation across listeners.
Figure 8.
Shows the mean and 95% confidence intervals of the slopes of temporal modulation performance over time for all 10 listeners for all frequencies of modulation. Data are based on the output of a linear mixed models to the longitudinal data for each condition in which the individual listeners’ performances were a random effect.
Table 7.
The mean and standard deviation of slopes for individual listeners using the mixed effects model with listeners as a random factor.
| Modulation frequency | ||||||
|---|---|---|---|---|---|---|
| 10 Hz | 50 Hz | 100 Hz | 150 Hz | 200 Hz | 300 Hz | |
| Mean | −0.29 | −0.15 | −0.16 | −0.13 | −0.13 | −0.10 |
| SDev | 0.32 | 0.01 | 0.15 | 0.09 | 0.07 | 0.06 |
Discussion
Improvements over time
Speech understanding in quiet is known to improve over the first 12 months of CI use (Dorman et al. 1990; Oh et al. 2003; Ruffin et al. 2007; Tyler et al. 1997), and that was confirmed with this cohort. It was hypothesized that tests of basic hearing ability would not improve over the time period. For group mean data, the hypothesis was supported for spectral-ripple discrimination and for temporal-modulation detection ability for modulation frequencies of 100 Hz and above. The hypothesis was not supported with Schroeder-phase discrimination nor with modulation detection thresholds at 10- and 50-Hz modulation.
Trends over time were also analyzed for individual listeners using spectral-ripple discrimination and temporal modulation detection data. The hypothesis was supported for most individual listeners; however, not for all. For spectral-ripple discrimination, a minority of listeners (20%) had statistically significant improvements over time, whereas others (20%) got significantly worse over time. This observation limits the conclusions regarding individual listeners in clinical assessments over the first year of CI use. That is, if evaluating a single patient of limited CI experience with two different treatment or processing strategies, it is possible that individual learning could take place, independent of the treatment. However, for group assessment in clinical research, clinically significant group-wide learning on the spectral-ripple task is unlikely.
For modulation detection thresholds, 65% of the listener-condition combinations did not differ significantly from 0 slope. The other 35% had small slopes ranging from −0.14 to −0.36, with typical statistically significant slopes in the −0.2 to −0.3 range. Over 11 months, this amounts to a few dB change which is considerably smaller than the mean repeatability of 5.9 dB. It is also quite a small change in comparison to the 15-dB range of scores observed across a larger cohort using acute testing of experienced CI users (Won et al. 2011a). The implication is that the individual statistically significant improvements over 11 months are not clinically meaningful.
The improvement in speech discrimination over the period 1- to 12-months post activation was less than one might expect given previous studies showing speech performance over the first years of implantation (Dorman et al. 1990; Oh et al. 2003; Ruffin et al. 2007). These previous studies showed that most users had improvements in word and phoneme recognition much greater than the 8% observed here, although Tyler et al. (1997) and Zwolan et al. (2014) found similar improvements over the period. Tyler et al. (1997), however, showed more dramatic improvements in the first month post activation. More improvement might have occurred in the first month post activation in this study, because initial testing took place at 1-month post activation. The improvements also might have been limited in some listeners by ceiling effects, thus the present result might reflect a cohort with better abilities than in previous studies.
Speech-in-noise performance did not increase significantly over time. This might be a trait of this individual cohort, or it might reflect a small effect for which the cohort was not large enough to demonstrate. It also might be that it takes longer for speech-in-noise performance to mature. In bilateral studies, for example, the effects of bilateral squelch of speech in noise have been shown to take a year or longer to develop (Buss et al. 2008; Eapen et al. 2009). It is possible that speech in noise performance for unilateral use also takes longer to mature. Testing over a longer time interval with a larger cohort would be required to test that hypothesis.
Reliability data
Another clinically relevant aspect of non-speech assessments of hearing is test-retest reliability. Both short-term and long-term reliability measures are of interest for acute and longitudinal clinical research, respectively. Previous work by the authors demonstrated good reliability of these and similar measures over the short term, where test and retest data were collected within a week or two of each other (Drennan et al. 2014; Drennan et al. 2008; Won et al. 2011a; Won et al. 2007). The data from previous studies were collected using the same psychophysical methods as used in the present study; however, ICC and repeatability data were not previously reported. ICC and repeatability scores calculated on the basis of data from previous studies are shown in Table 8 as well averages from the long-term data in the present study. These tests include all the same tests reported here as well as “clinical” ripple data, data from a rapid 6-minute test, which could be used in a clinical setting (Drennan et al. 2014).
Table 8.
The table shows short-term and long-term test-retest reliability data in post-lingually deafened adult CI users. Short-term data are from previous studies, and long-term data are from the present study. The short-term reliability data are based on the exact same methods as thosed used in the present study with a different cohort of CI users. *MDT data were collected on the same listeners who participated in Drennan et al. (2014) using the same methods presented in the present study. The ** indicates that the intraclass correlation was not significantly different from 0 at the 5% level. All other intraclass correlation coefficients were statistically significant.
| Short Term | Long Term (N = 10) | |||||
|---|---|---|---|---|---|---|
| Test | Data Source | N | Repeatability | ICC | Mean Repeatability | ICC |
| Adaptive Ripple 6x | Won et al. (2007) | 22 | 0.96 rpo | 0.88 | 1.5 rpo | 0.89 |
| Clinical Ripple | Drennan et al. (2014) | 27 | 8.5% | 0.89 | -- | -- |
| 10-Hz MDT 3x | Unpublished* | 28 | 8.2 dB | 0.55 | 7.2 dB | 0.67 |
| 75-Hz MDT 3x | Unpublished* | 28 | 5.9 dB | 0.83 | -- | -- |
| 150-Hz MDT 3x | Unpublished* | 28 | 5.5 dB | 0.75 | 6.1 dB | 0.85 |
| 300-Hz MDT 3x | Unpublished* | 28 | 2.7 dB | 0.80 | 6.9 dB | 0.08** |
| 50-Hz Schroeder | Drennan et al. (2008) | 17 | 16.8% | 0.83 | 13.9% | 0.86 |
| 100-Hz Schroeder | Drennan et al. (2008) | 17 | 13.5% | 0.91 | -- | -- |
| 200-Hz Schroeder | Drennan et al. (2008) | 17 | 17.0% | 0.79 | 26.4% | 0.70 |
| 400-Hz Schroeder | Drennan et al. (2008) | 17 | 19.4% | 0.36** | -- | -- |
For spectral-ripple discrimination, ICC data are about the same for short-term and long-term testing, and for both the adaptive and clinical ripple tests. Values of 0.88 and 0.89 suggest that the spectral-ripple test is highly reliable. Repeatability values for spectral-ripple data appear somewhat higher for long-term than for short-term reliability testing; however, the long-term repeatability values appear to drop to the same level as short-term data as CI users gain more experience (See Table 4). The short-term repeatability data for the “clinical” ripple test are excellent. The repeatability value of 8.5% is notably lower than the test-retest 95% critical intervals for CNC words (Carney et al. 2007; Thornton et al. 1978). Critical intervals for word lists are generally substantially larger and only as little as 10% for the most extreme ranges of performance of less than 10% correct or greater than 90% correct, even for 100-word lists. The range of possible performance in the clinical ripple task is compressed somewhat relative to speech given chance performance of 33%; however, the repeatability of the clinical ripple tests appears at least as good as, if not better than speech tests. Given the high ICC, good repeatability, and strong correlation with speech scores, the clinical ripple test is potentially of great value for acute diagnostic testing in a clinical setting.
For temporal modulation detection, ICC values are generally in the 0.75 – 0.89 range, indicating good reliability, with the exception of 10-Hz modulation which had lower ICCs and 300-Hz modulation in long-term testing which had an ICC of effectively 0. For Schroeder-phase discrimination, ICC values were acceptable, but the repeatability values were quite large compared to the clinical ripple test. There was also significant learning across the group over the 11-month testing period. This measure also has lower correlations with speech understanding. The correlative relationship was not significant in this study, but was significant with larger cohorts (Drennan et al. 2008). Schroeder-phase discrimination appears less viable for clinical use, although the test did show meaningful group results in acute testing comparing two different CI processing strategies (Drennan et al. 2010).
The spectral-ripple discrimination test reliability and strong correlation with speech performance suggests it would be a meaningful test for hearing acuity in CI cohorts of about this size or larger. The results suggest spectral-ripple discrimination acutely measures a basic ability to resolve acoustic information. This might serve as a biomarker for the health of the peripheral auditory system, being sensitive to channel interactions as measured objectively (Scheperle and Abbas 2015; Won et al. 2014a). Integrating the new information with a central preexisting map of language takes more time.
The tests could limit the need for longitudinal testing in clinical trials, and potentially provide better counseling information for audiologists, giving them a better sense of expected long-term outcomes during early audiology visits. It is possible that even on the first day of activation, a short clinically-viable version of the spectral-ripple discrimination test (e.g., Drennan et al. 2014) could provide this information, although further study with earlier testing in a larger cohort would be required to verify. Caution, however, should always be exercised when implementing a non-speech test as a surrogate measure for speech. For the lowest level surrogate, diagnostic evaluation, a correlation is a sufficient indicator. Such a test might be particularly useful for patients who do not speak a native language for which a validated speech test is available. In comparative testing, a higher level surrogate is required (Fleming et al. 2012). The surrogate might work only as an indicator of clinical benefit of a treatment approach in certain conditions. For example, speech tests might be highly susceptible to audibility of consonant sounds. However, the non-speech tests are likely to be less susceptible to loss of high frequency audibility because they are broad band tests. If, for example, a CI map provided bad audibility, this might have significant negative effects on speech perception, but little effect on non-speech measures.
Spectral-ripple discrimination ability is a measure of hearing ability, rather than of language understanding ability. Language understanding would certainly be influenced by hearing ability, but it would be expected to be influenced also by plasticity, cognitive factors, and language experience. The lack of improvement over time in the spectral- ripple test suggests that improvements in speech perception over time in CI users is not driven by changes in spectral acuity. Thus, the test might be useful to acutely compare processing strategies, as observed by Drennan et al. (2010), or to acutely compare devices or treatments designed to improve spectral resolution. Being non-linguistic, these psychophysical tests are potentially useful with CI users who have any language as their native language and not subject to the limitations or ceiling effects of speech tests.
The Schroeder-phase data showed a more consistent effect over time, with improvements over the whole 12-month period and not just between months 1 and 3 after activation. This was the only test where feedback was provided to listeners, so this might have influenced procedural learning in a short time frame. The weak effect of repetition might reflect procedural learning, but feedback is unlikely to influence performance over the 2–3 months breaks between testing sessions. Thus, the improvement in Schroeder-phase scores appears to be related to perceptual learning. For Schroeder-phase discrimination, the listeners with the largest improvements over time were not the same as listeners with the largest improvements in speech performance. The correlations comparing the 1-month to 12-month change in Schroeder-phase vs. 1-month to 12-month change in CNC scores were calculated for both Schroeder frequencies, but neither were significant correlations. A larger cohort might reveal a weakly significant effect, or it might be that Schroeder-phase perceptual learning and perceptual learning of speech in quiet are simply unrelated.
In summary, unlike speech understanding in quiet, group spectral-ripple discrimination ability did not change from 1 to 12-months post activation. Spectral-ripple discrimination data was well correlated with speech discrimination data in CI users. The spectral-ripple discrimination tests were highly reliable across short- and long-term testing intervals. This suggests that the spectral-ripple discrimination is a clinically meaningful measure which could be used as a clinical tool to acutely assess functional CI outcomes.
Acknowledgments
The authors gratefully acknowledge the dedicated efforts of our listeners. This work was supported by NIH NIDCD RO1-DC010148, R01-DC007525, P30-DC04661, F31-DC009755, and L30-D008490.
Footnotes
No conflicts of interest to declare.
References
- Anderson ES, Nelson DA, Kreft H, et al. Comparing spatial tuning curves, spectral ripple resolution, and speech perception in cochlear implant listeners. J Acoust Soc America. 2011;130:364–375. doi: 10.1121/1.3589255. [DOI] [PMC free article] [PubMed] [Google Scholar]
- Bacon SP, Viemeister NF. Temporal modulation transfer functions in normal-hearing and hearing-impaired listeners. Audiology. 1985;24:117–134. doi: 10.3109/00206098509081545. [DOI] [PubMed] [Google Scholar]
- Bland JM, Altman DG. Measurement error. BMJ. 1996a;313:744. doi: 10.1136/bmj.313.7059.744. [DOI] [PMC free article] [PubMed] [Google Scholar]
- Bland JM, Altman DG. Measurement error and correlation coefficients. BMJ. 1996b;313:41–42. doi: 10.1136/bmj.313.7048.41. [DOI] [PMC free article] [PubMed] [Google Scholar]
- Buss E, Pillsbury HC, Buchman CA, et al. Multicenter U.S. bilateral MED-EL cochlear implantation study: speech perception over the first year of use. Ear Hear. 2008;29:20–32. doi: 10.1097/AUD.0b013e31815d7467. [DOI] [PubMed] [Google Scholar]
- Byrne D, Dillon H, Tran K, et al. An international comparison of long-term average speech spectra. J Acoust Soc Am. 1994;96:2108–2120. [Google Scholar]
- Carney E, Schlauch RS. Critical difference table for word recognition testing derived using computer simulation. J Speech Lang Hear Res. 2007;50:1203–1209. doi: 10.1044/1092-4388(2007/084). [DOI] [PubMed] [Google Scholar]
- Dooling RJ, Leek MR, Gleich O, et al. Auditory temporal resolution in birds: Discrimination of harmonic complexes. J Acoust Soc Am. 2002;112:748–759. doi: 10.1121/1.1494447. [DOI] [PubMed] [Google Scholar]
- Dorman MF, Dankowski K, McCandless G, et al. Longitudinal changes in word recognition by patients who use the Ineraid cochlear implant. Ear Hear. 1990;11:455–459. doi: 10.1097/00003446-199012000-00008. [DOI] [PubMed] [Google Scholar]
- Drennan WR, Anderson ES, Won JH, et al. Validation of a clinical assessment of spectral-ripple resolution for cochlear implant users. Ear Hear. 2014;35:e92–98. doi: 10.1097/AUD.0000000000000009. [DOI] [PMC free article] [PubMed] [Google Scholar]
- Drennan WR, Longnion J, Ruffin C, et al. Discrimination of Schroeder-phase harmonic complexes by normal-hearing and cochlear implant listeners. J Assoc Res Otolarygol. 2008;9:138–149. doi: 10.1007/s10162-007-0107-6. [DOI] [PMC free article] [PubMed] [Google Scholar]
- Drennan WR, Won JH, Nie K, et al. Sensitivity of psychophysical measures to signal processor modifications in cochlear implant users. Hear Res. 2010;262:1–8. doi: 10.1016/j.heares.2010.02.003. [DOI] [PMC free article] [PubMed] [Google Scholar]
- Drennan WR, Longnion J, Ruffin C, et al. Discrimination of Schroeder-phase harmonic complexes by normal-hearing and cochlear implant listeners. J Assoc Res Otolarygol. 2008;9:138–149. doi: 10.1007/s10162-007-0107-6. [DOI] [PMC free article] [PubMed] [Google Scholar]
- Eapen RJ, Buss E, Adunka MC, et al. Hearing-in-noise benefits after bilateral simultaneous cochlear implantation continue to improve 4 years after implantation. Otol Neurotol. 2009;30:153–159. doi: 10.1097/mao.0b013e3181925025. [DOI] [PMC free article] [PubMed] [Google Scholar]
- Fleming TR, Powers JH. Biomarkers and surrogate endpoints in clinical trials. Statistics in Medicine. 2012;31:2973–2984. doi: 10.1002/sim.5403. [DOI] [PMC free article] [PubMed] [Google Scholar]
- Fu QJ. Temporal processing and speech recognition in cochlear implant users. Neuroreport. 2002;13:1635–1639. doi: 10.1097/00001756-200209160-00013. [DOI] [PubMed] [Google Scholar]
- Gfeller K, Witt S, Adamek M, et al. Effects of training on timbre recognition and appraisal by postlingually deafened cochlear implant recipients. J Am Acad Audiol. 2002;13:132–145. [PubMed] [Google Scholar]
- Gifford RH, Hedley-Williams A, Spahr AJ. Clinical assessment of spectral modulation detection for adult cochlear implant recipients: a non-language based measure of performance outcomes. Int J Audiol. 2014;53:159–164. doi: 10.3109/14992027.2013.851800. [DOI] [PMC free article] [PubMed] [Google Scholar]
- Harris RW. Speech audiometry materials compact disk. Provo, UT: Brigham Young University; 1991. [Google Scholar]
- Henry BA, Turner CW. The resolution of complex spectral patterns by cochlear implant and normal-hearing listeners. J Acoust Soc Am. 2003;113:2861–2873. doi: 10.1121/1.1561900. [DOI] [PubMed] [Google Scholar]
- Henry BA, Turner CW, Behrens A. Spectral peak resolution and speech recognition in quiet: normal hearing, hearing impaired and cochlear implant listeners. J Acoust Soc Am. 2005;118:1111–1121. doi: 10.1121/1.1944567. [DOI] [PubMed] [Google Scholar]
- Holm S. A simple sequentially rejective multiple test procedure. Scandinavian Journal of Statistics. 1979;6:65–70. [Google Scholar]
- Jones GL, Won JH, Drennan WR, et al. Relationship between channel interaction and spectral-ripple discrimination in cochlear implant users. J Acoust Soc Am. 2013a;133:425–433. doi: 10.1121/1.4768881. [DOI] [PMC free article] [PubMed] [Google Scholar]
- Jones GL, Won JH, Drennan WR, et al. Relationship between channel interaction and spectral-ripple discrimination in cochlear implant users. J Acoust Soc Am. 2013b;133:425–433. doi: 10.1121/1.4768881. [DOI] [PMC free article] [PubMed] [Google Scholar]
- Levitt H. Transformed Up-down methods in psychoacoustics. J Acoust Soc Am. 1971;49:467–477. [PubMed] [Google Scholar]
- Litvak LM, Spahr AJ, Saoji AA, et al. Relationship between percpetion of spectral ripple and speech recognition in cochlear implant and vocoder listeners. J Acoust Soc Am. 2007;122:982–991. doi: 10.1121/1.2749413. [DOI] [PubMed] [Google Scholar]
- Lovett R, Summerfield Q, Vickers D. Test-retest reliability of the Toy Discrimination Test with a masker of noise or babble in children with hearing impairment. Int J Audiol. 2013;52:377–384. doi: 10.3109/14992027.2013.769064. [DOI] [PubMed] [Google Scholar]
- Moberly AC, Lowenstein JH, Nittrouer S. Word Recognition Variability With Cochlear Implants: “Perceptual Attention” Versus “Auditory Sensitivity”. Ear Hear. 2015 doi: 10.1097/AUD.0000000000000204. [DOI] [PMC free article] [PubMed] [Google Scholar]
- Oh SH, Kim CS, Kang EJ, et al. Speech perception after cochlear implantation over a 4-year time period. Acta Otolaryngol. 2003;123:148–153. doi: 10.1080/0036554021000028111. [DOI] [PubMed] [Google Scholar]
- Peterson GE, Lehiste I. Revised CNC lists for auditory tests. J Speech Hear Disord. 1962;27:62–70. doi: 10.1044/jshd.2701.62. [DOI] [PubMed] [Google Scholar]
- Ruffin CV, Tyler RS, Witt SA, et al. Long-term performance of Clarion 1.0 cochlear implant users. Laryngoscope. 2007;117:1183–1190. doi: 10.1097/MLG.0b013e318058191a. [DOI] [PubMed] [Google Scholar]
- Saoji AA, Litvak L, Spahr AJ, et al. Spectral modulation detection and vowel and consonant identifications in cochelar implant listeners (L) J Acoust Soc Am. 2009;126:955–958. doi: 10.1121/1.3179670. [DOI] [PubMed] [Google Scholar]
- Scheperle RA, Abbas PJ. Relationships Among Peripheral and Central Electrophysiological Measures of Spatial and Spectral Selectivity and Speech Perception in Cochlear Implant Users. Ear Hear. 2015;36:441–453. doi: 10.1097/AUD.0000000000000144. [DOI] [PMC free article] [PubMed] [Google Scholar]
- Schroeder MR. Synthesis of low-peak-factor signals and binary sequences with low autocorrelation. IEEE Trans Inf Theory. 1970;16:85–89. [Google Scholar]
- Shim HJ, Won JH, Moon IJ, et al. Can Unaided Non-Linguistic Measures Predict Cochlear Implant Candidacy? Otol Neurotol. 2014 doi: 10.1097/MAO.0000000000000323. [DOI] [PMC free article] [PubMed] [Google Scholar]
- Spahr A, Saoji A, Litvak L, et al. Spectral cues for understanding speech in quiet and noise. Int J Audiol. 2011;12:S66–S69. doi: 10.1179/146701011X13001035753056. [DOI] [PubMed] [Google Scholar]
- Summerfield Q, Palmer AR, Foster JR, et al. Clinical evaluation and test-retest reliability of the IHR-McCormick Automated Toy Discrimination Test. Br J Audiol. 1994;28:165–179. doi: 10.3109/03005369409086564. [DOI] [PubMed] [Google Scholar]
- Svirsky MA, Talavage TM, Sinha S, et al. Gradual adaptation to auditory frequency mismatch. Hear Res. 2015;322:163–170. doi: 10.1016/j.heares.2014.10.008. [DOI] [PMC free article] [PubMed] [Google Scholar]
- Thornton AR, Raffin MJ. Speech-discrimination scores modeled as a binomial variable. J Speech Hear Res. 1978;21:507–518. doi: 10.1044/jshr.2103.507. [DOI] [PubMed] [Google Scholar]
- Turner CW, Gantz BJ, Vidal C, et al. Speech recognition in noise for cochlear implant listeners: Benefits of residual acoustic hearing. J Acoust Soc Am. 2004;115:1729–1735. doi: 10.1121/1.1687425. [DOI] [PubMed] [Google Scholar]
- Tye-Murray N, Tyler RS, Woodworth GG, et al. Performance over time with a Nucleus or Ineraid cochlear implant. Ear Hear. 1992;13:200–209. doi: 10.1097/00003446-199206000-00010. [DOI] [PubMed] [Google Scholar]
- Tyler RS, Parkinson AJ, Woodworth GG, et al. Performance over time of adult patients using the Ineraid or Nucleus cochlear implant. J Acoust Soc Am. 1997;102:508–522. doi: 10.1121/1.419724. [DOI] [PubMed] [Google Scholar]
- Viemeister NF. Temporal modulation transfer functions based upon modulation thresholds. J Acoust Soc Am. 1979;66:1364–1380. doi: 10.1121/1.383531. [DOI] [PubMed] [Google Scholar]
- Won JH, Drennan WR, Kang RS, et al. Psychoacoustic abilities associated with music perception in cochlear implant users. Ear Hear. 2010;31:796–805. doi: 10.1097/AUD.0b013e3181e8b7bd. [DOI] [PMC free article] [PubMed] [Google Scholar]
- Won JH, Drennan WR, Nie K, et al. Acoustic temporal modulation detection and speech perception in cochlear implant listeners. J Acoust Soc Am. 2011a;130:376–388. doi: 10.1121/1.3592521. [DOI] [PMC free article] [PubMed] [Google Scholar]
- Won JH, Drennan WR, Rubinstein JT. Spectral-ripple resolution correlates with speech reception in noise in cochlear implant users. J Assoc Res Otolaryngol. 2007;8:384–392. doi: 10.1007/s10162-007-0085-8. [DOI] [PMC free article] [PubMed] [Google Scholar]
- Won JH, Humphrey EL, Yeager KR, et al. Relationship among the physiologic channel interactions, spectral-ripple discrimination, and vowel identification in cochlear implant users. J Acoust Soc Am. 2014a;136:2714–2725. doi: 10.1121/1.4895702. [DOI] [PubMed] [Google Scholar]
- Won JH, Jones GL, Drennan WR, et al. Evidence of across-channel processing for spectral-ripple discrimination in cochlear implant listeners. J Acoust Soc Am. 2011b;130:2088–2097. doi: 10.1121/1.3624820. [DOI] [PMC free article] [PubMed] [Google Scholar]
- Won JH, Lorenzi C, Nie K, et al. The ability of cochlear implant users to use temporal envelope cues recovered from speech frequency modulation. J Acoust Soc America. 2012;132:1113–1119. doi: 10.1121/1.4726013. [DOI] [PMC free article] [PubMed] [Google Scholar]
- Won JH, Shim HJ, Lorenzi C, et al. Use of amplitude modulation cues recovered from frequency modulation for cochlear implant users when original speech cues are severely degraded. J Assoc Res Otolaryngol. 2014b;15:423–439. doi: 10.1007/s10162-014-0444-1. [DOI] [PMC free article] [PubMed] [Google Scholar]
- Zwolan TA, Henion K, Segel P, et al. The role of age on cochlear implant performance, use, and health utility: a multicenter clinical trial. Otol Neurotol. 2014;35:1560–1568. doi: 10.1097/MAO.0000000000000583. [DOI] [PubMed] [Google Scholar]


