Abstract
The organization in brain networks shows highly modular features with weak inter-modular interaction. The topology of the networks involves emergence of modules and sub-modules at different levels of constitution governed by fractal laws that are signatures of self-organization in complex networks. The modular organization, in terms of modular mass, inter-modular, and intra-modular interaction, also obeys fractal nature. The parameters which characterize topological properties of brain networks follow one parameter scaling theory in all levels of network structure, which reveals the self-similar rules governing the network structure. Further, the calculated fractal dimensions of brain networks of different species are found to decrease when one goes from lower to higher level species which implicates the more ordered and self-organized topography at higher level species. The sparsely distributed hubs in brain networks may be most influencing nodes but their absence may not cause network breakdown, and centrality parameters characterizing them also follow one parameter scaling law indicating self-similar roles of these hubs at different levels of organization in brain networks. The local-community-paradigm decomposition plot and calculated local-community-paradigm-correlation co-efficient of brain networks also shows the evidence for self-organization in these networks.
One of the most important issues in the study of brain networks is the origin of functional modules, organization of these modules, and their functional relationships. Brain networks, constructed from various experimental studies on brains of different species, exhibit hierarchical features (highly modular structure)1,2, and these modules are believed to be sufficiently isolated to enable them to perform independent functions3. These sparsely distributed modules in brain network are shown to exhibit small-world topology, which have large local clustering co-efficients and very small path lengths4,5, and it may allow the modules to perform independent functions6. On the other hand, studies on brain networks derived from functional magnetic resonance imaging (fMRI)7,8,9, structural MRI10, and diffusion tensor MRI11 show small worldness in brain networks which seems inconsistent with the observed high modularity. High clustering in small worldness, which is a local parameter, could not explain the global high modularity of brain networks1,12,13; and short path length in small worldness is also not suitable for strong modularity13,14. Since the strong modularity corresponds to large world, the hierarchically organized, highly clustered, nearly isolated, and self-similar set of modules are shown to be weakly tied among themselves14, as a consequence of which the network preserves the small-world properties13. Therefore, the weak ties among the modules are believed to maximize the information transfer among the modules with minimum wiring cost, and also allow to maintain small-world topological characteristics13,15. Further, these weak connections among modules in brain networks compel limited propagation of avalanche of neurons among the modules and are modular size dependent16.
Fractality or self-similar structures in a complex network could be one property which can explain functional relationships of a larger network down to the fundamental structure through different levels of organization14,17. Scaling and renormalization theory can probably highlight the importance of information flow in a complex network and its self-organization18. It has been shown that hierarchical organization of modules in functional brain networks (fMRI) show fractal properties13. This fractal organization of modules in the network keeps hubs tightly bound inside corresponding modules, and use low-degree nodes as inter-modular connectors showing disassortative topology19. Further, it has been shown that networks (forty seven different networks) which are structurally self-organized follow fractal law in parameter space of network size and edge density20. However, whether organization of modules and sub-modules at different topological levels follow fractal nature or not is still an open question. Further, whether the fractal properties exist in brain networks of different organisms (lower to higher level organisms) is not fully investigated.
In this study, brain networks of four different species (from lower to higher level of brain organization), namely, C. elegans, cat, macaque monkey, and human were investigated. Scaling laws and fractal rules were applied on several topological parameters to investigate the self-organization and fractal properties of the brain networks. Recently, Cannistraci et al.21 proposed a technique known as local-community-paradigm (LCP) to estimate the size of local communities and their information, which can be used as an indicator self-organization in complex networks. We implement this technique to brain networks, and we study the robustness of self-organization not only on complete networks but also at various levels of network organization.
Results
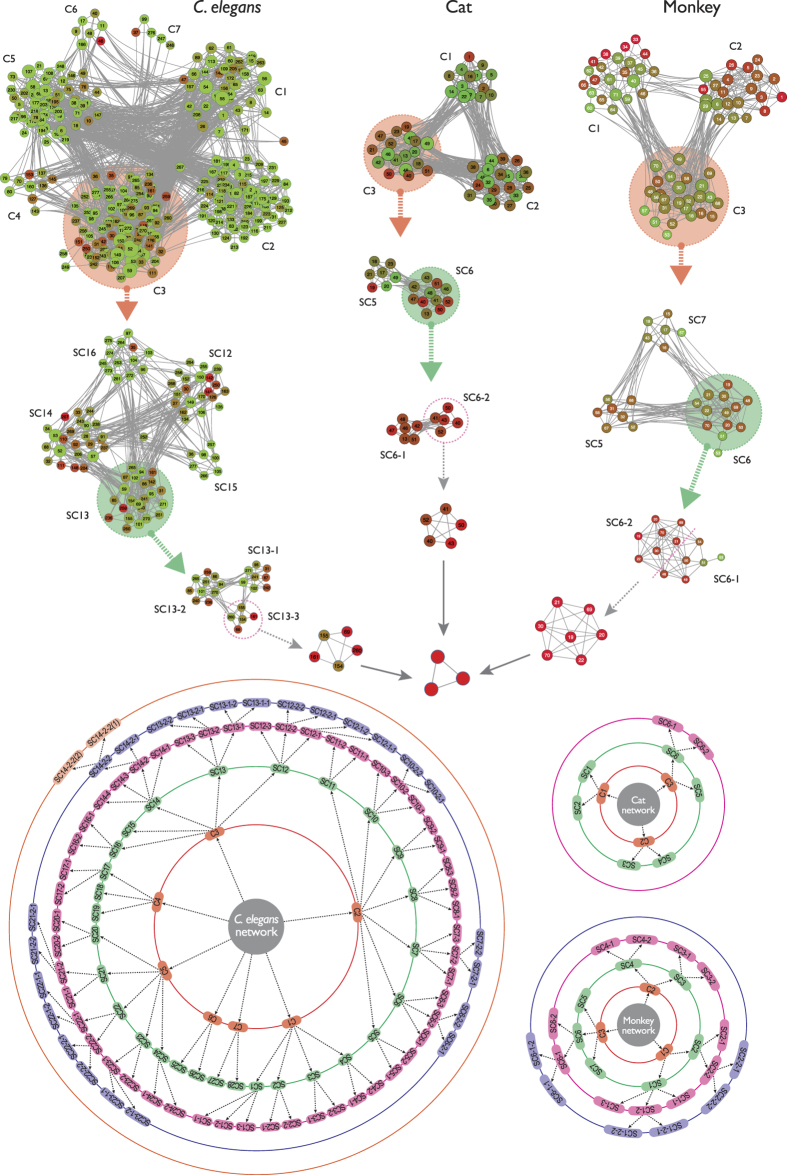
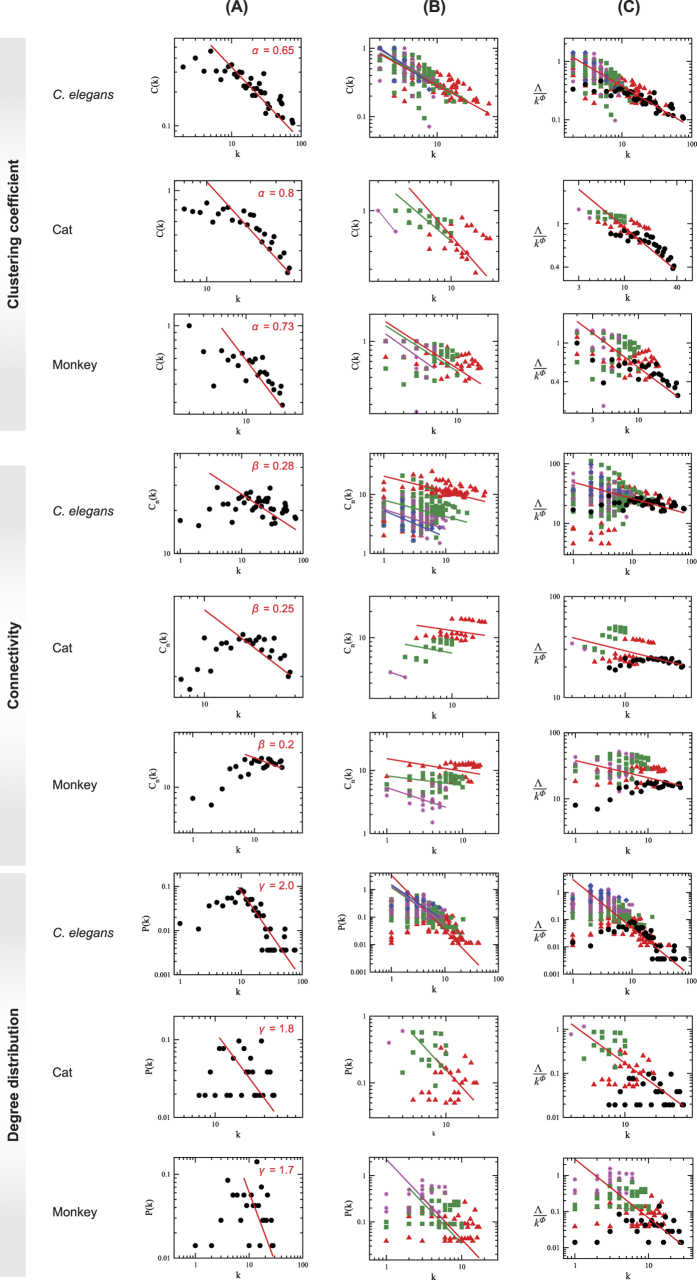
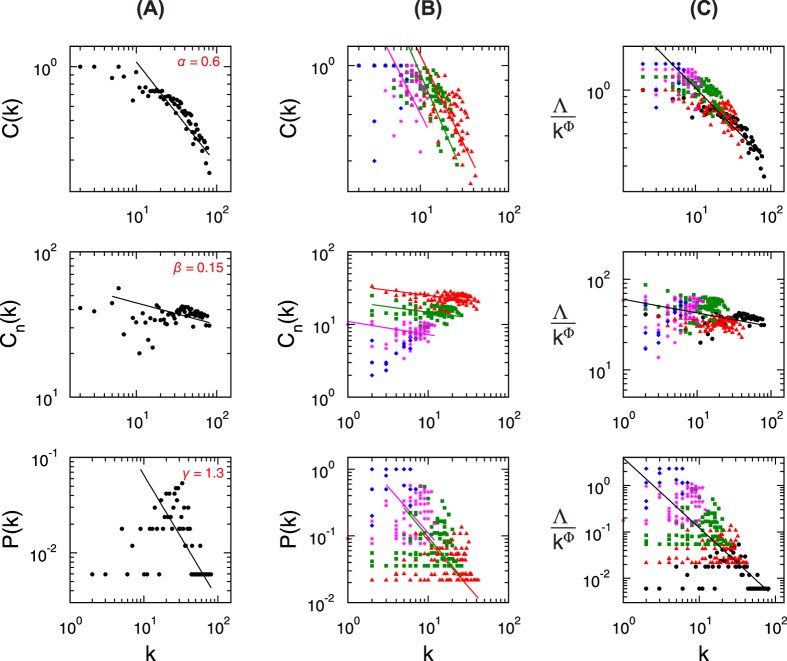
The topological properties of hierarchical network, which involve emergence of well-defined modules with few sparsely distributed hubs, can be characterized by three topological parameters, namely, probability of degree distribution P(k), P(k) ~ k−γ, with γ ≤ 2.022, clustering co-efficient C(k), C(k) ~ k−α, with α ≈ 123, and neighborhood connectivity Cn(k), Cn(k) ~ k−β with β ≈ 0.524; and follow power-law distributions with degree k25. To prove the existence of power law, we implement the statistical technique proposed by Clauset et al.26 (Methods) to the data and found that the calculated p-values are above the threshold value 0.1 (Table 1), which indicates that power-law distribution could not be ruled out. However, as some of the data set are sparsely distributed, we remove (as required) few low-degree nodes and maximum number of larger degree data are retained during the fitting procedure. The set of the exponents (γ, α, β) of the three distributions (P(k), C(k), Cn(k)) calculated using network theory for the four species, namely, C. elegans, cat, monkey, and human, are given by: C. elegans → (2.0, 0.65, 0.28); cat → (1.8, 0.8, 0.25); monkey → (1.7, 0.73, 0.2); and human → (1.3, 0.6, 0.15), showing hierarchical features in all the four brain networks studied (Figs 1, 2 and 3 panels (A), and Fig. 4 panels (A)). The organization of modules and smaller modules at different levels (level-1 modules are the set of modules constructed from the networks, level-2 sub-modules are the set of all sub-modules constructed from level-1 modules, and so on) of the four species (Fig. 1) shows the hierarchical properties. The smallest module in each brain network (C. elegans, cat, monkey, and human), from which all the three distributions (P(k), C(k), and Cn(k)) can be calculated, is found to be a triangular motif (Fig. 1). So one can think of triangular motif as the fundamental regulator of each brain network.
Table 1. Test results for power-law distribution*.
| Parameters | Species | n | p-value | Goodness of fits | |
|---|---|---|---|---|---|
| Whole network | Clustering coefficient | C. elegans | 39 | 0.766 | 0.1114992 |
| Cat | 22 | ~0.11 | 0.2635055 | ||
| Monkey | 20 | 0.1344 | 0.1564396 | ||
| Human | 59 | 0.12 | 0.238144 | ||
| Neighborhood connectivity | C. elegans | 36 | 0.8328 | 0.1372943 | |
| Cat | 25 | 0.62 | 0.1514593 | ||
| Monkey | 24 | 0.3804 | 0.2047339 | ||
| Human | 59 | 0.6968 | 0.07790939 | ||
| Degree distribution | C. elegans | 277 | 0.5568 | 0.04458331 | |
| Cat | 51 | 0.1132 | 0.1160309 | ||
| Monkey | 71 | 0.1084 | 0.1052469 | ||
| Human | 168 | 0.168 | 0.07514285 | ||
| Data set after scaling from all levels | Clustering coefficient | C. elegans | 318 | 0.1752 | 0.1017557 |
| Cat | 70 | 0.6064 | 0.08411472 | ||
| Monkey | 113 | 0.4284 | 0.07989214 | ||
| Human | 308 | 0.7112 | 0.04166865 | ||
| Neighborhood connectivity | C. elegans | 351 | 0.2192 | 0.05529387 | |
| Cat | 70 | 0.32 | 0.08908077 | ||
| Monkey | 124 | 0.1976 | 0.1044134 | ||
| Human | 310 | 0.8816 | 0.04186619 | ||
| Degree distribution | C. elegans | 361 | 0.2876 | 0.06655764 | |
| Cat | 69 | 0.115 | 0.1035658 | ||
| Monkey | 124 | 0.6324 | 0.08231645 | ||
| Human | 310 | 0.5048 | 0.05792419 | ||
| Betweenness centrality | C. elegans | 264 | 0.3384 | 0.0652874 | |
| Cat | 61 | 0.1148 | 0.1140632 | ||
| Monkey | 98 | 0.3816 | 0.07636612 | ||
| Human | 254 | 0.2776 | 0.07253436 | ||
| Closeness centrality | C. elegans | 364 | 0.1728 | 0.1119073 | |
| Cat | 71 | ~0.1 | 0.172004 | ||
| Monkey | 107 | 0.2084 | 0.1183037 | ||
| Human | 280 | 0.1384 | 0.08605586 | ||
| Eigenvector centrality | C. elegans | 340 | 0.608 | 0.08864998 | |
| Cat | 71 | 0.26 | 0.1180827 | ||
| Monkey | 123 | 0.5508 | 0.1134687 | ||
| Human | 299 | 0.1708 | 0.08715249 |
*Values calculated against 2500 random sampling.
Figure 1. Hierarchical organization of brain networks of C. elegans, cat, and monkey at different levels.
The upper parts show the topological arrangement of modules and sub-modules at various levels of organization (one way of largest module and sub-module) till the motif level. The lower parts show the organization of all modules and sub-modules at different levels (levels are indicated by circles) of the brain networks of the three species.
Figure 2. Modules and sub-modules at various levels of organization (with levels indicated by circles) of the brain network of human species.
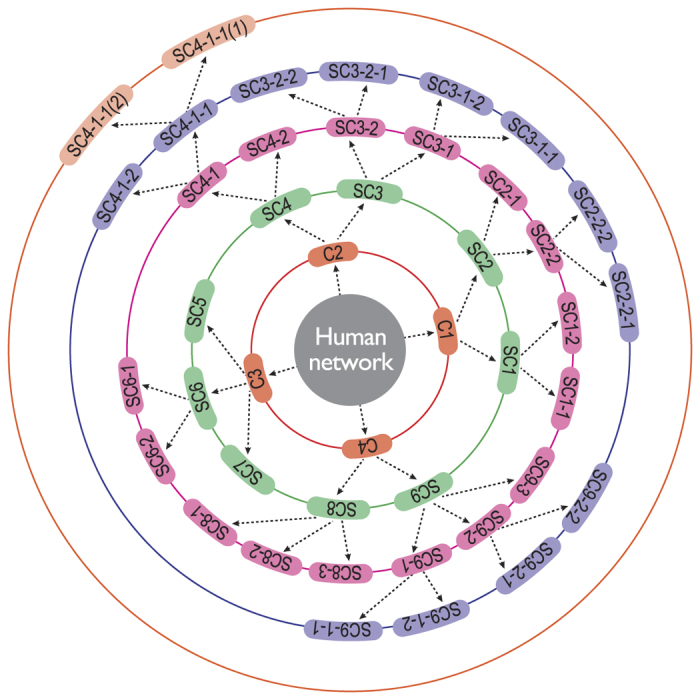
Figure 3.
Topological characteristics of brain networks of three species, C. elegans, cat, and monkey: (A) for whole brain network, (B) for modules and sub-modules at various levels of network, (C) scaled for all modules and sub-modules in all levels to a single plot. The first three upper rows of panels are for clustering co-efficient, next three rows are for neighborhood connectivity, and the last three rows are for probability of degree distribution of the three species.
Figure 4.
Topological characteristics in the case of the brain network of human species: (A) for the whole brain network, (B) for modules and sub-modules at various levels, and (C) scaled for all modules and sub-modules in all levels. First, second, and third rows of panels show the characteristics of clustering co-efficient, neighborhood connectivity, and the probability of degree distribution of the species, respectively.
Scaling of modules at different levels
We now study the topological properties of modules at different levels in each brain network (Fig. 3 panels (A) and (B)). The plotted P(k) versus k of C. elegans of larger modules and sub-modules at different levels (Fig. 1: level-1, C3; level-2, SC13; level-3, SC13-3) show nearly parallel straight lines of power-law fits of P(k) with k at log-log scale. The data points of the modules and sub-modules at different levels along with data of whole network are rescaled to a single plot using one parameter scaling theory (see Methods)27,28,29. Statistical procedure to prove the existence of any power-law distribution26 in the scaled data is implemented and the corresponding p-value is found to be 0.2876, thus fails to reject the power-law hypothesis. The power-law fitting of P(k) on the rescaled data gives γ = 1.8. The same process is done to calculate clustering co-efficient C(k) and neighborhood connectivity Cn(k) of the same data set of modules and sub-modules at different levels, rescaled the data set with original whole network using this one parameter scaling method, fitted with power-law equations with k in log-log scale and found their exponents to be α = 0.7 and β = 0.27, respectively.
Similar network analysis is done for cat, monkey, and human brain networks also (Figs 3 and 4). Scaling of the set of data of each species is done using the one parameter scaling method, and exponents of the respective distributions which specify topological characteristics of the networks are determined by fitting the rescaled data with the respective distribution equations (Fig. 3). The set of exponents (γ, α, β) of the distributions of the scaled data of the other three species are: cat → (1.7, 0.7, 0.25), monkey → (1.6, 0.68, 0.25), and human → (1.5, 0.53, 0.15), respectively.
Fractal nature of modules at different levels
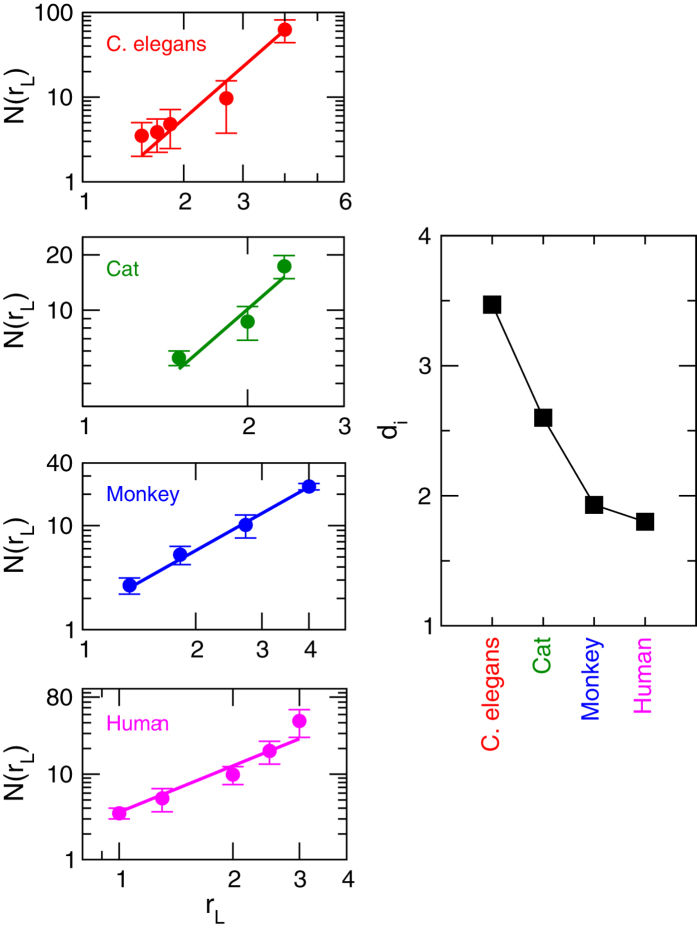
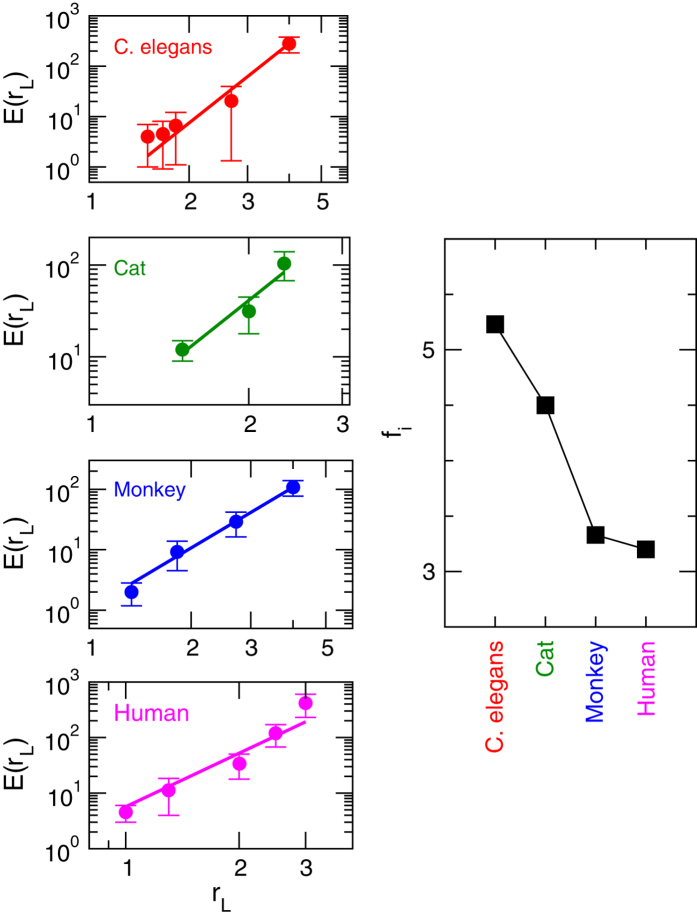
The characterization of self-similar structures in network can be studied from the evolution of structures (number of nodes in the structures) in the network with path length14. We calculated the number of nodes n and diameter RL in each module or sub-module in a certain level L, and then average over number of nodes N = 〈n〉 and path lengths rL = 〈RL〉 of all modules are taken. The evolution of N(rL) as a function of rL for all levels in each network of the four species is shown in Fig. 5. The behavior of N(rL) with rL in all the brain networks follows the following power law:
Figure 5. Scaling behavior of modules and sub-modules at various levels of organization of C. elegans, cat, monkey, and human species by calculating network mass (number of nodes) as a function of diameter.
The right-hand panel shows the respective fractal dimensions of the brain networks of the species.
 |
where di = {di; i = 1, 2, 3, 4} is the set of Hausdorff fractal dimensions of brain networks of the four species. The value of di of brain network of each species can be calculated by fitting the power-law equation (1) on N(rL) versus rL data of the respective species (Fig. 5), and the calculated fractal dimensions of all the four species are shown in Fig. 5. The fractal dimension is found to be the largest for C. elegans (dce = 3.47) and smallest for human (dh = 1.8). Since fractal dimension is directly related to surface morphology of any system, larger value of fractal dimension may probably indicate larger disorder in network organization30. Its smaller value in the brain network of higher level species may reveal the organization of the network is more ordered and systematically self-organized31.
To understand our claim of fractal nature of organization of modules (relating to the interaction) in brain networks, we now calculate the number of edges (e) and diameter (rL) in each module of a certain level (for jth module of Lth level:  ,
,  ), and then obtain average edges and diameter of the modules of the level L of ith species given by
  and
and  , where m is the number of modules/sub-modules at level L. The behavior of Ei as a function of rL again obeys the following power law (Fig. 6):
Figure 6. Fractal nature of modules and sub-modules at various levels of organization of C. elegans, cat, monkey, and human species by calculating the number of intra-edges as a function of diameter.
The right-hand panel shows the variation in the values of fractal dimension of the brain networks of the species.
 |
where fi = {fi; i = 1, 2, 3, 4} is the set of fractal dimension relating to edges of modules and sub-modules of brain networks of the four species. The fractal dimension values of the respective species in this case are found to be higher than the respective values of fractal dimension calculated using network mass or network node number, i.e. fi > di; however, both di and fi show the similar nature (Figs 5 and 6 right panels).
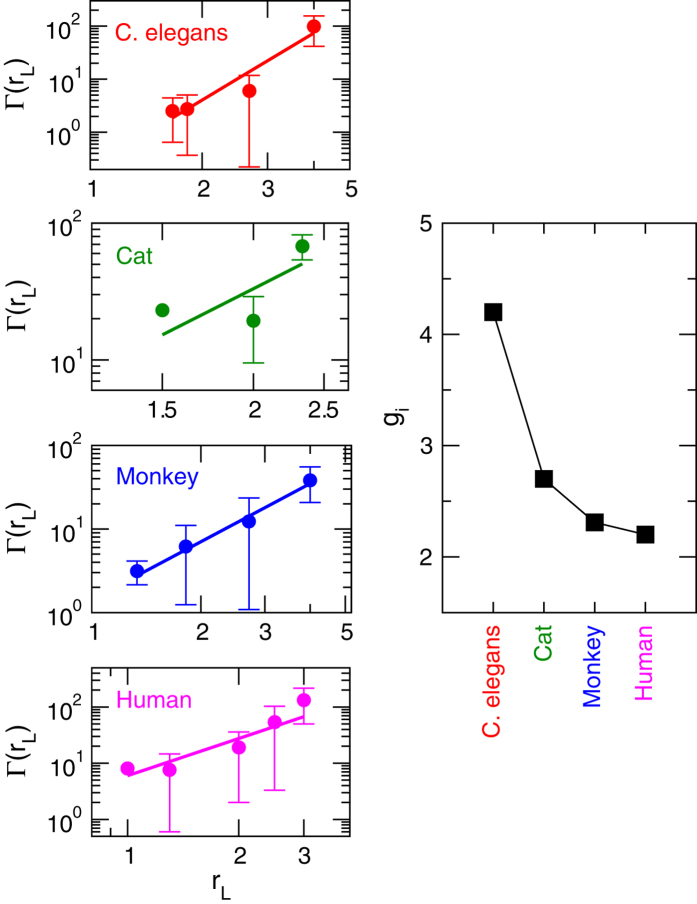
The nature of organization of modules among different levels can also be investigated by studying the inter-modular interaction among the modules and sub-modules. We calculate the number of edges between any pair of modules in a particular level L of brain network of ith species, average over all the inter-modular edges of all possible pairs of modules/sub-modules given by Γi, and then study the variation of Γi as a function of average diameter of all modules/sub-modules rL in the level (Fig. 7). The variation of Γi with rL for all brain networks of the four species C. elegans, cat, monkey, and human (Fig. 7) shows power-law behavior (fitted line to the data points) given by
Figure 7. Self-similar properties of modules and sub-modules at various levels of organization of C. elegans, cat, monkey, and human species by calculating inter-modular edges of all modules and sub-modules as a function of diameter.
The right-hand panel shows the respective fractal dimension values of the brain networks of the species.
 |
where gi = {gi; i = 1, 2, 3, 4} is the set of fractal dimensions of brain networks of all the four species. This power-law nature reveals the fractal nature of the inter-modular organization of the brain networks. The power-law behavior of mass (number of nodes), intra-modular, and inter-modular edges of modules and sub-modules in all the levels of brain networks shows the fractal nature in the organization of brain networks.
The scaling and fractal properties of modules and sub-modules at different levels of the brain network of each species probably connect the topological organization of the modules and sub-modules to their functionalities and working relationships among them, within and among the levels. Further, self-organization among these modules and sub-modules could facilitate quick communication by minimizing the local and global energy expenditure in communication within the network. The increase in the value of fractal dimensions di and fi given by equations (1) and (2) (Figs 5 and 6) indicates the increase in complexity of the network13,30. Since the values of di and fi are minimum in human brain network as compare to the other three species, the modules and sub-modules in this network are more ordered and self-organized locally as well as globally as compared to the brain networks of the other three species. This efficient self-organization in the brain network of a certain species might reflect to the fast brain cognition in that species.
Scaling in centralities and organization
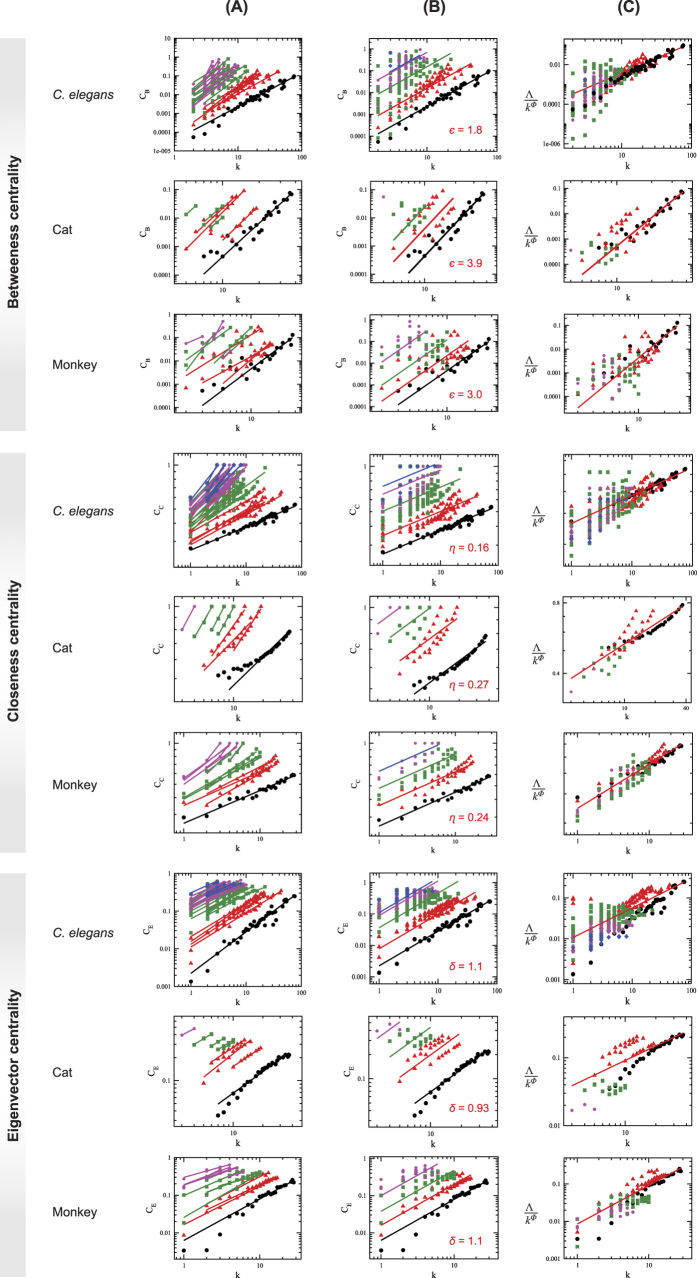
The betweenness centrality of C. elegans, for the whole brain network, modules, and sub-modules at different levels, increases as degree of the network increases (Fig. 8 upper panel) which indicates that hubs in the network has significant roles in intra- and inter-modular/sub-modular signal processing at different levels. Since high value of betweenness centrality of a node of degree k reveals that the node could establish quick communication with other nodes in the network/module/sub-module through short paths32,33,34, hubs in the C. elegans brain network may interfere in various network regulations and act as a controller of the network. Removing such few hubs emerged in the hierarchical brain may cause rewiring of the nodes in the modules and sub-modules at various levels that may introduce new hierarchical topology of modules/sub-modules. The study of betweenness centrality of modules and sub-modules at different levels CB as a function of degree k follows a power-law distribution given by
Figure 8.
Scaling in centrality parameters of brain networks of C. elegans, cat, and monkey species: (A) centrality measures of all modules and sub-modules at various levels of the brain networks, (B) power-law fits on distribution of the centrality measures of each level, and (C) scaled centrality data of all modules and sub-modules into a single curve. The first three upper rows of panels are for betweenness centrality, next three rows are for closeness centrality, and last three rows are for eigenvector centrality of the three species.
 |
where  is the set of power-law exponents for different levels indicated by i. The fitted lines on the data of modules and sub-modules show nearly parallel feature, and the values of
  are in the range [1.23, 3.78]. It is also found that CB of sub-modules changes significantly with the variation in degree k in each level (Fig. 8 uppermost panel (A)). The data of all modules/sub-modules in a certain level are fitted with equation (4), and it is found that the fitted lines on the four different levels are approximately parallel (Fig. 8 uppermost panel (B)). All the data of modules/sub-modules in all the levels are then scaled using one parameter scaling method (see Methods) and finally fitted with equation (4) (Fig. 8 uppermost panel (C)), and the exponent is found to be
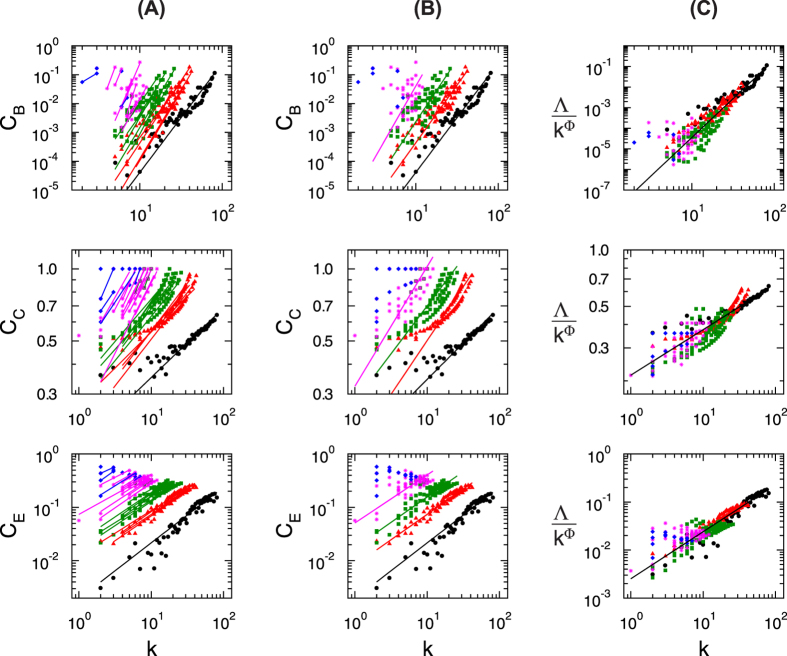
  . Statistical procedure for testing the existence of power-law behavior26 is implemented, and the resulting p-value is found to be 0.3384 which is larger than the threshold value (Table 1). Thus, the scaled data set follows power-law nature. We also observe that smaller modules have better communication among the nodes within each module35. Further, as the smaller modules reach the motif level (here triangular motif), each node in the motif has equal importance (similar due to same degree in each node), with single value of CB. If a particular module at any level is considered, CB increases as k, indicating significant important role of hubs in information processing within the module36,37,38,39,40. The scaling of CB data for all modules and sub-modules in a particular network follows one parameter scaling law (single power-law-fitted line on the scaled data as shown in Figs 8 and 9 panels C) which reveals similar topological constitution of the network at all modules and sub-modules at various levels of organization of the network. We follow the same process of analysis to cat, monkey, and human brain network data also, and found similar behavior in CB as a function of k given by the scaling law of equation (4) (Fig. 8, second and third rows; and Fig. 9, first row), and their exponents are found to be
  ,
,  , and
, and  , respectively. The scaling in the power-law behavior of CB indicates fractal behavior of the modules/sub-modules at various levels up to the motif level.
Figure 9.
Scaling in centrality parameters of the brain network of human species: (A) centrality measures of all modules and sub-modules at various levels of organization, (B) power-law fits on distribution of the centrality measures of each level, and (C) scaled centrality data of all modules and sub-modules into a single curve. First, second, and third rows of panels represent the characteristics of betweenness centrality, closeness centrality, and eigenvector centrality of the species, respectively.
Closeness centrality (CC) is another measure of centrality which describes how quickly an information from (by) a node can be propagated (received) to (from) the rest of the network, and can be characterized by the inverse of average distance between a given node with other nodes in the network41. The calculated CC of C. elegans as a function of degree k increases as k increases (Fig. 8, fourth row panel (A)) which indicates that the increase in CC with k exhibits shorter average path length (see equation (9) in Methods) meaning faster information processing of the node with the rest of the brain network. This means that larger hubs (larger k) are able to communicate with the rest of the nodes in the brain network of C. elegans faster than the nodes with smaller k, which is true for hubs in modules/sub-modules other than motif where every constituting nodes have same k. The data of modules and sub-modules at various levels obey the following power-law behavior:
 |
where the set {ηi; i = 1, 2, 3, 4} are closeness centrality exponents at various levels. The fitted curves with equation (5) on the data of modules and sub-modules at various levels of the network are approximately parallel (Fig. 8, fourth row panel (A)). The data of all modules/sub-modules at each level are fitted with equation (5) (Fig. 8, fourth row panel (B)), and it is found that the fitted lines are approximately parallel. The data from all levels are then scaled using one parameter scaling method to a single curve and the scaled data are fitted to a power law given by equation (5) (Fig. 8, fourth row panel (B)), and the exponent is found as η = 0.16; the existence of the power-law distribution has been statistically confirmed using techniques of Clauset et al.26 (see Table 1 and Methods). The same procedure has been used to analyze the data of brain networks of cat, monkey, and human species. The similar behavior in terms of scaling and structural properties are found in the three species, and their brain data follow the power-law behavior given by equation (5) with power-law exponent η = 0.28, η = 0.26, and η = 0.24, respectively. The results show the fractal behavior of closeness centrality which may connect the network topology of brain networks to brain functionality.
Eigenvector centrality (EC) is in favor of highly correlated nodes (which are usually high degree nodes) with rest of nodes in a network, and specific nodes which connect central nodes within the network relating to global network pattern42. EC is characterized by well-connectedness in a network43, a smooth enough function44, and is a good measure of spreading (receiving) power of information of nodes in (from) the network45. The calculated EC of the brain network of C. elegans (CE) for the network, modules, and sub-modules at various levels (see Methods) show increase in its values as degree k increases, obeying the following power law (for statistical techniques implemented in testing the existence of power-law distribution, see Methods; Table 1),
 |
where {δi; i = 1, 2, 3, 4} is the set of EC exponents at various levels. As found in betweenness and closeness centralities, the fitted lines on the data of C. elegans brain network, its modules, and sub-modules are nearly parallel with EC exponents in the range [0.5, 1.1]. Similarly, it is also found that as one goes towards higher levels, i.e. smaller module levels, CC also increases comparatively. All the data of modules/sub-modules at each level when fitted with equation (6) are found to be approximately parallel (Fig. 8, seventh row panel (B)). Data from all levels are then scaled in a single data set and fitted with equation (6) (Fig. 8, seventh row panel (C)); the exponent is found as δ ~ 0.72 (for statistical testing of power-law distribution, see Methods; Table 1).
Similar behavior is found in the brain networks of cat (Fig. 8, eighth row panels (A), (B), and (C)), monkey (Fig. 8, ninth row panels (A), (B), and (C)), and human (Fig. 9, third row panels (A), (B), and (C)) following the same scaling power law given by equation (6), and found the values of δ to be 0.71, 1.03, and 0.98, respectively.
Evidence of self-organization: local-community-paradigm (LCP) approach
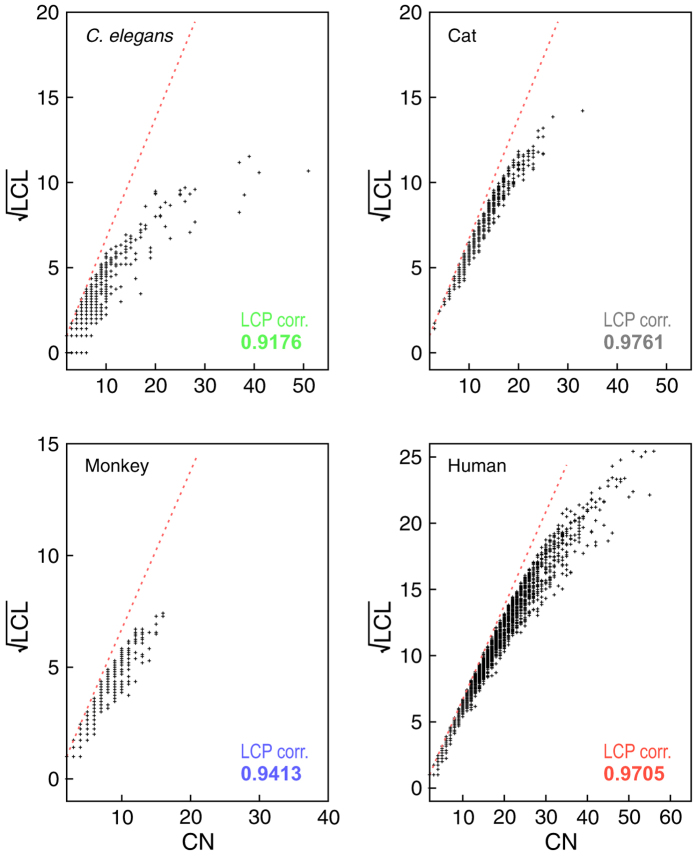
The LCP-decomposition-plot (LCP-DP; see Methods) for all four complete networks (C. elegans, cat, monkey, and human) are shown in Fig. 10, and the range of local-community sizes of these four networks are [1–52] (C. elegans), [1–34] (cat), [1–18] (monkey), and [1–57] (human). The results show that modules of C. elegans are more sparsely distributed as compared to others, but modules in human network are more compact. The calculated LCP-correlation (LCP-corr) values for all these species are large (>0.9; Fig. 11 upper panel) indicating strong LCP networks that are dynamics and heterogeneous, which facilitate network evolution and reorganization21. This indicates that these networks are organized with diverse modules/sub-modules at various levels of organization in hierarchical manner, which prohibits a central control in these networks with hub/hubs manipulations in these networks. The removal of hub/hubs from these networks do not cause breakdown of these networks due to strong self-organization in these networks.
Figure 10. LCP-DP plots of brain networks of the four species, namely, C. elegans, cat, monkey, and human.
The LCP-corr are also calculated for each network (given in each figure panels).
Figure 11.
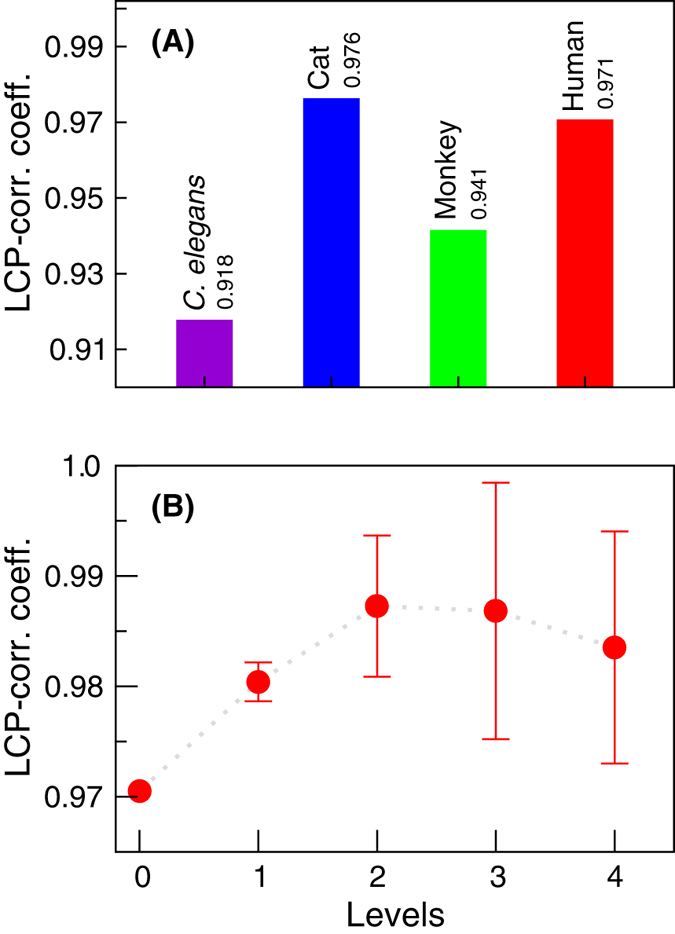
(A) LCP-corr calculated for brain networks of the four species, C. elegans, cat, monkey, and human. (B) Variation in the calculated average LCP-corr for human brain network as a function of network level.
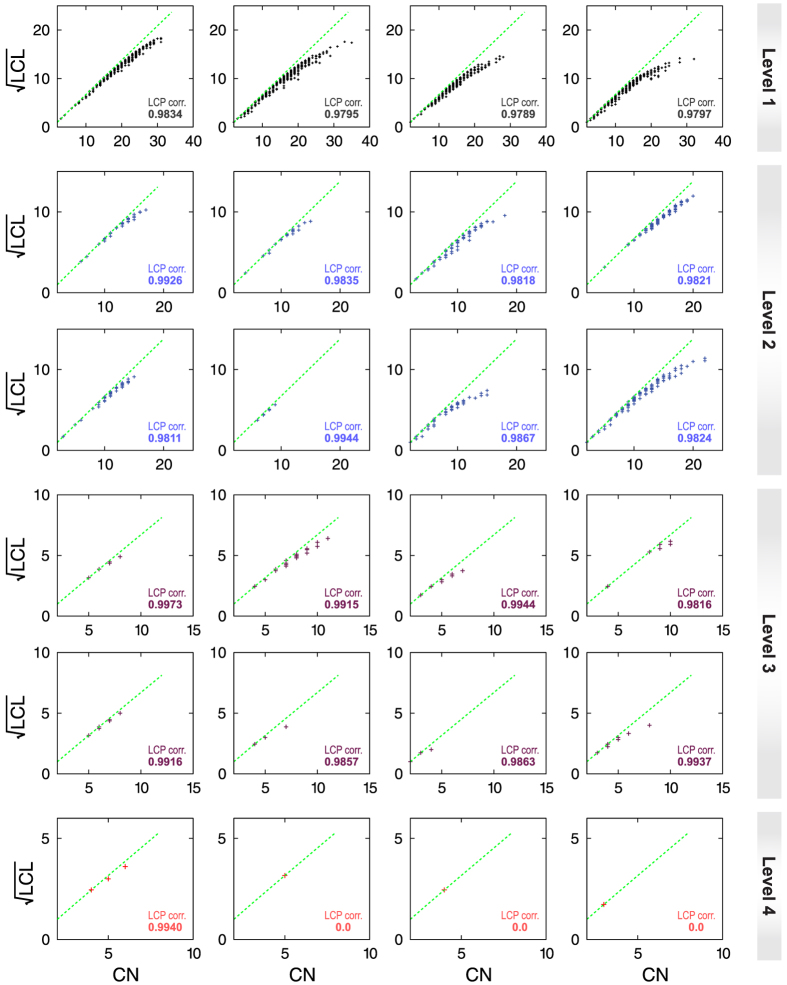
We then analyzed the human brain network to check the maintenance of this self-organization at various levels of network organization (Fig. 12) using LCP technique. The human brain network that we studied is organized in four different levels of organization (Fig. 12). The results show that even though the sizes of modules/sub-modules at different levels of organization are different (maximum local-community size is 35) and decreases as level of organization increases where some of the sub-modules at level-4 have single overlapped points, the points in the LCP-DP are not scattered showing compact constitution of the nodes in each module/sub-modules. We then calculated LCP-corr of all the modules/sub-modules at various levels (Fig. 12). The average values of LCP-corr at each level (modules having zero LCP-corr are not taken in average) are larger than the LCP-corr value of complete network and do not change within the error bar (Fig. 11 lower panel). This indicates the maintenance of self-organization of modules/sub-modules with better compactness and efficient information processing. The fractal and scaling nature of the brain networks could be as a consequence of self-organized behavior of these brain networks at various levels of organization.
Figure 12. LCP-DP plots of modules/sub-modules at various levels of organization in human brain network.
The LCP-corr are also calculated for each module/sub-module at various levels (given in each figure panels).
Discussion
The findings of our study suggest that the fundamental working principle of brain (in both lower and higher level species) is a system level topological self-organization. The fractal nature and scaling properties of these brain networks show self-similar organization of various topographical modules/sub-modules at every levels of constitution, which may relate to the functional brain organization, and energy cost in information transfer within and among the levels of organization is minimized. In addition, the few sparsely distributed hubs are tightly bound in their respective module and interfere functionalities of their own module, but could not influence rest of the modules at various levels in brain networks. In terms of inter-modular and intra-modular interaction edges, each brain network still show fractal nature which indicates systematic self-similar information processing at every levels and their interference. The decrease in the values of fractal dimension in going from C. elegans to human (lower to higher species) shows that the organization of brain networks (in terms of signal processing, topological characteristics, and modular organization) is more ordered and self-organized systematically in higher species. Such topological properties in brain networks allow efficient information processing, constitution of fractal laws in the organization, and controlled behavior of hubs in the global network properties.
The centrality measures (betweenness, closeness, and eigenvector centralities) of brain networks, its modules, and sub-modules show increase in their values with degree showing that hubs behave as most influencing nodes in the modules/sub-modules they are embedded. These hubs act as central in the local module/sub-module, and they become local quick information spreader and receiver in the network. However, removing one hub in such situation does not cause the network breakdown because of the system level organization of the network through modules and smaller modules which are compact with their own fundamental rules. The centrality data of the brain network, modules, and sub-modules at different levels can be scaled into a single power-law behavior showing fractal nature. This exhibited fractal nature in the brain network could be the consequence of the emergence of a few most influencing hubs in each module/sub-module at any level of the network except at the level of motif where all the nodes in it have equal degree. Therefore, in the brain network, modules, and smaller modules, most popular node/nodes always exist and they take maximum responsibility in regulating the network/module/sub-module. However, these hubs’ interference in the network is controlled (due to limited number of links to the modules/sub-modules) in such a way that they cannot control the other modules/sub-modules but can regulate them.
The scaling properties in brain networks reveal complicated self-organization of the network at various topological levels, and it could probably explain systematic organization of functional modules via weak interaction among them. This topographic organization may induce the origin of brain functionalities even at the absence of few hubs or modules. However, the properties of this static network do not fully explain the working principle of the complicated brain network, its dynamics, and functional relationships. The studies on dynamics and multi-scaled network approach may highlight further interesting insights on brain organization/reorganization.
Methods
Data sources
In this paper, the connection matrices of (1) C. elegans neuronal system, (2) 52 cortical areas in cat species, (3) 71 cortical areas in Macaque monkey species, and (4) 168 brain regions in human species are studied.
The C. elegans neuronal connectivity data set is adapted from Achacoso & Yamamoto46, the compilation of which is based on the work of White et al.47 in which the neuronal connection were traced with electron microscope reconstructions. Further modifications are the removal of 20 neurons in the pharyngeal nervous system which have no internal connection information46 and the additional removal of three other neurons (AIBL, AIYL, and SMDVL) considering their lack of spatial information48,49. Finally, 277 neurons sharing 2102 synaptic connections are considered for further topological analysis (data set available at http://www.biological-networks.org).
The cat connection matrix used in this study is derived from the original article by Scannell et al.50. In their paper, they collected information on the thalamo-cortico-cortical connections from many published studies, and applied the methods of non-metric multi-dimensional scaling, optimal set analysis, and non-parametric cluster analysis to derive the connection matrix of the 53 cortical areas and 42 thalamic nuclei. Their connection matrix is relatively weighted (0, 1, 2, and 3) according to the connection strength (absent/unreported, weak, intermediate, and strong, respectively) between each region. In this paper, only those connections among the 52 cortico-cortical areas are studied (after “Hipp” area is omitted)51. The relative weighting is discarded and only the presence or absence of connection is considered in the respective adjacency matrix. The resulting final matrix has 52 cortical areas and 820 cortico-cortical connections.
Collecting information from the neuroanatomical studies, Young52 applied the method of optimization analysis to map the cortico-cortical connections between 73 cortical areas of interest in the entire cerebral cortex of Macaque monkey. The connection matrix of Macaque monkey used in this paper is also based on the study of Young52, with a modification as mentioned in Sporns & Zwi51 in which two areas of interest (Hipp and Amyg) are removed resulting to a total of 71 cortical areas with 746 interconnections (data set available at https://sites.google.com/site/bctnet/datasets).
Finally, for the human brain, diffusion-weighted imaging (DWI) data for 89 subjects (age = 11–77 years) were obtained from the publicly available Enhanced Nathan Klein Institute Rockland Sample (NKI)53. All images were acquired using 3.0 T Siemens Magnetom TrioTim scanner. A MPRAGE sequence (TR = 1900 ms; TE = 2.52 ms; voxel size = 1 mm isotropic) was used to obtain T1-weighted images. A high spatial and angular resolution (TR = 2400 ms; TE = 85 ms; voxel size = 2 mm isotropic; b = 1500 s/mm2; 137 gradient directions) was used to collect DWI data. Detailed pre-processing steps for DWI data are given elsewhere54. Steps include: conversion of DWI data to 4D volumes, cleaning the data of motion and other artifacts using DTIPrep55, structural unwarping of the cleaned 4D diffusion volumes followed by linear registration of the average B0 to the T1 volume in stereotaxic space. Processing of the 4D diffusion volumes was done with FSL’s bedpostx. Probabilistic tractography was performed with FSL’s probtrackx package56 for the Cambridge brain parcellation57 resulting to connectivity matrices for each subject which were then averaged across the group to obtain a single 168 × 168 DWI connectivity matrix.
Graph construction and network parameters
The connection matrices (adjacency matrices) from the above-mentioned data sets are used to generate undirected graphs by using igraph R package58. For identifying communities in these graphs, the leading eigenvector spectral graph partitioning method (for which algorithm is available in igraph package) is implemented59. In this method, the modularity term is expressed in terms of eigenvalues and eigenvectors of a modularity matrix, and the partitioning is done using multiple leading eigenvectors that optimizes the modularity60. The communities are then grouped into each topological level. For each graph/subgraph we use the NetworkAnalyzer61,62 and CytoNCA63 plug-ins in Cytoscape for finding required network parameters such as degree, clustering coefficient, neighborhood connectivity, betweenness centrality, closeness centrality, and eigenvector centrality.
Degree distribution
The degree represents a centrality measure that indicates the number of communications a node maintains with other nodes in a graph. The degree distribution (P(k)) which is the probability that a randomly chosen node has a degree k represents an important parameter that helps us to identify whether a graph is random, scale free, hierarchical, etc.
 |
where nk represents the number of nodes with degree k and N is the total number of nodes in the graph.
Neighborhood connectivity
Neighborhood connectivity of a node i represents the average connectivities (average degrees) of the nearest neighbors of node i64.
Clustering co-efficient
Clustering co-efficient is a measure of how strongly a node’s neighborhoods are interconnected. Graph theoretically clustering coefficient is the ratio of the number of triangular motifs a node has with its nearest neighbor to the maximum possible number of such motifs. For an undirected graph, clustering coefficient (Ci) of the ith node can mathematically be expressed as
 |
where ei is the number of connected pairs of nearest-neighbor of the ith node, and ki is the degree of the ith node.
Centrality measurement
In addition, other important centrality measures include (1) closeness centrality, (2) betweenness centrality, and (3) eigenvector centrality. Centrality measures are helpful in identifying influential node(s) in a graph.
Closeness centrality
Closeness centrality (CC) of a node is the reciprocal of the mean geodesic distance between the node and all other nodes reachable from it41. Therefore, it represents how fast information is spread from the node to other nodes in the network. Thus, for a node i,
 |
where dij represents the geodesic path length from nodes i to j, and n is the total number of vertices in the graph reachable from node i.
Betweenness centrality
Betweenness centrality of a node is the measure of the extent to which the node has control over the communication of other nodes. Betweenness centrality (CB) of a node v is computed as follows65,66,67:
 |
where N is the set of nodes, s and t are nodes in the graph different from i, σst is the number of shortest path from s to t, and path through i in the case of σst(i). The betweenness centrality value is normalized by dividing with the number of node pairs (excluding node i).
Eigenvector centrality
Eigenvector centrality of a node i (vi) in a network is proportional to the sum of i’s neighbor centralities68, and it is given by
 |
where nn(i) indicates nearest neighbors of node i in the network. λ is the eigenvalue of the eigenvector vi given by
 |
where A is the adjacency matrix of the network. The principal eigenvector of matrix A, which corresponds to maximum eigenvalue λmax, is taken to have positive eigenvector centrality scores45.
Modularity
Finally, modularity is the measure of how well a network is divided in communities69. Modularity (Q) is express as follows:
 |
where m is the total number of edges in the community, Aij is the adjacency matrix of size i × j, k represents degrees, and the δ function yields 1 if nodes i and j are in the same community.
Statistical testing for power-law distribution
The statistical technique we used in our study to conclude the existence of a power-law distribution in an empirical data revolves around the method suggested by Clauset et al.26. The method has been used as an addition to the older least-squares linear regression technique. Clauset et al. techniques mainly involve two steps. First, estimating the lower bound (xmin) and exponent (α) of a fitted model. Second, perform the goodness-of-fit test of the empirical data against the fitted model.
In this technique, xmin is selected so as to minimize the Kolmogorov–Smirnov (KS) statics which can be defined as
 |
where P(x) is the cumulative distribution function (CDF) of the best-fit power-law model considering the data region x ≥ xmin and S(x) represents the empirical CDF.
The exponent α is then derived using the maximum likelihood method, and for the continuous empirical data the maximum likelihood estimator (MLE) can be expresses as
 |
where {xi: i = 1, …, N} represents the set of data points for which x ≥ xmin.
For the case discrete data points, MLE  is the solution of the equation
 |
where ζ(α, x) is the generalized zeta function, and ζ′ denotes the differentiation with respect to the first argument26.
Second, the theoretical power-law model that is generated from the empirical data are then subjected to KS goodness-of-fit test. For this, many synthetic data sets are generated on the basis of the fitted theoretical power-law parameters. The distance is then calculated between CDFs of the empirical and modeled data (say Dm), as well as between the synthetic and model data (say Ds). Finally, p-value is calculated considering the fraction of synthetic data for which Ds > Dm.
The existence of a power-law distribution in an empirical data could not be rejected if p-value is larger than 0.1. For example, if a total number of 2500 synthetic data samples are considered, the claim for the existence of a power-law distribution is plausible only when less than 250 samples satisfy Ds > Dm relation. We use the “poweRlaw” package70 and “plfit.r” script in R for our analysis (see also http://tuvalu.santafe.edu/aaronc/powerlaws/).
Scaling nature of topological parameters
The data of topological parameters (probability of degree distribution, clustering co-efficient, and neighborhood connectivity) and centrality parameters (betweenness, closeness, and eigenvector centralities) of the network, modules, and sub-modules at various levels (Figs 3 and 8) in log-log plot show approximately parallel power-law fit lines. We follow one parameter scaling theory27,28,29 to scale the data given by
 |
where F is a scaling function. For topological parameters Λ(k) = P(k), C(k), cn(k) and for centralities Λ(k) = CB(k), CC(k), CE(k) with corresponding ϕ values after fit. The calculated ξ after fitting each data of network/module/sub-module corresponds to the minimum path length of the network/module/sub-module approximately. This fitting procedure gives us F ≈ constant. Hence, we found the following scaling law:
 |
where ϕ = {−α, −β, −γ} for C(k), Cn(k), and P(k), respectively, and  for CB(k), CC(k), and CE(k), respectively.
Local-community-paradigm (LCP) approach
The LCP-decomposition-plot (LCP-DP) is one way of representation of topological properties of a network in two-dimensional parameter space of common neighbors (CN) index of interacting nodes and local community links (LCL) of each pair of interacting nodes in the network, and it provides information on number, size, and compactness of communities in a network, which can further be used as a measure of self-organization in the network21. The CN index between two nodes x and y can be calculated from the measure of overlapping between their sets of first-node-neighbors S(x) and S(y) given by,  . The possible likelihood of interaction of these two nodes could happen if there is significant amount of overlapping between the sets S(x) and S(y) (large value of CN), and therefore increase in CN reflects the increase in compactness in the network, which could indicate faster information processing in the network. Further, the LCLs between the two nodes x and y, whose upper bound is defined by,
  , is the number of internal links in local-community (LC), which is strongly inter-linked group of nodes. Then, these two nodes most probably link together if CN of these two nodes are members of LC21. LCP-DP has been studied on many types of networks and found to have a linear dependence between CN and
  . The LCs calculated using LCP approach approximately correspond to the modules/sub-modules at different levels in the network.
The LCP correlation (LCP-corr) is the Pearson correlation co-efficient of CN and LCL defined by  with CN > 1, where cov(CN, LCL) is the covariance between CN and LCL, σCN and σLCL are standard deviations of CN and LCL, respectively.
Additional Information
How to cite this article: Singh, S. S. et al. Scaling in topological properties of brain networks. Sci. Rep. 6, 24926; doi: 10.1038/srep24926 (2016).
Acknowledgments
We would like to thank the reviewers for their important comments and suggestions to make this work more novel. R.K.B.S. acknowledges DST-PURSE and CSIR, India under sanction no. Z5(0221)/13/EMR-II, for providing financial support. This research was enabled in part by support provided by Calcul Quebec (www.calculquebec.ca) and Compute Canada (www.computecanada.ca).
Footnotes
Author Contributions S.S.S. and R.K.B.S. conceived the model and did the numerical experiment. A.T.R., J.D.L. and A.C.E. contribute to the recent DWI human brain data. S.S.S. prepared the figures of the numerical results. S.S.S. and R.K.B.S. analyzed and interpreted the simulation results, and wrote the manuscript. S.S.S., R.K.B.S., B.K., B.I.S., A.T.R., J.D.L., A.C.E. and R.I. involved in the study and reviewed the manuscript.
References
- Meunier D., Lambiotte R. & Bullmore E. T. Modular and hierarchically modular organization of brain networks. Front. Neurosci. 4, 200 (2010). [DOI] [PMC free article] [PubMed] [Google Scholar]
- Bassett D. S. et al. Efficient physical embedding of topologically complex information processing networks in brains and computer circuits. PLos Comput. Biol. 6, e1000748 (2010). [DOI] [PMC free article] [PubMed] [Google Scholar]
- Tononi G., Sporns O. & Edelman G. M. A measure for brain complexity: relating functional segregation and integration in the nervous system. Proc. Natl. Acad. Sci. USA 91, 5033–5037 (1994). [DOI] [PMC free article] [PubMed] [Google Scholar]
- Bassett D. S. & Bullmore E. T. Small-world brain networks. Neuroscientist 12, 512–523 (2006). [DOI] [PubMed] [Google Scholar]
- Hayasaka. S. & Laurienti P. J. Comparison of Characteristics between Region and Voxel-Based Network Analyses in Resting-State fMRI Data. Neuroimage 50, 499–508 (2010). [DOI] [PMC free article] [PubMed] [Google Scholar]
- Sporns O. The human connectome: a complex network. Ann. N. Y. Acad. Sci. 1224, 109–125 (2011). [DOI] [PubMed] [Google Scholar]
- Uehara T. et al. Efficiency of a “small-world” brain network depends on consciousness level: a resting-state fMRI study. Cereb. Cortex 24, 1529–1539 (2014). [DOI] [PubMed] [Google Scholar]
- Achard S., Salvador R., Whitcher B., Suckling J. & Bullmore E. T. A resilient, low-frequency, small-world human brain functional network with highly connected association cortical hubs. J. Neurosci. 26, 63–72 (2006). [DOI] [PMC free article] [PubMed] [Google Scholar]
- Achard S. & Bullmore E. T. Efficiency and cost of economical brain functional networks. PLos Comput. Biol. 3, e17 (2007). [DOI] [PMC free article] [PubMed] [Google Scholar]
- He Y., Chen Z. J. & Evans A. C. Small-world anatomical networks in the human brain revealed by cortical thickness from MRI. Cereb. Cortex 17, 2407–2419 (2007). [DOI] [PubMed] [Google Scholar]
- Hagmann P. et al. Mapping human whole-brain structural networks with diffusion MRI. PLos One 2, e597 (2007). [DOI] [PMC free article] [PubMed] [Google Scholar]
- Fortunato S. Community detection in graphs. Phys. Rep. 486, 75–174 (2010). [Google Scholar]
- Gallos L. K., Makse H. A. & Sigman M. A small world of weak ties provides optimal global integration of self-similar modules in functional brain networks. Proc. Natl. Acad. Sci. USA 109, 2825–2830 (2012). [DOI] [PMC free article] [PubMed] [Google Scholar]
- Song C., Havlin S. & Makse H. A. Self-similarity of complex networks. Nature 433, 392–395 (2005). [DOI] [PubMed] [Google Scholar]
- Hilgetag C. C. & Hütt M. T. Hierarchical modular brain connectivity is a stretch for criticality. Trends Cogn. Sci. 18, 114–115 (2014). [DOI] [PubMed] [Google Scholar]
- Russo R., Herrmann H. J. & de Arcangelis L. Brain modularity controls the critical behavior of spontaneous activity. Sci. Rep. 4, 4312 (2014). [DOI] [PMC free article] [PubMed] [Google Scholar]
- Song C., Havlin S. & Makse H. A. Origins of fractality in the growth of complex networks. Nat. Phys. 2, 275–281 (2006). [Google Scholar]
- Rozenfeld H. D., Song C. & Makse H. A. Small-world to fractal transition in complex networks: a renormalization group approach. Phys. Rev. Lett. 104, 025701 (2010). [DOI] [PubMed] [Google Scholar]
- Barabási A.-L. & Albert R. Emergence of scaling in random networks. Science 286, 509–512 (1999). [DOI] [PubMed] [Google Scholar]
- Laurientia P. J., Joyceb K. E., Telesfordb Q. K., Burdettea J. H. & Hayasaka S. Universal fractal scaling of self-organized networks. Physica A 390, 3608–3613 (2011). [DOI] [PMC free article] [PubMed] [Google Scholar]
- Cannistraci C. V., Alanis-Lobato G. & Ravasi T. From link-prediction in brain connectomes and protein interactomes to the local-community-paradigm in complex networks. Sci. Rep. 3, 1613 (2013). [DOI] [PMC free article] [PubMed] [Google Scholar]
- Ravasz E., Somera A. L., Mongru D. A., Oltvai N. & Barabási A. L. Hierarchical organization of modularity in metabolic networks. Science 297, 1551–1555 (2002). [DOI] [PubMed] [Google Scholar]
- Ravasz E. & Barabási A. L. Hierarchical organization in complex networks. Phys. Rev. E 67, 026112 (2003). [DOI] [PubMed] [Google Scholar]
- Romualdo P. S., Vázquez A. & Vespignani A. Dynamical and correlation properties of the internet. Phys. Rev. Lett. 87, 258701 (2001). [DOI] [PubMed] [Google Scholar]
- Barabási A. L. & Oltvai Z. N. Network biology: understanding the cell’s functional organization. Nat. Rev. Genet. 5, 101–113 (2004). [DOI] [PubMed] [Google Scholar]
- Clauset A., Shalizi C. R. & Newman M. E. J. Power-law distributions in empirical data. SIAM Rev. Soc. Ind. Appl. Math. 51, 661–703 (2009). [Google Scholar]
- Abrahams E., Anderson P. W., Licciardello D. C. & Ramakrishnan T. V. Scaling theory of localization: absence of quantum diffusion in two dimensions. Phys. Rev. Lett. 42, 673 (1979). [Google Scholar]
- Pichard J. L. & Sarma G. Finite size scaling approach to Anderson localisation. J. Phys. C 14, L127–L132 (1981). [Google Scholar]
- MacKinnon A. & Kramer B. The scaling theory of electrons in disordered solids: additional numerical results. Z. Phys. B 53, 1–13 (1983). [Google Scholar]
- Corbit J. D. & Garbary D. J. Fractal dimension as a quantitative measure of complexity in plant development. Proc. R. Soc. Lond. B 262, 1–6 (1995). [Google Scholar]
- Seely A. J. E., Newman K. D. & Herry C. L. Fractal structure and entropy production within the central nervous system. Entropy 16, 4497–4520 (2014). [Google Scholar]
- Barthélemy M. Betweenness centrality in large complex networks. Eur. Phys. J. B 38, 163–168 (2004). [Google Scholar]
- Bergé C. Graphs and hypergraphs, 2nd ed. (North-Holland, Amsterdam, 1976). [Google Scholar]
- Clark J. & Holton D. A. A first look at graph theory (World Scientific, Teaneck, 1991). [Google Scholar]
- Maldonado-Chaparro A. A., Hubbard L. & Blumstein D. T. Group size affects social relationships in yellow-bellied marmots (Marmota flaviventris). Behav. Ecol., doi: 10.1093/beheco/arv034 (2015). [DOI] [Google Scholar]
- Brandes U., Borgatti A. P. & Freeman L. C. Maintaining the duality of closeness and betweenness centrality. Social Network 44, 153–159 (2016). [Google Scholar]
- Estrada E., Vargas-Estrada E. & Ando H. Communicability angle reveal critical edges for network consensus dynamics. Phys. Rev. E 92, 052809 (2015). [DOI] [PubMed] [Google Scholar]
- Sporns O., Honey C. J. & Kötter R. Identification and Classification of Hubs in Brain Networks. PLos One 2, e1049 (2007). [DOI] [PMC free article] [PubMed] [Google Scholar]
- Power J. D., Schlaggar B. L., Lessov-Schlaggar C. N. & Petersen S. E. Evidence for Hubs in Human Functional Brain Networks. Neuron 79, 798–813 (2013). [DOI] [PMC free article] [PubMed] [Google Scholar]
- Joyce K. E., Laurienti P. J., Burdette J. H. & Hayasaka S. A New Measure of Centrality for Brain Networks. PLos One 5, e12200 (2010). [DOI] [PMC free article] [PubMed] [Google Scholar]
- Newman M. E. J. Networks: an introduction. (Oxford University Press, Oxford, 2012). [Google Scholar]
- Lohmann G. et al. Eigenvector centrality mapping for analyzing connectivity patterns in fMRI data of the human brain. PLos One 5, e10232 (2010). [DOI] [PMC free article] [PubMed] [Google Scholar]
- Bonacich P. Factoring and weighting approaches to status scores and clique identification. J. Math. Sociol. 2, 113–120 (1972). [Google Scholar]
- Canright G. & Kenth E.-M. Roles in networks. Sci. Comput. Program. 53, 195–214 (2004). [Google Scholar]
- Canright G. & Kenth E.-M. Spreading on networks: a topographic view. Complexus 3, 131–146 (2006). [Google Scholar]
- Achacoso T. B. & Yamamoto W. S. AY’s neuroanatomy of C. elegans for computation (CRC Press, Boca Raton, 1991). [Google Scholar]
- White J. G., Southgate E., Thomson J. N. & Brenner S. The structure of the nervous system of the nematode Caenorhabditis elegans. Phil. Trans. R. Soc. Lond. B 314, 1–340 (1986). [DOI] [PubMed] [Google Scholar]
- Kaiser M. & Hilgetag C. C. Non-optimal component placement, but short processing paths, due to long-distance projections in neural systems. PLos Comput. Biol. 2, e95 (2006). [DOI] [PMC free article] [PubMed] [Google Scholar]
- Choe Y., McCormick B. H. & Koh W. Network connectivity analysis on the temporally augmented C. elegans web: a pilot study. Soc. Neurosci. Abstr. 30, 921.9 (2004). [Google Scholar]
- Scannell J. W., Burns G. A. P. C., Hilgetag C. C., O’Neil M. A. & Young M. P. The connectional organization of the cortico-thalamic system of the cat. Cereb. Cortex 9, 277–299 (1999). [DOI] [PubMed] [Google Scholar]
- Sporns O. & Zwi J. W. The small world of the cerebral cortex. Neuroinformatics 4, 145–162 (2004). [DOI] [PubMed] [Google Scholar]
- Young M. P. The organization of neural systems in the primate cerebral cortex. Proc. R. Soc. Lond. B 252, 13–18 (1993). [DOI] [PubMed] [Google Scholar]
- Nooner K. B. et al. The NKI-Rockland sample: a model for accelerating the pace of discovery science in psychiatry. Front. Neurosci. 6, 152 (2012). [DOI] [PMC free article] [PubMed] [Google Scholar]
- Reid A. T. et al. A cross-modal, cross-species comparison of connectivity measures in the primate brain. Neuroimage 125, 311–331 (2016). [DOI] [PubMed] [Google Scholar]
- Oguz I. et al. DTIPrep: quality control of diffusion-weighted images. Front. Neuroinform. 8, 4 (2014). [DOI] [PMC free article] [PubMed] [Google Scholar]
- Behrens T. E., Berg H. J., Jbabdi S., Rushworth M. F. S. & Woolrich M. W. Probabilistic diffusion tractography with multiple fibre orientations: what can we gain? Neuroimage 34, 144–155 (2007). [DOI] [PMC free article] [PubMed] [Google Scholar]
- Urchs S., Christian D., Yassine B. & Pierre B. Group multiscale functional template generated with BASC on the Cambridge sample. http://dx.doi.org/10.6084/m9.figshare.1285615 (2015).
- Csárdi G. & Nepusz T. The igraph software package for complex network research. InterJournal, Complex Systems 1695, 1–9 (2006). [Google Scholar]
- Newman M. E. J. Finding community structure using the eigenvectors of matrices. Phys. Rev. E 74, 036104 (2006). [DOI] [PubMed] [Google Scholar]
- Chen M., Kuzmin K. & Szymanski B. K. Community detection via maximization of modularity and its variants. IEEE Trans. Comput. Soc. Syst. 1, 46–65 (2014). [Google Scholar]
- Assenov Y., Ramírez F., Schelhorn S. E., Lengauer T. & Albrecht M. Computing topological parameters of biological networks. Bioinformatics 24, 282–284 (2008). [DOI] [PubMed] [Google Scholar]
- Doncheva N. T., Assenov Y., Domingues F. S. & Albrecht M. Topological analysis and interactive visualization of biological networks and protein structures. Nat. Protoc. 7, 670–685 (2012). [DOI] [PubMed] [Google Scholar]
- Tang Y., Li M., Wang J., Pan Y. & Wu F. X. CytoNCA: a cytoscape plugin for centrality analysis and evaluation of protein interaction networks. BioSystems 127, 67–72 (2015). [DOI] [PubMed] [Google Scholar]
- Maslov S. & Sneppen K. Specificity and stability in topology of protein networks. Science 296, 910–913 (2002). [DOI] [PubMed] [Google Scholar]
- Newman M. E. J. A measure of betweenness centrality based on random walks. Soc. Networks 27, 39–54 (2005). [Google Scholar]
- Brandes U. A faster algorithm for betweenness centrality. J. Math. Sociol. 25, 163–177 (2001). [Google Scholar]
- Mason O. & Verwoerd M. Graph theory and networks in biology. IET Syst. Biol. 1, 89–119 (2007). [DOI] [PubMed] [Google Scholar]
- Bonacich P. Power and centrality: a family of measures. Am. J. Sociol. 92, 1170–1182 (1987). [Google Scholar]
- Newman M. E. J. & Girvan M. Finding and evaluating community structure in networks. Phys. Rev. E 69, 026113 (2004). [DOI] [PubMed] [Google Scholar]
- Gillespie C. S. Fitting heavy tailed distributions: the poweRlaw package. J. Stat. Softw. 64, 1–16 (2015). [Google Scholar]


