

Abstract
Background
Vegetarian diets exclude all animal flesh and are being widely adopted by an increasing number of people; however, effects on blood lipid concentrations remain unclear. This meta‐analysis aimed to quantitatively assess the overall effects of vegetarian diets on blood lipids.
Methods and Results
We searched PubMed, Scopus, Embase, ISI Web of Knowledge, and the Cochrane Library through March 2015. Studies were included if they described the effectiveness of vegetarian diets on blood lipids (total cholesterol, low‐density lipoprotein cholesterol, high‐density lipoprotein cholesterol, and triglyceride). Weighted mean effect sizes were calculated for net changes by using a random‐effects model. We performed subgroup and univariate meta‐regression analyses to explore sources of heterogeneity. Eleven trials were included in the meta‐analysis. Vegetarian diets significantly lowered blood concentrations of total cholesterol, low‐density lipoprotein cholesterol, high‐density lipoprotein cholesterol, and non–high‐density lipoprotein cholesterol, and the pooled estimated changes were −0.36 mmol/L (95% CI −0.55 to −0.17; P<0.001), −0.34 mmol/L (95% CI −0.57 to −0.11; P<0.001), −0.10 mmol/L (95% CI −0.14 to −0.06; P<0.001), and −0.30 mmol/L (95% CI −0.50 to −0.10; P=0.04), respectively. Vegetarian diets did not significantly affect blood triglyceride concentrations, with a pooled estimated mean difference of 0.04 mmol/L (95% CI −0.05 to 0.13; P=0.40).
Conclusions
This systematic review and meta‐analysis provides evidence that vegetarian diets effectively lower blood concentrations of total cholesterol, low‐density lipoprotein cholesterol, high‐density lipoprotein cholesterol, and non–high‐density lipoprotein cholesterol. Such diets could be a useful nonpharmaceutical means of managing dyslipidemia, especially hypercholesterolemia.
Keywords: cholesterol, diet, lipoprotein lipids, triglyceride, vegetarian
Introduction
Dyslipidemia is a primary risk factor for the development of cardiovascular diseases, such as heart disease, stroke, and coronary artery disease.1, 2 Cardiovascular diseases and associated mortality are strongly related to elevated blood concentrations of total cholesterol (TC), low‐density lipoprotein cholesterol (LDL‐C), and triglyceride (TG).3, 4 Although lipid‐lowering drugs like statins and fibrates are effective in reducing TC, LDL‐C, and TG concentrations,5, 6, 7 major health organizations have maintained that modification of dietary and lifestyle patterns is the essential approach to prevention and management of dyslipidemia and cardiovascular diseases.8, 9
In recent years, adopting a vegetarian diet has become increasingly popular. Vegetarian diets exclude all animal flesh. Varieties of vegetarianism include vegan, raw vegan, ovovegetarian, lactovegetarian, lacto‐ovovegetarian, and pescovegetarian. Each type of vegetarianism excludes or includes certain foods.10 Compared with an omnivorous diet, a vegetarian diet is rich in fiber, magnesium, Fe3+, folic acid, vitamins C and E, omega‐6 polyunsaturated fatty acids, phytochemicals, and antioxidants but low in cholesterol; total fat and saturated fatty acids; sodium; Fe2+; zinc, vitamins A, B12, and D11; and especially omega‐3 polyunsaturated fatty acids. A recent meta‐analysis of 7 clinical trials and 32 observational studies showed that consumption of vegetarian diets was associated with lower blood pressure.12 An earlier meta‐analysis of 7 prospective studies that included 124 706 participants reported 29% lower mortality from ischemic heart disease (relative risk 0.71, 95% CI 0.56 to 0.87), 16% lower mortality from circulatory diseases (relative risk 0.84, 95% CI 0.54 to 1.14), and 12% lower mortality from cerebrovascular disease (relative risk 0.88, 95% CI 0.70 to 1.06) with vegetarian diets.13
Regarding the effects of vegetarian diets on blood lipid concentrations, several cross‐sectional studies showed that vegetarians have significantly lower concentrations of TC, LDL‐C, and TG compared with omnivores.14, 15 Nevertheless, data from randomized controlled trials (RCTs) evaluating the effects of vegetarian diets on blood lipid concentrations have generated mixed findings, especially regarding high‐density lipoprotein cholesterol (HDL‐C) and TG. Some trials16, 17 have indicated that vegetarian diets could lower HDL‐C and increase TG concentrations compared with omnivorous diets; however, no such effects were observed in other trials.18, 19 To the best of our knowledge, these results have not been systematically evaluated; therefore, we conducted a meta‐analysis of the published RCTs to comprehensively assess the overall effects of vegetarian diets on blood lipids (TC, LDL‐C, HDL‐C, and TG). The aim of the present study was to ascertain the extent to which a vegetarian diet alters blood lipids.
Methods
This systematic review and meta‐analysis followed the recommendations of the Preferred Reporting Items for Systematic Reviews and Meta‐Analysis (PRISMA) statement.20
Literature Search
Relevant articles were identified by searching PubMed, Scopus, Embase, ISI Web of Knowledge, and the Cochrane Library databases from their starting dates through March 2015. The structured search strategies used the following format of keywords: (vegetarian diet OR vegan diet OR vegetarianism OR vegetarian) AND (blood lipids OR total cholesterol OR low density lipoprotein cholesterol OR high density lipoprotein cholesterol OR cholesterol OR triglyceride OR triacylglycerol). Reference lists of original studies or reviews were also checked for additional publications. Because the present study is a systematic review and meta‐analysis, institutional review board approval was not required for this project.
Eligibility Criteria
Studies that met the PICOS criteria (participants, interventions, comparators, outcomes, study design) were included. “Participants” were studies conducted in adult humans aged ≥18 years. Interventions comprised a vegetarian diet (intervention diet) including vegan, omitting all animal products; ovovegetarian, omitting all animal products but eggs; lactovegetarian, omitting all animal products but dairy products; or lacto‐ovovegetarian, omitting all animal products but including eggs and dairy products. Comparators comprised an omnivorous diet (control diet) containing meats and dairy products and plant‐derived foods. Outcomes were baseline and end point values for blood lipids (TC, LDL‐C, HDL‐C, or TG) or their difference and the SD or SEM or 95% CI of each group. Study design comprised RCTs of either parallel or crossover design.
Study Selection
The title and abstract of each study identified in the search was screened to determine the study's eligibility for full review. The full‐text report was retrieved if the study investigated or potentially investigated the effects of vegetarian diets on blood lipid concentrations. Studies that compared vegan and ovo‐, lacto‐, or lacto‐ovovegetarian diets and studies that were cross‐sectional, cohort, case–control, animal test, nonoriginal research (reviews, editorials, or commentaries), unpublished, or duplicated were excluded. Only human studies published in English were included.
Data Extraction and Risk‐of‐Bias Assessment
Data extraction was conducted independently by 2 researchers, and any discrepancies were resolved by discussion. Study characteristics were extracted including author, publication year, country, study design, sample size, population information (sex, age, body mass index [BMI; calculated as weight in kilograms divided by height in square meters], health status, and lipid‐lowering medication use), dietary data (type of diet and duration of consumption), and outcome analysis. In each trial, the mean and SD of blood lipid concentrations at baseline and end point in both intervention and control groups were extracted. For studies that had multiple time points for the same participants, only the last end point was used for analysis. In crossover studies, it was recommended to extract paired t test data that evaluated the value of “measurement on intervention” minus “measurement on control” separately for each participant21; however, because these data were rarely provided, we resorted to using mean and SD separately for intervention and control. This step provided a conservative estimate of effect and reduced the power of crossover studies to show real effects of intervention.22 If SDs were not reported directly, we calculated them from SEM or 95% CI. Change‐from‐baseline SD was also estimated using the equation listed in the Cochrane Handbook.21 Extracted data were converted to international units. For TC, LDL‐C, and HDL‐C, 1 mg/dL was converted to 0.0259 mmol/L; for TG, 1 mg/dL was converted to 0.0113 mmol/L.
Risk of bias across studies was assessed using the Cochrane Collaboration's risk of bias tool,21 which rates 7 domains (random sequence generation, allocation concealment, blinding of participants and personnel, blinding of outcome assessment, incomplete outcome data, selective reporting and other threats to validity [eg, contamination of intervention and carryover effect in crossover trials]) as having low, high, or unclear risk of bias.
Data Synthesis and Statistical Analysis
A random‐effects model described by DerSimonian and Laird was used because it takes into account both within‐ and between‐study variability.23 Heterogeneity between studies was assessed by the Cochrane Q test and I2 statistic. An I2 value of 25%, 50%, and 75% represented low, moderate, and high degrees of heterogeneity, respectively. To explore sources of heterogeneity, subgroup and univariate meta–regression analyses were carried out focused on population information: continent (Oceania, Europe, or North America), age (<50 or ≥50 years), BMI (18.5 to 25, 25 to 30, or ≥30), health status (healthy or with high cardiovascular disease risk and lipid‐lowering medication use [some or none]), intervention type (lactovegetarian, lacto‐ovovegetarian, or vegan) and duration (<3 or ≥3 months), study design (parallel or crossover), outcome analysis (per protocol or intention to treat), and publication year (before 2000 or 2000 or later). To determine whether any single trial exerted undue influence on the overall results, sensitivity analysis was conducted in which each study was removed and the effect size recalculated. Furthermore, publication bias was assessed using Begg's rank correlation test and Egger's linear regression test. All statistical analyses were performed using Stata/SE 12.0 for windows (StataCorp). Except as otherwise specified, P<0.05 was considered significant.
Results
Results of the Study Selection
Detailed processes of study selection are shown in Figure 1. Our search strategy retrieved 2944 unique citations: 558 from PubMed, 811 from Scopus, 717 from Embase, 783 from ISI Web of Knowledge, 73 from the Cochrane Library, and 2 from hand searching the reference lists. Of these, 2891 citations were excluded after screening titles and abstracts, leaving 53 articles for full‐text review. After reviewing full text, 42 articles were excluded because they did not meet the study inclusion criteria (eg, studies without randomization, studies with nonrelated outcomes, articles from the same study, reviews, replies to comments). Ultimately, 11 studies were included in quantitative synthesis.16, 17, 18, 19, 24, 25, 26, 27, 28, 29, 30
Figure 1.
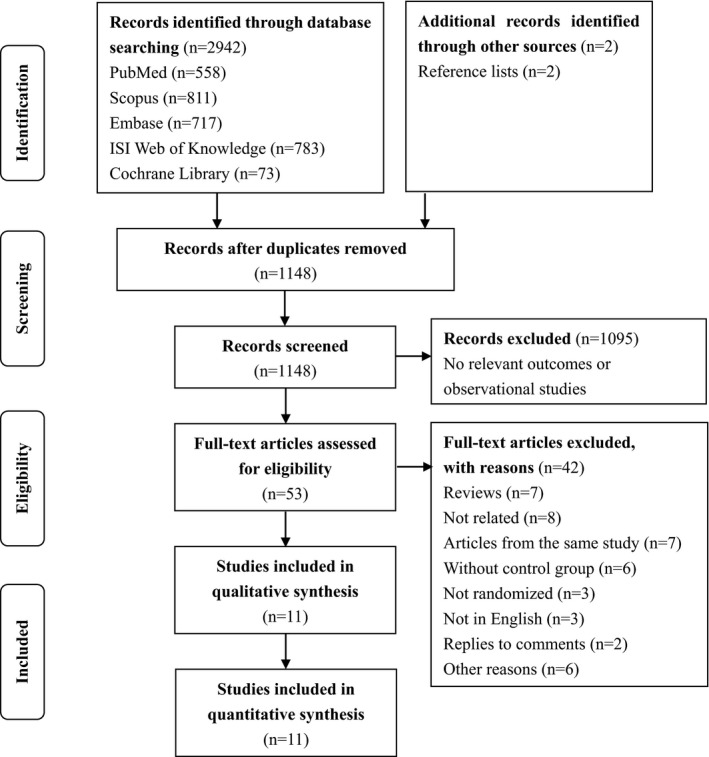
Flow diagram of selection of relevant articles.
Study Characteristics
Characteristics of the 11 selected studies are shown in Tables 1 and 2. Six studies were conducted in North America (all in the United States16, 17, 19, 24, 27, 28), 4 were conducted in Europe (2 in Finland18, 26 and 1 each in Sweden29 and the Czech Republic30), and 1 was conducted in Oceania (Australia25). The sample sizes ranged from 11 to 291, with a total of 832 participants. One study involved men only,25 1 study involved women only,16 and the other 9 studies included both men and women. Mean BMI of participants varied from 24.0 to 35.0, and mean age at baseline ranged from 28.0 to 56.2 years. Five trials were performed in participants with higher cardiovascular risk factors such as overweight17, 28 or type 2 diabetes.19, 27, 30 Several participants in 3 studies used lipid‐lowering medication.19, 27, 30 Among these 11 studies, 7 included a vegan diet,16, 17, 18, 19, 26, 27, 29 2 included a lacto‐ovovegetarian diet,25, 28 and 2 included a lactovegetarian diet.24, 30 The average duration of intervention was 24 weeks (ranging from 3 weeks to 18 months). Five trials lasted >3 months,17, 18, 19, 28, 29 whereas 2 trials lasted <1 month,24, 26 and the remaining trials fell in between. Seven studies adopted per‐protocol analysis,16, 18, 24, 25, 26, 27, 29 and 4 used intention‐to‐treat analysis.17, 19, 28, 30 Eight trials used a parallel design,17, 18, 19, 26, 27, 28, 29, 30 and the other 3 trials used a crossover design.16, 24, 25
Table 1.
Characteristics of Studies Included in the Meta‐Analysis: Participants, Interventions, and Comparators
| Study | Country | No. (F/M) | Mean BMI, kg/m2 | Mean Age, Year | Healthy Status | Lipid‐Lowering Medication (E/C) | Intervention | Controla |
|---|---|---|---|---|---|---|---|---|
| Cooper et al, 198224 | US | 15 (5/10) | NR | 28.0 | Healthy subjects | None | Lactovegetarian | Omnivorous |
| Kestin et al, 198925 | Australia | 26 (0/26) | 25.5 | 44.0 | NR | None | Lacto‐ovovegetarian | Omnivorous |
| Ling et al, 199226 | Finland | 18 (14/4) | 26.6 | 42.8 | Healthy participants and patients for unrelated conditions | NR | Vegan | Omnivorous |
| Nicholson et al, 199927 | US | 11 (5/6) | NR | 54.3 | With NIDDM | 4 (3/1) | Vegan | Omnivorous |
| Barnard et al, 200016 | US | 35 (35/0) | 25.5 | 36.1 | Healthy premenopausal women | None | Vegan | Omnivorous |
| Agren et al, 200118 | Finland | 29 (28/1) | 24.3 | 50.8 | With rheumatoid arthritis | None | Vegan | Omnivorous |
| Burke et al, 200728 | US | 176 (153/23) | 34.0 | 44.0 | Overweight and obese adults | None | Lacto‐ovovegetarian | Omnivorous |
| Elkan et al, 200829 | Sweden | 58 (52/6) | 24.0 | 50.3 | With rheumatoid arthritis | None | Vegan | Omnivorous |
| Barnard et al, 200919 | US | 99 (60/39) | 34.9 | 55.6 | With type 2 diabetes | 54 (27/27) | Vegan | Omnivorous |
| Kahleova et al, 201130 | Czech | 74 (39/35) | 35.0 | 56.2 | With type 2 diabetes | 38 (22/16) | Lactovegetarian | Omnivorous |
| Mishra et al, 201317 | US | 291 (241/50) | 35.0 | 45.2 | With BMI ≥25 and/or a previous diagnosis of type 2 diabetes | NR | Vegan | Omnivorous |
BMI indicates body mass index; E/C, experiment diet group/control diet group; F, female; M, male; NR, not reported.
All control diets adopted in these studies were defined as an omnivorous diet because they contained meat and dairy products and plant‐derived foods.
Table 2.
Characteristics of Studies Included in the Meta‐Analysis: Outcomes and Study Design
| Study | Baseline TC, mmol/L (E/C) | Baseline LDL‐C, mmol/L (E/C) | Baseline HDL‐C, mmol/L (E/C) | Baseline TG, mmol/L (E/C) | Duration | Outcome Analysis | Design |
|---|---|---|---|---|---|---|---|
| Cooper et al, 198224 | 4.1 | — | — | 0.7 | 3 weeks | PP | CO |
| Kestin et al, 198925 | 6.1 | 4.1 | 1.5 | 1.3 | 6 weeks | PP | CO |
| Ling et al, 199226 | (5.6/5.5) | (3.7/3.6) | (1.3/1.3) | (1.3/1.0) | 4 weeks | PP | PL |
| Nicholson et al, 199927 | (5.3/5.6) | — | (1.2/1.1) | (2.1/2.3) | 12 weeks | PP | PL |
| Barnard et al, 200016 | 4.2 | 2.5 | 1.3 | 0.9 | 2 months | PP | CO |
| Agren et al, 200118 | (4.6/5.2) | (3.0/3.5) | (1.2/1.2) | (1.0/1.0) | 3 months | PP | PL |
| Burke et al, 200728 | (5.3/5.3) | — | — | (1.5/1.5) | 18 months | ITT | PL |
| Elkan et al, 200829 | — | — | (1.4/1.3) | (1.1/1.1) | 12 months | PP | PL |
| Barnard et al, 200919 | (4.8/5.2) | (2.7/3.0) | (1.4/1.3) | (1.7/1.8) | 74 weeks | ITT | PL |
| Kahleova et al, 201130 | (4.4/4.2) | (2.5/2.6) | (1.1/1.1) | (2.1/2.1) | 12 weeks | ITT | PL |
| Mishra et al, 201317 | (4.8/4.9) | (2.8/2.8) | (1.4/1.5) | (1.4/1.4) | 18 weeks | ITT | PL |
CO indicates crossover; E/C, experiment diet group/control diet group; HDL‐C, high‐density lipoprotein cholesterol; ITT, intention to treat; LDL‐C, low‐density lipoprotein cholesterol; PL, parallel; PP, per protocol; TC, total cholesterol; TG, triglyceride.
Risk of Bias
All studies stated that participants were randomly assigned, but only 5 studies specified the randomization process, such as using a computer‐generated random number list,16 a random number table,17, 19 or a minimization procedure.28, 29 None of the 11 studies mentioned allocation concealment, and none of the participants in any of the trials were blinded. Blinding of outcome assessment was not mentioned in any of the studies. Only 4 studies were analyzed on an intention‐to‐treat basis.17, 19, 28, 30 In 3 studies, not all of the concentrations listed in the methods were reported.24, 27, 28 Carryover effect in the 3 crossover trials may introduce bias, although this was not mentioned16, 24, 25 (Table S1).
Effects of Vegetarian Diets on Blood Lipid Concentrations
A total of 10 studies reported data on TC concentrations. Vegetarian diets significantly affect TC concentrations, and the pooled estimated change in TC concentrations was −0.36 mmol/L (95% CI −0.55 to −0.17; P<0.001) (Figure 2). Moderate to high heterogeneity was detected (I2=53.5%). Seven studies reported data on LDL‐C concentrations. Vegetarian diets caused significant reduction in LDL‐C concentrations, and the pooled estimated effect was −0.34 mmol/L (95% CI −0.57 to −0.11; P<0.001) (Figure 2). High heterogeneity was found (I2=72.4%). Nine studies reported results on HDL‐C concentrations. Vegetarian diets also lowered HDL‐C concentrations, and the pooled estimated mean difference was −0.10 mmol/L (95% CI −0.14 to −0.06; P<0.001) (Figure 3). No heterogeneity was shown for HDL‐C (I2=0%). The mean change in TG concentrations was calculated in 11 trials. Vegetarian diets did not cause a significant change in TG concentration, and the pooled estimated effect was 0.04 mmol/L (95% CI −0.05 to 0.13; P=0.40) (Figure 3). Low heterogeneity was observed (I2=19.9%). Because non–HDL‐C (the difference between TC and HDL‐C) was also an important target for cardiovascular disease risk set by the Canadian Cardiovascular Society in 2012,31 it was calculated from 8 studies, and a meta‐analysis of the effect of vegetarian diets was performed. Vegetarian diets significantly decreased non–HDL‐C concentrations by −0.30 mmol/L (95% CI −0.50 to −0.10; P=0.04) (Figure 4). Moderate to high heterogeneity was found (I2=54.8%).
Figure 2.
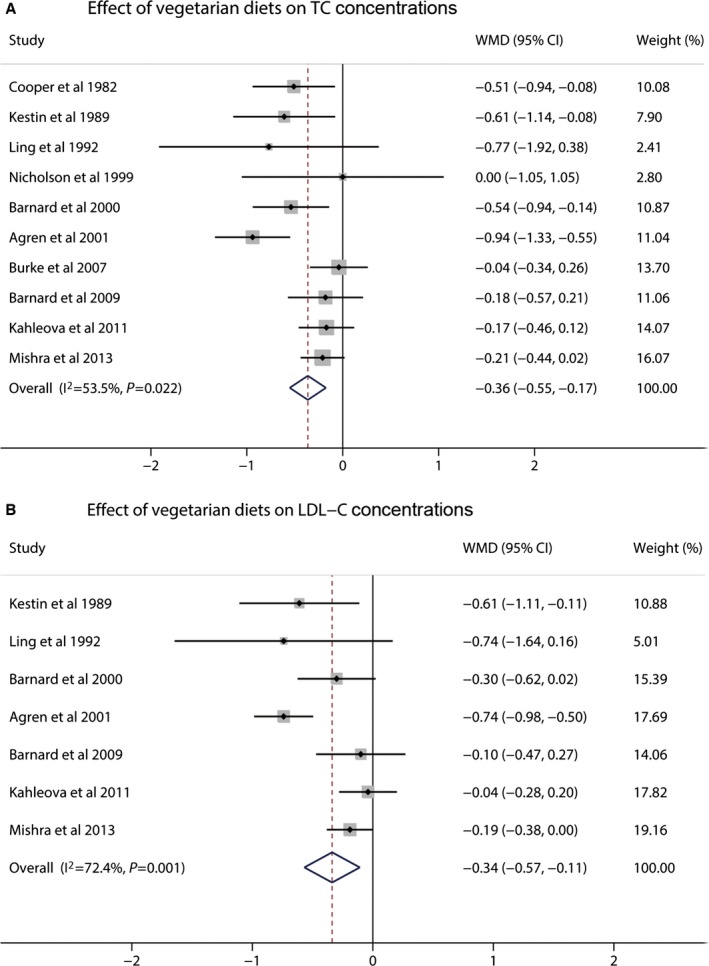
Effects of vegetarian diets on (A) TC and (B) LDL‐C concentrations. The meta‐analysis used the WMD in the random‐effects model. Horizontal lines denote 95% CI. A diamond represents the overall estimated effect. LDL‐C indicates low‐density lipoprotein cholesterol; TC, total cholesterol; WMD, weighted mean difference.
Figure 3.
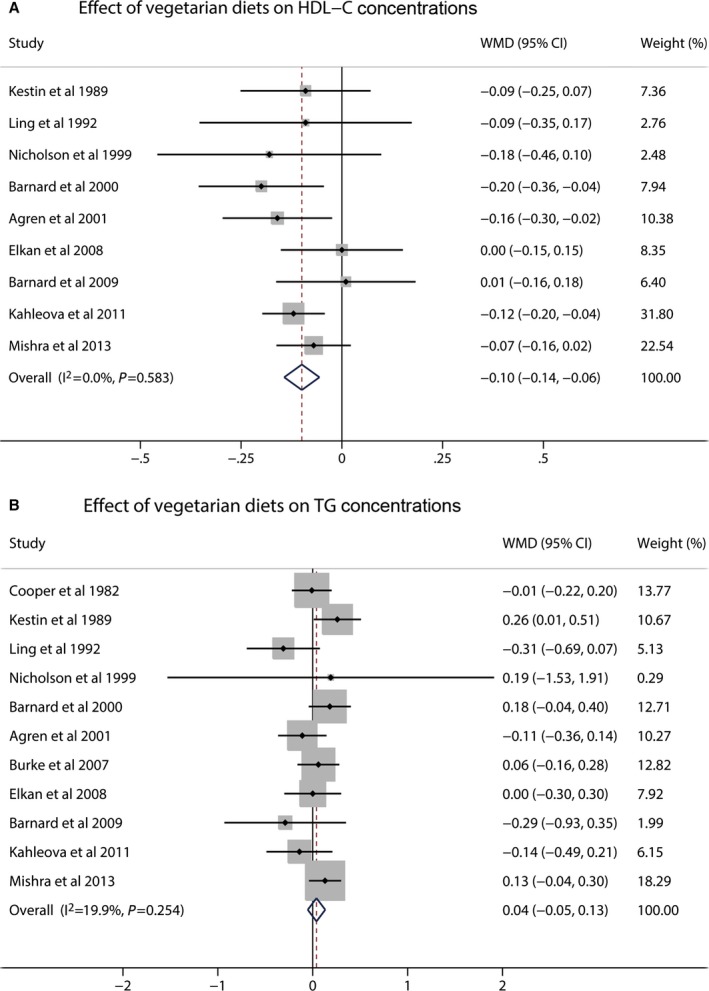
Effects of vegetarian diets on (A) HDL‐C and (B) TG concentrations. The meta‐analysis used the WMD in the random‐effects model. Horizontal lines denote 95% CI. A diamond represents the overall estimated effect. HDL‐C indicates high‐density lipoprotein cholesterol; TG, triglyceride; WMD, weighted mean difference.
Figure 4.
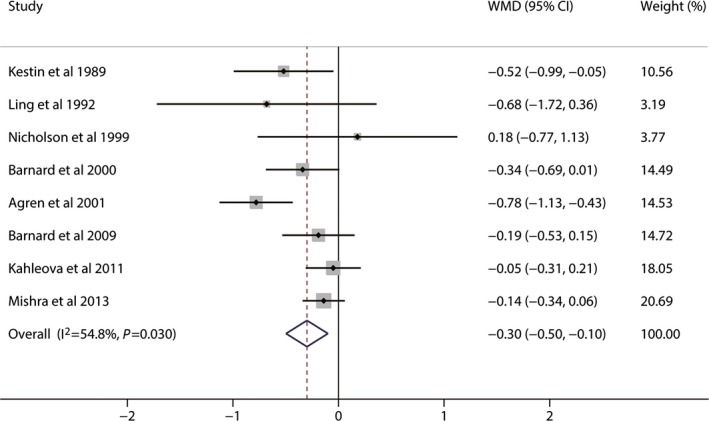
Effects of vegetarian diets on non–high‐density lipoprotein cholesterol concentrations. The meta‐analysis used the WMD in the random‐effects model. Horizontal lines denote 95% CI. A diamond represents the overall estimated effect. WMD, weighted mean difference.
Subgroup and Meta–Regression Analyses
Subgroup analyses showed that the effect of vegetarian diets on lowering TC concentrations was greater in participants with BMI ranging from 18.5 to 25 (−0.94 mmol/L, 95% CI −1.33 to −0.55) and from 25 to 30 (−0.58 mmol/L, 95% CI −0.89 to −0.27) rather than those >30 (−0.16 mmol/L, 95% CI −0.30, −0.01) (Table 3). A greater lowering effect on TC concentrations was observed in trials analyzed on a per‐protocol basis (−0.64 mmol/L, 95% CI −0.85 to −0.43) compared with an intention‐to‐treat basis (−0.16 mmol/L, 95% CI −0.30 to −0.01) (Table 3). Similarly, a greater reduction in LDL‐C concentrations was observed in trials conducted in participants with BMI ranging from 18.5 to 25 and from 25 to 30 or analyzed on a per‐protocol basis (Table 3). Meta‐regressions for BMI (meta‐regression P=0.01 in TC analysis and P=0.02 in LDL‐C analysis) and outcome analysis (meta‐regression P=0.01 in TC analysis and P=0.02 in LDL‐C analysis) were significant, suggesting that these 2 factors may be substantial sources of heterogeneity present in TC and LDL‐C analyses.
Table 3.
Subgroup and Meta‐Regression Analyses for TC and LDL‐C Concentrations
| Subgroup Factors | TC | LDL‐C | ||||||||
|---|---|---|---|---|---|---|---|---|---|---|
| No. of Trials | Pooled Effect (95% CI) mmol/L | I2 (%) | P Valuea | P Valueb | No. of Trials | Pooled Effect (95% CI) mmol/L | I2 (%) | P Valuea | P Valueb | |
| Overall analyses | 10 | −0.36 (−0.55 to −0.17) | 53.5 | 0.02 | 7 | −0.34 (−0.57 to −0.11) | 72.4 | <0.001 | ||
| Overall analysesc | 10 | −0.32 (−0.43 to −0.20) | 53.5 | 0.02 | 7 | −0.30 (−0.41 to −0.19) | 72.4 | <0.001 | ||
| Continent | 0.24 | 0.39 | ||||||||
| Oceania | 1 | −0.61 (−1.14 to −0.08) | — | — | 1 | −0.61 (−1.11 to −0.11) | — | — | ||
| Europe | 3 | −0.58 (−1.20 to 0.04) | 79.8 | 0.01 | 3 | −0.46 (−1.04 to 0.11) | 87.9 | <0.001 | ||
| North America | 6 | −0.25 (−0.40 to −0.09) | 13.0 | 0.33 | 3 | −0.20 (−0.35 to −0.05) | 0.0 | 0.72 | ||
| Age, y | 0.96 | 0.79 | ||||||||
| <50 | 6 | −0.33 (−0.53 to −0.13) | 35.1 | 0.17 | 4 | −0.30 (−0.48 to −0.11) | 15.1 | 0.32 | ||
| ≥50 | 4 | −0.37 (−0.80 to 0.05) | 73.5 | 0.01 | 3 | −0.30 (−0.78 to 0.18) | 88.8 | <0.001 | ||
| BMI, kg/m2 | 0.01 | 0.01 | ||||||||
| 18.5 to 25 | 1 | −0.94 (−1.33 to −0.55) | — | — | 1 | −0.74 (−0.68 to −0.16) | — | — | ||
| 25 to 30 | 3 | −0.58 (−0.89 to −0.27) | 0 | 0.92 | 3 | −0.42 (−0.68 to −0.16) | 0 | 0.46 | ||
| ≥30 | 4 | −0.16 (−0.30 to −0.01) | 0 | 0.85 | 3 | −0.13 (−0.27 to 0.01) | 0 | 0.62 | ||
| Health status | 0.08 | 0.44 | ||||||||
| Healthy | 2 | −0.53 (−0.82 to −0.23) | 0 | 0.92 | 1 | −0.30 (−0.62 to 0.02) | — | — | ||
| High CVD risk | 5 | −0.15 (−0.30 to −0.01) | 0 | 0.93 | 3 | −0.13 (−0.27 to 0.01) | 0.0 | 0.62 | ||
| Lipid‐lowering medication | 0.20 | 0.19 | ||||||||
| Some | 3 | −0.17 (−0.39 to 0.06) | 0 | 0.95 | 2 | −0.06 (−0.26 to 0.14) | 0 | 0.79 | ||
| None | 5 | −0.51 (−0.84 to −0.18) | 70.9 | 0.01 | 2 | −0.40 (−0.68 to −0.11) | 4.6 | 0.31 | ||
| Intervention | 0.59 | 0.23 | ||||||||
| Lactovegetarian | 2 | −0.30 (−0.63 to 0.02) | 39.6 | 0.20 | 1 | −0.04 (−0.28 to 0.20) | — | — | ||
| Lacto‐ovovegetarian | 2 | −0.28 (−0.83 to 0.27) | 70.1 | 0.07 | 1 | −0.61 (−1.11 to −0.11) | — | — | ||
| Vegan | 6 | −0.44 (−0.73 to −0.14) | 60.1 | 0.03 | 5 | −0.37 (−0.65 to −0.09) | 73.3 | 0.01 | ||
| Duration, months | 0.64 | 0.92 | ||||||||
| <3 | 6 | −0.38 (−0.57 to −0.19) | 0 | 0.46 | 4 | −0.30 (−0.59 to −0.01) | 50.2 | 0.11 | ||
| ≥3 | 4 | −0.33 (−0.67 to 0.02) | 78.5 | 0.003 | 3 | −0.35 (−075 to 0.05) | 85.9 | 0.001 | ||
| Design | 0.26 | 0.68 | ||||||||
| Crossover | 3 | −0.55 (−0.80 to −0.29) | 0 | 0.96 | 2 | −0.40 (−0.68 to −0.11) | 4.6 | 0.31 | ||
| Parallel | 7 | −0.29 (−0.53 to −0.05) | 60.8 | 0.02 | 5 | −0.31 (−0.61 to −0.01) | 80.1 | <0.001 | ||
| Analysis | 0.01 | 0.02 | ||||||||
| PP | 6 | −0.64 (−0.85 to −0.43) | 0 | 0.50 | 4 | −0.57 (−0.82 to −0.33) | 35.3 | 0.20 | ||
| ITT | 4 | −0.16 (−0.30 to −0.01) | 0 | 0.85 | 3 | −0.13 (−0.27 to 0.01) | 0 | 0.62 | ||
| Publication year | 0.45 | 0.29 | ||||||||
| Before 2000 | 4 | −0.52 (−0.83 to −0.21) | 0 | 0.74 | 2 | −0.64 (−1.08 to −0.20) | 0 | 0.80 | ||
| 2000 or later | 6 | −0.32 (−0.56 to −0.09) | 69.0 | 0.01 | 5 | −0.28 (−0.54 to −0.02) | 79.1 | <0.001 | ||
BMI indicates body mass index; CVD, cardiovascular disease; ITT, intention to treat; LDL‐C, low‐density lipoprotein cholesterol; PP, per protocol; TC, total cholesterol.
P for heterogeneity
P for meta–regression analysis.
Results from fixed‐effect analysis.
Subgroup and meta–regression analyses did not show any statistically significant differences in the effect of vegetarian diets on HDL‐C and TG concentrations between subgroups stratified by population information (continent, age, BMI, health status, and lipid‐lowering medication use), intervention information (type and duration), study design, outcome analysis, and publication year (Table 4). For non–HDL‐C, subgroup and meta–regression analyses indicated that reduction was greater in trials conducted in participants with lower BMI or analyzed on a per‐protocol analysis, which could partly explain the heterogeneity, as for TC and LDL‐C (Table 5).
Table 4.
Subgroup and Meta–Regression Analyses for HDL‐C and TG Concentrations
| Subgroup Factors | HDL‐C | TG | ||||||||
|---|---|---|---|---|---|---|---|---|---|---|
| No. of Trials | Pooled Effect (95% CI) mmol/L | I2 (%) | P Valuea | P Valueb | No. of Trials | Pooled Effect (95% CI) mmol/L | I2 (%) | P Valuea | P Valueb | |
| Overall analyses | 9 | −0.10 (−0.14 to −0.06) | 0 | 0.58 | 11 | 0.04 (−0.05 to 0.13) | 19.9 | 0.25 | ||
| Overall analysesc | 9 | −0.10 (−0.14 to −0.06) | 0 | 0.58 | 11 | 0.05 (−0.03 to 0.13) | 19.9 | 0.25 | ||
| Continent | 0.72 | 0.09 | ||||||||
| Oceania | 1 | −0.09 (−0.25 to 0.07) | — | — | 1 | 0.26 (0.01 to 0.51) | — | — | ||
| Europe | 4 | −0.11 (−0.17 to −0.05) | 0 | 0.45 | 4 | −0.12 (−0.27 to 0.04) | 0 | 0.67 | ||
| North America | 4 | −0.09 (−0.18 to −0.01) | 21.0 | 0.28 | 6 | 0.08 (−0.01 to 0.18) | 0 | 0.68 | ||
| Age, y | 0.97 | 0.08 | ||||||||
| <50 | 4 | −0.10 (−0.17 to −0.03) | 0 | 0.57 | 6 | 0.09 (−0.03 to 0.20) | 35.4 | 0.17 | ||
| ≥50 | 5 | −0.10 (−0.16 to −0.03) | 12.1 | 0.34 | 5 | −0.09 (−0.26 to 0.07) | 0 | 0.92 | ||
| BMI, kg/m2 | 0.82 | 0.72 | ||||||||
| 18.5 to 25 | 2 | −0.08 (−0.24 to 0.07) | 57.9 | 0.12 | 2 | −0.06 (−0.26 to 0.13) | 0 | 0.58 | ||
| 25 to 30 | 3 | −0.14 (−0.24 to −0.04) | 0 | 0.58 | 3 | 0.08 (−0.20 to 0.36) | 68.1 | 0.04 | ||
| ≥30 | 3 | −0.09 (−0.14 to −0.03) | 1.6 | 0.36 | 4 | 0.06 (−0.07 to 0.18) | 2.6 | 0.38 | ||
| Health status | 0.29 | 0.33 | ||||||||
| Healthy | 1 | −0.20 (−0.36 to −0.04) | — | — | 2 | 0.08 (−0.10 to 0.27) | 33.0 | 0.22 | ||
| High CVD risk | 4 | −0.09 (−0.15 to −0.04) | 0 | 0.49 | 5 | 0.06 (−0.06 to 0.18) | 0 | 0.54 | ||
| Lipid‐lowering medication | 0.99 | 0.20 | ||||||||
| Some | 3 | −0.10 (−0.18 to −0.03) | 5.6 | 0.35 | 3 | −0.16 (−0.46 to 0.14) | 0 | 0.85 | ||
| None | 3 | −0.10 (−0.21 to 0.02) | 38.9 | 0.20 | 6 | 0.07 (−0.04 to 0.17) | 15.0 | 0.32 | ||
| Intervention | 0.76 | 0.85 | ||||||||
| Lactovegetarian | 1 | −0.12 (−0.20 to −0.04) | — | — | 2 | −0.04 (−0.22 to 0.13) | 0 | 0.53 | ||
| Lacto‐ovovegetarian | 1 | −0.09 (−0.25 to 0.07) | — | — | 2 | 0.15 (−0.04 to 0.35) | 28.2 | 0.24 | ||
| Vegan | 7 | −0.09 (−0.15 to −0.03) | 2.8 | 0.40 | 7 | 0.02 (−0.12 to 0.15) | 27.2 | 0.22 | ||
| Duration, months | 0.20 | 0.81 | ||||||||
| <3 | 5 | −0.13 (−0.19 to −0.07) | 0 | 0.86 | 6 | 0.04 (−0.13 to 0.21) | 43.7 | 0.11 | ||
| ≥3 | 4 | −0.07 (−0.13 to 0.00) | 9.6 | 0.34 | 5 | 0.04 (−0.07 to 0.15) | 0 | 0.47 | ||
| Design | 0.39 | 0.17 | ||||||||
| Parallel | 7 | −0.09 (−0.14 to −0.04) | 0 | 0.57 | 8 | 0.00 (−0.10 to 0.10) | 3.0 | 0.41 | ||
| Crossover | 2 | −0.15 (−0.26 to −0.04) | 0 | 0.34 | 3 | 0.13 (−0.03 to 0.29) | 32.4 | 0.23 | ||
| Analysis | 0.54 | 0.99 | ||||||||
| PP | 6 | −0.12 (−0.19 to −0.05) | 0 | 0.53 | 7 | 0.03 (−0.10 to 0.17) | 35.9 | 0.15 | ||
| ITT | 3 | −0.09 (−0.14 to −0.03) | 1.6 | 0.36 | 4 | 0.06 (−0.07 to 0.18) | 2.6 | 0.38 | ||
| Publication year | 0.89 | 0.98 | ||||||||
| Before 2000 | 3 | −0.11 (−0.23 to 0.02) | 0 | 0.85 | 4 | 0.02 (−0.24 to 0.27) | 53.3 | 0.09 | ||
| 2000 or later | 6 | −0.10 (−0.15 to −0.04) | 19.7 | 0.28 | 7 | 0.05 (−0.04 to 0.15) | 0.7 | 0.42 | ||
BMI indicates body mass index; CVD, cardiovascular disease; HDL‐C, high‐density lipoprotein cholesterol; ITT, intention to treat; PP, per protocol; TG, triglyceride.
P for heterogeneity.
P for meta–regression analysis.
Results from fixed‐effect analysis.
Table 5.
Subgroup and Meta–Regression Analyses for Non–HDL‐C Concentrations
| Subgroup Factors | Non‐HDL‐C | ||||
|---|---|---|---|---|---|
| No. of Trials | Pooled Effect (95% CI) mmol/L | I2 (%) | P Valuea | P Valueb | |
| Overall analyses | 8 | −0.30 (−0.50 to −0.10) | 54.8 | 0.03 | |
| Overall analysesc | 8 | −0.25 (−0.37 to −0.13) | 54.8 | 0.03 | |
| Continent | 0.35 | ||||
| Oceania | 1 | −0.52 (−0.99 to −0.05) | — | — | |
| Europe | 3 | −0.46 (−1.05 to 0.14) | 82.4 | 0.003 | |
| North America | 4 | −0.18 (−0.33 to −0.03) | 0 | 0.68 | |
| Age, y | 0.83 | ||||
| <50 | 4 | −0.26 (−0.44 to −0.08) | 9.8 | 0.34 | |
| ≥50 | 4 | −0.27 (−0.66 to 0.12) | 75.3 | 0.01 | |
| BMI, kg/m2 | 0.01 | ||||
| 18.5 to 25 | 1 | −0.78 (−1.13 to −0.43) | — | — | |
| 25 to 30 | 3 | −0.42 (−0.69 to −0.15) | 0 | 0.74 | |
| ≥30 | 4 | −0.12 (−0.26 to 0.02) | 0 | 0.79 | |
| Health status | 0.32 | ||||
| Healthy | 1 | −0.34 (−0.69 to 0.01) | — | — | |
| High CVD risk | 4 | −0.11 (−0.26 to 0.03) | 0 | 0.84 | |
| Lipid‐lowering medication | 0.08 | ||||
| Some | 3 | −0.09 (−0.29 to 0.11) | 0 | 0.69 | |
| None | 3 | −0.55 (−0.83 to −0.28) | 35.5 | 0.21 | |
| Intervention | 0.47 | ||||
| Lactovegetarian | 1 | −0.05 (−0.31 to 0.21) | — | — | |
| Lacto‐ovovegetarian | 1 | −0.52 (−0.99 to −0.05) | — | — | |
| Vegan | 6 | −0.33 (−0.58 to −0.08) | 57.4 | 0.04 | |
| Duration, months | 0.72 | ||||
| <3 | 5 | −0.24 (−0.47 to −0.01) | 21.4 | 0.28 | |
| ≥3 | 3 | −0.35 (−0.74 to 0.03) | 80.3 | 0.01 | |
| Design | 0.56 | ||||
| Crossover | 2 | −0.40 (−0.68 to −0.12) | 0 | 0.55 | |
| Parallel | 6 | −0.26 (−0.52 to −0.01) | 63.6 | 0.02 | |
| Analysis | 0.02 | ||||
| PP | 5 | −0.51 (−0.77 to −0.25) | 25.7 | 0.25 | |
| ITT | 3 | −0.12 (−0.26 to 0.02) | 0 | 0.79 | |
| Publication year | 0.70 | ||||
| Before 2000 | 3 | −0.42 (−0.81 to −0.03) | 0 | 0.38 | |
| 2000 or later | 5 | −0.28 (−0.51 to −0.05) | 68.5 | 0.01 | |
BMI indicates body mass index; CVD, cardiovascular disease; HDL‐C, high‐density lipoprotein cholesterol; ITT, intention to treat; PP, per protocol.
P for heterogeneity.
P for meta–regression analysis.
Results from fixed‐effect analysis.
Sensitivity Analysis and Publication Bias
Sensitivity analysis showed that the pooled estimate of the effects of vegetarian diets on TC, LDL‐C, HDL‐C, TG, and non–HDL‐C concentrations did not vary substantially with the exclusion of any 1 study (Figures S1 through S5). Results from Begg's rank correlation test and Egger's linear regression test suggested that no obvious publication bias was detected in the meta‐analysis of TC, LDL‐C, HDL‐C, TG, or non–HDL‐C (Table 6).
Table 6.
Results of Publication Bias Test
| No. of Trials | Pooled Effect (95% CI) mmol/L | P for Begg's Test | P for Egger's Test | |
|---|---|---|---|---|
| TC | 10 | −0.36 (−0.55 to −0.17) | 0.28 | 0.27 |
| LDL‐C | 7 | −0.34 (−0.57 to −0.11) | 0.37 | 0.54 |
| HDL‐C | 9 | −0.10 (−0.14 to −0.06) | 1.00 | 0.93 |
| TG | 11 | 0.04 (−0.05 to 0.13) | 0.35 | 0.16 |
| Non‐HDL‐C | 8 | −0.30 (−0.50 to −0.10) | 0.27 | 0.42 |
HDL‐C indicates high‐density lipoprotein cholesterol; LDL‐C, low‐density lipoprotein cholesterol; TC, total cholesterol; TG, triglyceride.
Discussion
The objective of the present study was to examine the effects of vegetarian diets on blood lipid concentrations. This meta‐analysis of 11 RCTs suggests that vegetarian diets had a significant lowering effect on the concentrations of blood TC, LDL‐C, HDL‐C, and non–HDL‐C; however, no remarkable effect was detected on TG concentrations.
Although a large number of cross‐sectional studies14, 15 have shown that concentrations of TC, LDL‐C, and TG were much lower in vegetarians than in omnivores, a few studies32, 33 have found no such relationships with HDL‐C and TG concentrations. A meta‐analysis of 12 observational studies with a total of 4177 participants revealed no evidence showing that HDL‐C concentrations differed in vegetarians and omnivores.34 Another meta‐analysis of 12 observational studies with 1300 participants indicated that vegetarian diets were effective in lowering TG concentrations.35 Although this phenomenon was obvious in developing countries, it was nonsignificant in developed countries. Likewise, results from RCTs in humans were not necessarily consistent, particularly those results on HDL‐C and TG. Our meta‐analysis was performed based on this inconsistent evidence to assess the overall effect of vegetarian diets on blood lipid concentrations.
Subgroup and meta–regression analyses indicated that the lowering effects of vegetarian diets on TC, LDL‐C, and non–HDL‐C concentrations were less evident in obese participants (BMI ≥30). Obesity is associated with an increased rate of cholesterol synthesis.36 Leptin, a hormone secreted by adipocytes, could promote hepatic cholesterol clearance37; however, most obese subjects always experience leptin resistance, and its effects might be diminished or lacking in the obese state.38 Consequently, the lowering effect of vegetarian diets on TC, LDL‐C, and non–HDL‐C concentrations could be attenuated in obese participants. Subgroup and meta‐regression analyses also showed that reduction in TC, LDL‐C, and non–HDL‐C concentrations was greater in trials that adopted per‐protocol analysis compared with those that adopted intention‐to‐treat analysis. This result is consistent with the idea that, on average, per‐protocol analysis tends to provide higher estimates of effect than the intention‐to‐treat analysis.39 A per‐protocol analysis is performed in which participants are included only if they received the intended intervention in line with the protocol, whereas an intention‐to‐treat analysis includes all randomized participants.21 Losses do not retain the intervention effect, and missing data in trials will lead to systematic differences between the approaches.39
Studies have shown that a 1‐mmol/L reduction in TC and LDL‐C levels results in a 26.6% to 29.5% decrease for any cardiovascular disease–related event.40 The average reductions of TC and LDL‐C concentrations following a vegetarian diet intervention included in this meta‐analysis were 0.36 and 0.34 mmol/L, respectively, which would correspond to a decrease in cardiovascular disease risk of about 9.0% to 10.6%. Vegetarian diets may reduce blood cholesterol concentrations through several mechanisms. Vegetarian diets are low in cholesterol, total fat, and saturated fatty acids,11 leading to less absorption and conversion to blood cholesterol.41 Moreover, vegetarian diets provide a high intake of dietary fiber and many health‐promoting phytochemicals including phytosterols, phenolics, carotenoids, flavonoids, indoles, saponins, and sulfides, derived primarily from fruits, vegetables, whole grains, legumes, nuts, and various soy products.42 These phytochemicals can exert substantial influence on cholesterol levels via multiple mechanisms. Phytosterols reduce intestinal cholesterol absorption by competing with cholesterol for a place in the mixed micelles.43 Phenolics inhibit the oxidation of LDL‐C, improving cardiovascular health.44 Flavonoids and saponins disrupt the cholesterol micelle solubility, leading to potential reduction in cholesterol absorption.45 Sulfides or organosulfur compounds decrease blood lipids, especially TC and non–HDL‐C, like LDL‐C, by inhibiting the biosynthesis of cholesterol.46
Like other cholesterol subfractions (eg, non–HDL‐C), blood HDL‐C concentrations were also decreased after the vegetarian diet intervention. A reduction in the apolipoprotein A‐I production rate appears to explain the decrease in HDL‐C concentrations.47 HDL‐C is inversely associated with risk of coronary heart disease.48 Despite lowering of HDL‐C in observational studies or RCTs, vegetarian diets are not associated with poor cardiovascular health.49 As for TG, the pooled estimated change in TG concentrations was not significant. Considering that all studies were conducted in developed countries, this result was consistent with a previous meta‐analysis.35 The mechanisms for the effect of vegetarian diets on TG still need to be studied.
This study has several strengths. First, as far as we are aware, this is the first meta‐analysis of RCTs to examine the effects of vegetarian diets on blood lipid concentrations. Second, the considerably large number of pooled participants provided sufficient statistical power to detect the treatment effects. In addition, results from both random‐ and fixed‐effects models were similar (Tables 3, 4 through 5), indicating that our findings were stable. Third, to avoid double counting of participants, if a study had multiple time points for the same participants, only the last end point was used for calculation of the pooled effect. Finally, the results were unlikely to be affected by publication bias. Both Begg's rank correlation test and Egger's linear regression test suggested no significant asymmetry for the overall effects estimation of TC, LDL‐C, HDL‐C, TG, and non–HDL‐C.
Although the present meta‐analysis may provide some useful information, several potential limitations of this meta‐analysis should be considered. First, dietary intervention studies typically cannot be double blinded.2 Lack of blinding could cause bias by affecting the actual outcomes of the participants in the trial.21 Although objective outcomes like blood lipid concentrations may not be influenced, subjective behaviors of participants across different groups (eg, dropout rate) could be affected. Second, moderate to high heterogeneity was present for the TC, LDL‐C, and non–HDL‐C analyses and was only partly explained by subgroup and meta–regression analyses. Although moderate to high heterogeneity still remained in some subgroups, the pooled weighted mean effect sizes showed consistent lowering effects of vegetarian diets on TC, LDL‐C, and non–HDL‐C concentrations. Third, this meta‐analysis suggested vegetarian diets could reduce blood TC, LDL‐C, and HDL‐C concentrations. Only a few studies provided data on the effect of vegetarian diets on the ratio of TC (or LDL‐C) to HDL‐C. Given that reductions of TC (or LDL‐C) and HDL‐C have different impacts on CVD risk, it was difficult to ascertain which impact was larger. Nevertheless, vegetarian diets have not been found to be associated with poor cardiovascular health.49 Fourth, greater weight reduction in the vegetarian groups was found compared with omnivorous groups (−2.88 kg, 95% CI −3.56 to −2.20, P<0.001) (Figure 5). Weight reduction was significantly associated with decrease of TC and LDL‐C50; therefore, some of the effect of the change in TC and LDL‐C in this meta‐analysis could be a consequence of weight loss. Fifth, our analysis covers a long time span of 30 years, with the oldest study performed in 1982 and the latest trial conducted in 2013. The time of study may be an important confounder because lifestyles changed and medical sciences advanced considerably; however, no significant difference was found between studies published before 2000 and those published in and after 2000 in subgroup and univariate meta–regression analyses. Finally, studies that examined the effects of vegetarian diets on serum lipid concentrations and on plasma lipid concentrations were both included in this meta‐analysis to guarantee a considerable number of participants. The commonly recommended anticoagulant for plasma is disodium ethylenediaminetetraacetate. Its use may produce a shift of water from red blood cells to plasma and thus dilutes the plasma and lowers the concentration of lipids.51 Comparing final values may introduced bias due to the difference between plasma lipids and serum lipids. This meta‐analysis was analyzed based on changes from baseline to minimize this bias.
Figure 5.
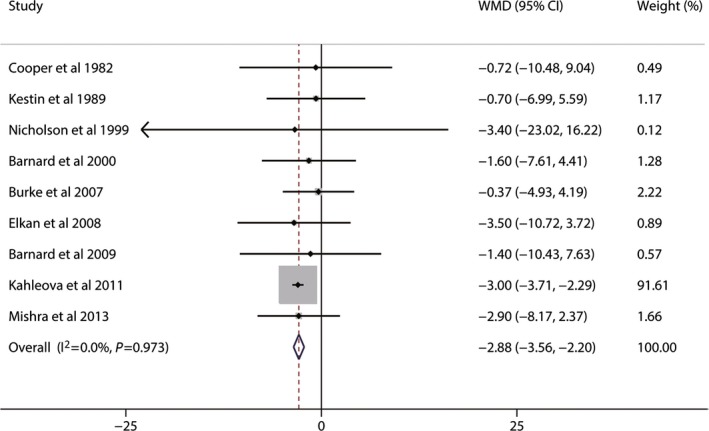
Effects of vegetarian diets on weight loss. The meta‐analysis used the WMD in the random‐effects model. Horizontal lines denote 95% CI. A diamond represents the overall estimated effect. WMD, weighted mean difference.
In conclusion, vegetarian diets could effectively lower blood concentrations of TC, LDL‐C, HDL‐C, and non–HDL‐C. These findings have important public health implications with regard to the management of dyslipidemia, especially hypercholesterolemia, via dietary intervention. Further well‐designed RCTs that are designed to evaluate the effects of specific vegetarian diets on blood lipids are required, and additional studies with detailed population information should be performed to clarify the possible mechanism.
Sources of Funding
This study was funded by the National Basic Research Program of China (973 Program: 2015CB553604).
Disclosures
None.
Supporting information
Table S1. Assessment of Risk of Bias Across Studies
Figure S1. Sensitivity analysis of 10 studies evaluating blood total cholesterol concentrations.
Figure S2. Sensitivity analysis of 7 studies evaluating blood low‐density lipoprotein cholesterol concentrations.
Figure S3. Sensitivity analysis of 9 studies evaluating blood high‐density lipoprotein cholesterol concentrations.
Figure S4. Sensitivity analysis of 11 studies evaluating blood triglyceride concentrations.
Figure S5. Sensitivity analysis of 8 studies evaluating blood non–high‐density lipoprotein cholesterol concentrations.
(J Am Heart Assoc. 2015;4:e002408 doi: 10.1161/JAHA.115.002408)
Accompanying Table S1 and Figures S1 through S5 are available at http://jaha.ahajournals.org/content/4/10/e002408/suppl/DC1
References
- 1. Okamura T. Dyslipidemia and cardiovascular disease: a series of epidemiologic studies in Japanese populations. J Epidemiol. 2010;20:259–265. [DOI] [PMC free article] [PubMed] [Google Scholar]
- 2. Ferdowsian HR, Barnard ND. Effects of plant‐based diets on plasma lipids. Am J Cardiol. 2009;104:947–956. [DOI] [PubMed] [Google Scholar]
- 3. Nordestgaard BG, Varbo A. Triglycerides and cardiovascular disease. Lancet. 2014;384:626–635. [DOI] [PubMed] [Google Scholar]
- 4. Expert Panel on Detection E . Executive summary of the third report of the national cholesterol education program (NCEP) expert panel on detection, evaluation, and treatment of high blood cholesterol in adults (adult treatment panel III). JAMA. 2001;285:2486–2497. [DOI] [PubMed] [Google Scholar]
- 5. Ridker PM. LDL cholesterol: controversies and future therapeutic directions. Lancet. 2014;384:607–617. [DOI] [PubMed] [Google Scholar]
- 6. Tenenbaum A, Fisman EZ. Fibrates are an essential part of modern anti‐dyslipidemic arsenal: spotlight on atherogenic dyslipidemia and residual risk reduction. Cardiovasc Diabetol. 2012;11:1475–2840. [DOI] [PMC free article] [PubMed] [Google Scholar]
- 7. Istvan ES, Deisenhofer J. Structural mechanism for statin inhibition of HMG‐CoA reductase. Science. 2001;292:1160–1164. [DOI] [PubMed] [Google Scholar]
- 8. Ha V, Sievenpiper JL, de Souza RJ, Jayalath VH, Mirrahimi A, Agarwal A, Chiavaroli L, Mejia SB, Sacks FM, Di Buono M. Effect of dietary pulse intake on established therapeutic lipid targets for cardiovascular risk reduction: a systematic review and meta‐analysis of randomized controlled trials. Can Med Assoc J. 2014;186:E252–E262. [DOI] [PMC free article] [PubMed] [Google Scholar]
- 9. Jellinger PS, Smith DA, Mehta AE, Ganda O, Handelsman Y, Rodbard HW, Shepherd MD, Seibel JA. American association of clinical endocrinologists' guidelines for management of dyslipidemia and prevention of atherosclerosis. Endocr Pract. 2012;18:1–78. [DOI] [PubMed] [Google Scholar]
- 10. Li D. Effect of the vegetarian diet on non‐communicable diseases. J Sci Food Agric. 2014;94:169–173. [DOI] [PubMed] [Google Scholar]
- 11. Li D. Chemistry behind vegetarianism. J Agric Food Chem. 2011;59:777–784. [DOI] [PubMed] [Google Scholar]
- 12. Yokoyama Y, Nishimura K, Barnard ND, Takegami M, Watanabe M, Sekikawa A, Okamura T, Miyamoto Y. Vegetarian diets and blood pressure: a meta‐analysis. JAMA Intern Med. 2014;174:577–587. [DOI] [PubMed] [Google Scholar]
- 13. Huang T, Yang B, Zheng J, Li G, Wahlqvist ML, Li D. Cardiovascular disease mortality and cancer incidence in vegetarians: a meta‐analysis and systematic review. Ann Nutr Metab. 2012;60:233–240. [DOI] [PubMed] [Google Scholar]
- 14. Li D, Sinclair A, Mann N, Turner A, Ball M, Kelly F, Abedin L, Wilson A. The association of diet and thrombotic risk factors in healthy male vegetarians and meat‐eaters. Eur J Clin Nutr. 1999;53:612–619. [DOI] [PubMed] [Google Scholar]
- 15. De Biase SG, Fernandes SFC, Gianini RJ, Duarte JLG. Vegetarian diet and cholesterol and triglycerides levels. Arq Bras Cardiol. 2007;88:35–39. [DOI] [PubMed] [Google Scholar]
- 16. Barnard ND, Scialli AR, Bertron P, Hurlock D, Edmonds K, Talev L. Effectiveness of a low‐fat vegetarian diet in altering serum lipids in healthy premenopausal women. Am J Cardiol. 2000;85:969–972. [DOI] [PubMed] [Google Scholar]
- 17. Mishra S, Xu J, Agarwal U, Gonzales J, Levin S, Barnard ND. A multicenter randomized controlled trial of a plant‐based nutrition program to reduce body weight and cardiovascular risk in the corporate setting: the GEICO study. Eur J Clin Nutr. 2013;67:718–724. [DOI] [PMC free article] [PubMed] [Google Scholar]
- 18. Ågren JJ, Tvrzicka E, Nenonen MT, Helve T, Hänninen O. Divergent changes in serum sterols during a strict uncooked vegan diet in patients with rheumatoid arthritis. Br J Nutr. 2001;85:137–139. [DOI] [PubMed] [Google Scholar]
- 19. Barnard ND, Cohen J, Jenkins DJ, Turner‐McGrievy G, Gloede L, Green A, Ferdowsian H. A low‐fat vegan diet and a conventional diabetes diet in the treatment of type 2 diabetes: a randomized, controlled, 74‐wk clinical trial. Am J Clin Nutr. 2009;89(suppl):1S–9S. [DOI] [PMC free article] [PubMed] [Google Scholar]
- 20. Moher D, Liberati A, Tetzlaff J, Altman DG. Preferred reporting items for systematic reviews and meta‐analyses: the PRISMA statement. Ann Intern Med. 2009;151:264–269. [DOI] [PubMed] [Google Scholar]
- 21. Higgins JPT, Green S. Cochrane handbook for systematic reviews of interventions version 5.1.0 [updated March 2011]. Available at: http://www.cochranehandbook.org. Accessed April 2, 2015.
- 22. Elbourne DR, Altman DG, Higgins JP, Curtin F, Worthington HV, Vail A. Meta‐analyses involving cross‐over trials: methodological issues. Int J Epidemiol. 2002;31:140–149. [DOI] [PubMed] [Google Scholar]
- 23. DerSimonian R, Laird N. Meta‐analysis in clinical trials. Control Clin Trials. 1986;7:177–188. [DOI] [PubMed] [Google Scholar]
- 24. Cooper RS, Goldberg RB, Trevisan M, Tsong Y, Liu K, Stamler J, Rubenstein A, Scanu AM. The selective lipid‐lowering effect of vegetarianism on low density lipoproteins in a cross‐over experiment. Atherosclerosis. 1982;44:293–305. [DOI] [PubMed] [Google Scholar]
- 25. Kestin M, Rouse IL, Correll RA, Nestel PJ. Cardiovascular disease risk factors in free‐living men: comparison of two prudent diets, one based on lactoovovegetarianism and the other allowing lean meat. Am J Clin Nutr. 1989;50:280–287. [DOI] [PubMed] [Google Scholar]
- 26. Ling WH, Laitinen M, Hänninen O. Shifting from conventional diet to an uncooked vegan diet reversibly alters serum lipid and apolipoprotein levels. Nutr Res. 1992;12:1431–1440. [DOI] [PubMed] [Google Scholar]
- 27. Nicholson AS, Sklar M, Barnard ND, Gore S, Sullivan R, Browning S. Toward improved management of NIDDM: a randomized, controlled, pilot intervention using a lowfat, vegetarian diet. Prev Med. 1999;29:87–91. [DOI] [PubMed] [Google Scholar]
- 28. Burke LE, Hudson AG, Warziski MT, Styn MA, Music E, Elci OU, Sereika SM. Effects of a vegetarian diet and treatment preference on biochemical and dietary variables in overweight and obese adults: a randomized clinical trial. Am J Clin Nutr. 2007;86:588–596. [DOI] [PubMed] [Google Scholar]
- 29. Elkan AC, Sjoberg B, Kolsrud B, Ringertz B, Hafstrom I, Frostegard J. Gluten‐free vegan diet induces decreased LDL and oxidized LDL levels and raised atheroprotective natural antibodies against phosphorylcholine in patients with rheumatoid arthritis: a randomized study. Arthritis Res Ther. 2008;10:R34. [DOI] [PMC free article] [PubMed] [Google Scholar]
- 30. Kahleova H, Matoulek M, Malinska H, Oliyarnik O, Kazdova L, Neskudla T, Skoch A, Hajek M, Hill M, Kahle M, Pelikanova T. Vegetarian diet improves insulin resistance and oxidative stress markers more than conventional diet in subjects with type 2 diabetes. Diabet Med. 2011;28:549–559. [DOI] [PMC free article] [PubMed] [Google Scholar]
- 31. Anderson TJ, Grégoire J, Hegele RA, Couture P, Mancini GB, McPherson R, Francis GA, Poirier P, Lau DC, Grover S, Genest J Jr, Carpentier AC, Dufour R, Gupta M, Ward R, Leiter LA, Lonn E, Ng DS, Pearson GJ, Yates GM, Stone JA, Ur E. 2012 update of the Canadian Cardiovascular Society guidelines for the diagnosis and treatment of dyslipidemia for the prevention of cardiovascular disease in the adult. Can J Cardiol. 2013;29:151–167. [DOI] [PubMed] [Google Scholar]
- 32. Robinson F, Hackett AF, Billington D, Stratton G. Changing from a mixed to self‐selected vegetarian diet‐influence on blood lipids. J Hum Nutr Diet. 2002;15:323–329. [DOI] [PubMed] [Google Scholar]
- 33. Papadaki A, Vardavas C, Hatzis C, Kafatos A. Calcium, nutrient and food intake of Greek Orthodox Christian monks during a fasting and non‐fasting week. Public Health Nutr. 2008;11:1022–1029. [DOI] [PubMed] [Google Scholar]
- 34. Zhang Z, Wang J, Chen S, Wei Z, Li Z, Zhao S, Lu W. Comparison of vegetarian diets and omnivorous diets on plasma level of HDL‐c: a meta‐analysis. PLoS One. 2014;9:e92609. [DOI] [PMC free article] [PubMed] [Google Scholar]
- 35. Zhang Z, Ma G, Chen S, Li Z, Xia E, Sun Y, Yang F, Zheng L, Feng X. Comparison of plasma triacylglycerol levels in vegetarians and omnivores: a meta‐analysis. Nutrition. 2013;29:426–430. [DOI] [PubMed] [Google Scholar]
- 36. Miettinen TA. Cholesterol production in obesity. Circulation. 1971;44:842–850. [DOI] [PubMed] [Google Scholar]
- 37. VanPatten S, Ranginani N, Shefer S, Nguyen LB, Rossetti L, Cohen DE. Impaired biliary lipid secretion in obese Zucker rats: leptin promotes hepatic cholesterol clearance. Am J Physiol Gastrointest Liver Physiol. 2001;281:G393–G404. [DOI] [PubMed] [Google Scholar]
- 38. Scarpace PJ, Zhang Y. Leptin resistance: a prediposing factor for diet‐induced obesity. Am J Physiol Regul Integr Comp Physiol. 2009;296:R493–R500. [DOI] [PMC free article] [PubMed] [Google Scholar]
- 39. Porta N, Bonet C, Cobo E. Discordance between reported intention‐to‐treat and per protocol analyses. J Clin Epidemiol. 2007;60:663–669. [DOI] [PubMed] [Google Scholar]
- 40. Schwingshackl L, Hoffmann G. Comparison of effects of long‐term low‐fat vs high‐fat diets on blood lipid levels in overweight or obese patients: a systematic review and meta‐analysis. J Acad Nutr Diet. 2013;113:1640–1661. [DOI] [PubMed] [Google Scholar]
- 41. Hu FB, Stampfer MJ, Manson JE, Rimm E, Colditz GA, Rosner BA, Hennekens CH, Willett WC. Dietary fat intake and the risk of coronary heart disease in women. N Engl J Med. 1997;337:1491–1499. [DOI] [PubMed] [Google Scholar]
- 42. Craig WJ. Nutrition concerns and health effects of vegetarian diets. Nutr Clin Pract. 2010;25:613–620. [DOI] [PubMed] [Google Scholar]
- 43. Uddin M, Sarker M, Islam Z, Ferdosh S, Akanda M, Haque J, Easmin M, Shamsudin B, Hadijah S, Yunus KB. Phytosterols and their extraction from various plant matrices using supercritical carbon dioxide: a review. J Sci Food Agric. 2015;95:1385–1394. [DOI] [PubMed] [Google Scholar]
- 44. Van Hung P. Phenolic compounds of cereals and their antioxidant capacity. Crit Rev Food Sci Nutr. 2014; doi:10.1080/10408398.2012.708909 [Epub ahead of print]. [DOI] [PubMed] [Google Scholar]
- 45. Chávez‐Santoscoy RA, Gutiérrez‐Uribe JA, Serna‐Saldívar SO. Effect of flavonoids and saponins extracted from black bean (Phaseolus vulgaris L.) seed coats as cholesterol micelle disruptors. Plant Foods Hum Nutr. 2013;68:416–423. [DOI] [PubMed] [Google Scholar]
- 46. Liu L, Yeh Y. Inhibition of cholesterol biosynthesis by organosulfur compounds derived from garlic. Lipids. 2000;35:197–203. [DOI] [PubMed] [Google Scholar]
- 47. Desroches S, Paradis M, Pérusse M, Archer WR, Bergeron J, Couture P, Bergeron N, Lamarche B. Apolipoprotein AI, A‐II, And VLDL‐B‐100 metabolism in men comparison of a low‐fat diet and a high‐monounsaturated fatty acid diet. J Lipid Res. 2004;45:2331–2338. [DOI] [PubMed] [Google Scholar]
- 48. Rader DJ, Hovingh GK. HDL and cardiovascular disease. Lancet. 2014;384:618–625. [DOI] [PubMed] [Google Scholar]
- 49. Ornish D, Scherwitz LW, Billings JH, Gould KL, Merritt TA, Sparler S, Armstrong WT, Ports TA, Kirkeeide RL, Hogeboom C. Intensive lifestyle changes for reversal of coronary heart disease. JAMA. 1998;280:2001–2007. [DOI] [PubMed] [Google Scholar]
- 50. Dattilo AM, Kris‐Etherton PM. Effects of weight reduction on blood lipids and lipoproteins: a meta‐analysis. Am J Clin Nutr. 1992;56:320–328. [DOI] [PubMed] [Google Scholar]
- 51. Tolonen H, Wolf H, Jakovljevic D, Kuulasmaa K. Review of surveys for risk factors of major chronic diseases and comparability of the results. European Health Risk Monitoring (EHRM) Project [text on the Internet]. Oslo, 2002. Available at: http://www.thl.fi/publications/ehrm/product1/title.htm. Accessed April 30, 2015.
Associated Data
This section collects any data citations, data availability statements, or supplementary materials included in this article.
Supplementary Materials
Table S1. Assessment of Risk of Bias Across Studies
Figure S1. Sensitivity analysis of 10 studies evaluating blood total cholesterol concentrations.
Figure S2. Sensitivity analysis of 7 studies evaluating blood low‐density lipoprotein cholesterol concentrations.
Figure S3. Sensitivity analysis of 9 studies evaluating blood high‐density lipoprotein cholesterol concentrations.
Figure S4. Sensitivity analysis of 11 studies evaluating blood triglyceride concentrations.
Figure S5. Sensitivity analysis of 8 studies evaluating blood non–high‐density lipoprotein cholesterol concentrations.