

Abstract
Background
Renal dysfunction is a major risk factor for atrial fibrillation (AF). The uremic toxin indoxyl sulfate may contribute to the progression of cardiac fibrosis and AF substrate in renal dysfunction.
Methods and Results
Male Sprague–Dawley rats were assigned randomly to the following groups: 5/6 nephrectomy (5/6Nx) with vehicle, 5/6Nx with AST‐120, sham procedure with vehicle, and sham procedure with AST‐120. Vehicle and AST‐120 were administered for 4 weeks. Serum levels of IS were significantly increased in 5/6Nx groups. Expression of malondialdehyde, an indicator of oxidative stress, was upregulated in the left atrium of 5/6Nx groups and was accompanied by an increase in expression of NADPH oxidase 2 and 4. Monocyte‐mediated inflammatory signals such as CD68, monocyte chemoattractant protein 1, and vascular cell adhesion molecule 1 were also upregulated in 5/6Nx groups. Interstitial fibrosis was promoted heterogeneously, and expression of profibrotic indicators such as transforming growth factor β1, α‐smooth muscle actin, and collagen type 1 was upregulated in left atrium tissue of 5/6Nx groups. In cultured atrial fibroblasts, incubation with IS upregulated expression of the markers of oxidative stress, inflammation, and profibrotic factors. These results suggest the direct effects of IS on the progression of AF substrate. AF was consistently and invariably induced by atrial extrastimuli in 5/6Nx groups in electrophysiological experiments. AST‐120 treatment significantly alleviated renal dysfunction–induced oxidative stress, inflammation, and atrial fibrosis and, consequently, attenuated AF inducibility.
Conclusions
Indoxyl sulfate facilitates atrial fibrosis and AF and thus is a novel therapeutic target for prevention of renal dysfunction–induced AF.
Keywords: atrial fibrillation, indoxyl sulfate, renal dysfunction
Atrial fibrillation (AF) is a common but important type of arrhythmia because of the high risk of cerebral thromboembolism, which can be fatal.1, 2 A close relationship between AF and chronic renal dysfunction has been demonstrated in the several clinical trials.3, 4, 5, 6, 7 Analyses based on the Atherosclerosis Risk in Communities (ARIC) study revealed that patients with chronic renal dysfunction who were not on dialysis were independently correlated with the incidence of AF.4 Another study demonstrated the odds ratios for the prevalence of AF to be 2.67, 1.68, and 3.52 in chronic kidney disease stages 1 and 2, 3, and 4 and 5, respectively.5 Despite these clinical results, the mechanisms of renal dysfunction leading to AF have yet to be elucidated fully. We have recently established a model of AF associated with renal dysfunction in rats and revealed that oxidative stress contributes to renal dysfunction–induced AF.8
Renal dysfunction results in the accumulation of various uremic toxins. Indoxyl sulfate (IS) is a poorly dialysable uremic toxin due to its high protein binding, and it has been proposed as a critical factor for the progression of inflammation and fibrosis in various tissues.9, 10, 11, 12 IS has been reported to exaggerate cardiac fibrosis via oxidative stress and inflammation in renal dysfunction, and AST‐120 (commonly used in clinical settings as an absorbent of uremic toxins) has been reported to ameliorate fibrosis by reducing circulating levels of IS.13, 14, 15 Given that atrial interstitial fibrosis is a substrate for the pathogenesis of AF,16, 17, 18 we hypothesized that IS may be a predisposing factor for AF in renal dysfunction mediated by aggravation of oxidative stress, inflammation, and atrial fibrosis. Furthermore, we investigated the effects of reducing circulating levels of IS by AST‐120 on renal dysfunction–induced AF.
Materials and Methods
Experimental procedures were conducted in accordance with the guidelines of the Physiological Society of Ōita University (Ōita, Japan) for the care and use of laboratory animals. Those guidelines followed the guidelines established by the US National Institutes of Health. We used 138 rats in the present study (128 rats for in vivo experiments and 10 rats for in vitro experiments).
Animal Model of Renal Dysfunction
Male Sprague–Dawley rats aged 8 weeks (KYUDO Co, Ltd, Japan) underwent nephrectomy by resection of the upper and lower thirds of the left kidney, followed by right nephrectomy 7 days later and completed 5/6 nephrectomy (5/6Nx).8 The control group underwent a sham procedure without nephrectomy (sham). Rats were assigned randomly to the following groups: sham plus vehicle (VEH), sham plus AST‐120, 5/6Nx plus VEH, and 5/6Nx plus AST‐120. VEH and AST‐120 were administered by mixing in standard rat chow at 8% wt/wt for 4 weeks.15 Rats were anesthetized by intraperitoneal injection of a mixture of ketamine (60 mg/kg) and xylazine (10 mg/kg). The depth of anesthesia was confirmed by a stable heart rate and lack of flexor responses to a paw pinch.
Hemodynamic Parameters and Echocardiography
At the end of the sequential protocol, systolic blood pressure and heart rate were measured using the noninvasive tail‐cuff method (Muromachi Kikai Co, Ltd). Transthoracic echocardiography (Hitachi Aloka Medical, Ltd) was also undertaken under anesthesia, which was confirmed not to decrease blood pressure. Left atrial dimension, interventricular septal wall thickness, left ventricular end‐diastolic dimension, left ventricular end‐systolic dimension, left ventricular ejection fraction, and left ventricular posterior wall thickness, peak early and late transmitral flow velocities, and deceleration time of the mitral E‐wave were determined.
Laboratory Data and IS Measurement
Blood samples were collected from the inferior vena cava, and 24‐hour urine samples were collected using metabolic cages. Serum levels of IS were measured by high‐performance liquid chromatography using a mobile phase of 5% tetrahydrofuran and 0.1 mol/L KH2PO4 (pH 6.5) at a flow rate of 1 mL/min and fluorescence detection (excitation at 295 nm and emission at 390 nm).19
Histological Studies
Isolated samples of left atrium (LA), left ventricle (LV), and right atrium (RA) were fixed in 4% paraformaldehyde, embedded in paraffin, and cut into 5‐μm sections. Masson trichrome staining was used to evaluate interstitial fibrosis. Micrographs were digitized using a BZ‐9000 Biolevo Epifluorescence Microscope (Keyence). Areas of fibrosis were analyzed using an imaging software (Keyence). For each atrium and ventricle, 3 images at a magnification of ×400 were analyzed and averaged.
Electrophysiological Studies
Electrophysiological studies were carried out on isolated perfused hearts using a Langendorff apparatus with Krebs–Henseleit buffer equilibrated with a 95% O2 and 5% CO2 gas mixture at a constant pressure of 60 mm Hg.20, 21 Isolated hearts were stabilized for 10 minutes by perfusion at constant flow before programmed electrical stimulation. Teflon‐coated (except their tips) silver bipolar electrodes were placed on the LV and on RA and LA appendages. Interelectrode distance between RA and LA was set at 10 mm to measure the interatrial conduction time. The effective refractory period of the LA was measured by the S2 extrastimulus method using 8 regularly paced beats with cycle lengths of 200, 150, 120, and 90 ms. The interatrial conduction time was measured during RA pacing. AF inducibility was tested by the S3 extrastimulus pacing method. In S3 extrastimulus pacing, intervals of S1 to S2 and S2 to S3 were identical and decreased from 100 ms to the effective refractory period of the RA. AF was defined as rapid and irregular atrial excitations lasting ≥1 second.
Western Blot Analyses
Western immunoblotting was undertaken, as described previously.8 An equal amount of total protein taken from LA tissues was subjected to SDS‐PAGE and transferred by electrophoresis onto polyvinylidene difluoride membranes (Bio‐Rad). After blocking, membranes were incubated with antibodies against transforming growth factor β1, α‐smooth muscle actin, collagen type 1, CD68, monocyte chemoattractant protein 1 (MCP‐1), vascular cell adhesion molecule 1 (VCAM‐1), NADPH oxidase (NOX) 2, NOX4, malondialdehyde (MDA), or GAPDH (Table 1). After washing, membranes were incubated with horseradish peroxidase–tagged secondary antibodies (GE Healthcare) and proteins visualized using electrochemiluminescence (GE Healthcare).
Table 1.
List of Antibodies
| Antibody | Application | Dilution | Company |
|---|---|---|---|
| TGF‐β1 | Immunoblot | 1:500 | Santa Cruz Biotechnology, sc‐146 |
| α‐SMA | Immunoblot | 1:500 | Sigma‐Aldrich, A2547 |
| Collagen type 1 (COL1A1) | Immunoblot | 1:250 | Santa Cruz Biotechnology, sc‐25974 |
| Collagen type 1 (COL1A1) | Immunofluorescence | 1:500 | Santa Cruz Biotechnology, sc‐25974 |
| CD68 | Immunoblot | 1:500 | Abcam, ab31630 |
| CD68 | Immunofluorescence | 1:500 | Abcam, ab955 |
| MCP‐1 | Immunoblot | 1:500 | Abcam, ab25124 |
| MCP‐1 | Immunohistchemistry | 1:100 | Abcam, ab25124 |
| MCP‐1 | Immunofluorescence | 1:500 | Santa Cruz Biotechnology, sc‐1785 |
| VCAM‐1 | Immunoblot | 1:1000 | Abcam, ab134047 |
| VCAM‐1 | Immunohistchemistry | 1:200 | Abcam, ab134047 |
| NOX2 (gp91‐phox) | Immunoblot | 1:250 | Santa Cruz Biotechnology, sc‐5827 |
| NOX4 | Immunoblot | 1:500 | Abcam, ab109225 |
| MDA | Immunoblot | 1:1000 | Academy Bio‐Medical, MD20A‐R1a |
| GAPDH | Immunoblot | 1:50 000 | Sigma‐Aldrich, G9545 |
MCP‐1 indicates monocyte chemoattractant protein 1; MDA, malondialdehyde; NOX, NADPH oxidase; TGF‐β1, transforming growth factor β1; VCAM‐1, vascular cell adhesion molecule 1; α‐SMA, α‐smooth muscle actin.
Culture of Atrial Fibroblasts Isolated From Adult Rats
Atrial cardiac fibroblasts were isolated from male Sprague–Dawley rats aged 6 weeks. LAs were removed and minced in PBS. After digestion with trypsin (2 mg/mL) at 37°C, atrial fibroblasts were pelleted at 78.3 g for 10 minutes and resuspended in DMEM with 5% fetal bovine serum, penicillin (100 U/mL), streptomycin (100 mg/mL), vitamin B12 (2 g/mL), and bromodeoxyuridine (0.1 mmol/L), as described elsewhere.21, 22 After 2 to 3 days, confluent cultures were passaged by trypsinization and replated. Atrial fibroblasts of their second passage were used for experiments. After incubation for 24 hours in serum‐free DMEM, IS (Alfa Aesar) or distilled H2O was added to the culture medium. Atrial fibroblasts incubated with added IS (150 μmol/L or 10 to 500 μmol/L) were collected after 48 or 72 hours. Atrial fibroblasts incubated with added distilled H2O were collected after 72 hours and used as controls.
Immunohistochemistry
Samples of isolated LA were fixed in 4% paraformaldehyde, embedded in paraffin, and cut into 5‐μm sections. Some sections were incubated with primary anti‐MCP‐1 or anti‐VCAM‐1 overnight at 4°C and then incubated with appropriate biotin‐conjugated secondary antibody (Vector Laboratories). Sections were visualized using a 3,3′‐Diaminobenzidine Substrates kit (Vector Laboratories) as immunostaining‐positive areas and counterstained with hematoxylin. Other sections were incubated with primary anti‐CD68 or anti‐MCP‐1 and anti‐collagen type 1 overnight at 4°C and then incubated with appropriate biotin‐conjugated secondary antibody (Vector Laboratories). These sections were visualized by immunofluorescence with fluorescein and cyanine 3–conjugated streptavidin and mounted with mounting medium using DAPI to visualize nuclei. Micrographs were digitized using a BZ‐9000 Biolevo Epifluorescence Microscope (Keyence). CD68‐positive cells in 3 images at magnification of ×400 were counted and averaged using imaging software (Keyence), as described.
Scanning and Transmission Electron Microscopy
Isolated LA tissues were cut open carefully. Some tissues earmarked for scanning electron microscopy were fixed as they were, whereas others earmarked for transmission electron microscopy were fixed after being cut into ≈5×5‐mm pieces in a mixture of 2.5% glutaraldehyde and 2% paraformaldehyde (Karnovsky's fixative) in 0.1 mol/L cacodylate buffer (pH 7.4) overnight at 4°C.23, 24 After rinsing in a 0.1 mol/L cacodylate buffer, they were placed in cacodylate‐buffered 1% osmium tetroxide, 1% aqueous solution of tannic acid, and 1% osmium tetroxide again for 1 hour each at 4°C. After rinsing with cacodylate buffer, they were dehydrated through a graded series of ethanol solutions. Samples for scanning electron microscopy were dried by the tert‐butyl alcohol freezing method and mounted on aluminum stubs with carbon tapes and silver paste and then coated lightly with platinum.23, 24 Samples for transmission electron microscopy were embedded in epoxy resin and cut into ultrathin sections (80 to 90 nm) and stained with uranyl acetate and lead citrate. Samples were observed using an S‐4800 scanning electron microscope (Hitachi) and an H7650 transmission electron microscope (Hitachi).
Statistical Analyses
Continuous data were assessed for normal distribution using the Shapiro–Wilk test. Normally distributed data were expressed as mean±SE. Non‐normally distributed variables were expressed as medians and interquartile ranges. Comparisons among the 4 groups were analyzed using one‐way ANOVA followed by the Bonferroni–Dunn test (for normally distributed data) or the Kruskal–Wallis test with Dunn's multiple comparison test (for non‐normally distributed data). Repeated‐measures analyses were undertaken with two‐way repeated‐measures ANOVA followed by Bonferroni–Dunn tests. Prevalence of AF among 4 groups was compared using Fisher's exact test. P<0.05 (2‐tailed) indicated significance.
Results
Physiological and Hemodynamic Characteristics
Table 2 summarizes the physiological and hemodynamic characteristics of animal models after treatment with AST‐120 or VEH for 4 weeks (n=8 for each group). Body weight, gain in body weight, and food intake were significantly lower in the 5/6Nx groups than those of the sham–VEH group. Heart:body weight ratio was significantly greater in the 5/6Nx–VEH group than in the sham–VEH group and was attenuated by AST‐120 treatment. Systolic blood pressure and heart rate were significantly elevated in the 5/6Nx–VEH group compared with the sham–VEH group. Nevertheless, there were no significant effects on blood pressure and heart rate on AST‐120 treatment (Figure 1).
Table 2.
Physiological and Hemodynamic Parameters
| Sham+VEH | Sham+AST‐120 | 5/6Nx+VEH | 5/6Nx+AST‐120 | |
|---|---|---|---|---|
| BW, g | 467.3±8.7 | 461.0±11.3 | 404.5±11.7b | 401.5±8.0b |
| BW gain, g | 118.9±9.1 | 123.3±6.3 | 76.1±12.6a | 75.9±13.4a |
| Food intake, g/day | 28.9±1.7 | 29.3±1.2 | 24.9±1.7a | 23.2±2.1b |
| HW, g | 1.67±0.05 | 1.64±0.05 | 1.70±0.04 | 1.61±0.02 |
| HW/BW, mg/g | 3.61±0.04 | 3.56±0.06 | 4.21±0.05b | 4.00±0.05b, c |
| Systolic BP, mm Hg | 126.0±1.5 | 127.1±1.8 | 153.5±1.3b | 151.4±1.6b |
| HR, bpm | 307.8±3.8 | 313.2±2.7 | 337.3±3.6b | 331.0±4.3b |
n=8 for each group. Data are shown as mean±SE. 5/6Nx indicates 5/6 nephrectomized rats; BP, blood pressure; BW, body weight; HR, heart rate; HW, heart weight; HW/BW, heart:body weight ratio; Sham, sham‐operated rats; VEH, vehicle.
P<0.05 vs Sham plus VEH.
P<0.01 vs Sham plus VEH.
P<0.01 vs 5/6Nx plus VEH.
Figure 1.

Hemodynamic parameters during the experimental period. Time courses of systolic blood pressure (A) and heart rate (B). n=8 for each group. Data are shown as mean±SE. *P<0.05 vs Sham plus VEH. **P<0.01 vs Sham plus VEH. 5/6Nx indicates 5/6 nephrectomy; Sham, sham procedure; VEH, vehicle.
Echocardiographic Findings
Table 3 summarizes the echocardiographic findings (n=8 for each group). Left atrial dimension, left ventricular posterior wall thickness, and left ventricular ejection fraction and deceleration time of the mitral E‐wave were significantly increased, and left ventricular end‐systolic and end‐diastolic dimensions and peak early/late transmitral flow velocity ratio were decreased in the 5/6Nx–VEH group compared with the sham–VEH group. All of these changes were attenuated by AST‐120 treatment.
Table 3.
Echocardiographic Parameters
| Sham+VEH | Sham+AST‐120 | 5/6Nx+VEH | 5/6Nx+AST‐120 | |
|---|---|---|---|---|
| LAD, mm | 2.90±0.03 | 2.85±0.03 | 3.53±0.04b | 3.15±0.05b, d |
| IVS, mm | 1.14±0.05 | 1.11±0.04 | 1.35±0.05a | 1.21±0.03 |
| LVPW, mm | 1.49±0.04 | 1.45±0.04 | 2.09±0.05b | 1.75±0.04b, d |
| LVDs, mm | 4.20±0.10 | 4.21±0.05 | 3.53±0.10b | 4.15±0.05d |
| LVDd, mm | 7.19±0.11 | 7.23±0.08 | 6.68±0.04b | 7.21±0.10d |
| LVEF, % | 80.0±0.7 | 80.3±0.8 | 85.1±1.1b | 80.9±0.6d |
| E/A ratio | 2.02±0.03 | 2.08±0.02 | 1.52±0.02b | 1.63±0.02b, d |
| DcT, ms | 46.7±2.4 | 42.7±2.0 | 67.8±1.4b | 60.8±1.9b, c |
n=8 for each group. Data are the mean±SE. 5/6Nx indicates 5/6 nephrectomized rats; A, peak late transmitral flow velocity; DcT, deceleration time of the mitral E‐wave; E, peak early transmitral flow velocity; IVS, interventricular septal wall thickness; LAD, left atrial dimension; LVDd, left ventricular end‐diastolic dimension; LVDs, left ventricular end‐systolic dimension; LVEF, left ventricular ejection fraction; LVPW, left ventricular posterior wall thickness; Sham, sham‐operated rats; VEH, vehicle.
P<0.05 vs Sham plus VEH.
P<0.01 vs Sham plus VEH.
P<0.05 vs 5/6Nx plus VEH.
P<0.01 vs 5/6Nx plus VEH.
Biochemical Characteristics
Table 4 summarizes the biochemical parameters (n=8 for each group). Levels of hemoglobin and plasma albumin were significantly decreased in the 5/6Nx–VEH group compared with the sham–VEH group and were not recovered by AST‐120 treatment. Levels of total cholesterol and low‐density lipoprotein cholesterol were significantly elevated in the 5/6Nx–VEH group compared with the sham–VEH group and were not recovered by AST‐120 treatment. There were no significant differences in levels of fasting blood glucose among the 4 experimental groups. With regard to renal function, plasma levels of blood urea nitrogen and creatinine were significantly elevated by 5/6Nx and were significantly recovered by AST‐120 treatment. Creatinine clearance was reduced and urinary protein excretion was increased in the 5/6Nx–VEH group compared with the sham–VEH group, and neither factor recovered on AST‐120 treatment.
Table 4.
Biochemical Parameters
| Sham+VEH | Sham+AST‐120 | 5/6Nx+VEH | 5/6Nx+AST‐120 | |
|---|---|---|---|---|
| Hemoglobin, g/dL | 15.5±0.3 | 15.6±0.5 | 12.5±0.7b | 12.2±0.6b |
| Albumin, g/dL | 3.68±0.0 | 3.65±0.07 | 3.30±0.09a | 3.48±0.05 |
| TC, mg/dL | 46.8±4.2 | 50.8±3.0 | 81.4±4.5a | 89.5±6.5b |
| LDL, mg/dL | 5.3±0.7 | 7.0±1.0 | 10.9±0.8a | 10.4±0.9a |
| FBS, mg/dL | 88.8±6.7 | 88.4±3.5 | 83.6±8.3 | 89.8±6.1 |
| BUN, mg/dL | 17.6±0.8 | 16.1±1.6 | 70.8±7.6b | 65.3±7.4b |
| Cr, mg/dL | 0.34±0.05 | 0.34±0.06 | 1.06±0.10b | 0.97±0.08b |
| CCr, mL/min | 3.10±0.40 | 3.02±0.39 | 0.88±0.09b | 0.87±0.14b |
| UP, mg/mL | 0.13±0.01 | 0.12±0.02 | 0.47±0.16a | 0.51±0.16a |
n=8 for each group. Data are shown as mean±SE. 5/6Nx indicates 5/6 nephrectomized rats; BUN, blood urea nitrogen; CCr, creatinine clearance; Cr, creatinine; FBS, fasting blood sugar; LDL, low‐density lipoprotein cholesterol; TC, total cholesterol; UP, urine protein; Sham, sham‐operated rats; VEH, vehicle.
P<0.05 vs Sham plus VEH;
P<0.01 vs Sham plus VEH.
Serum Levels of IS
Serum levels of IS were significantly increased in the 5/6Nx–VEH group compared with the sham–VEH group, which was significantly attenuated by AST‐120 treatment for 4 weeks (Figure 2) (n=8 for each group). There was no significant difference between the sham–VEH and sham–AST‐120 groups.
Figure 2.
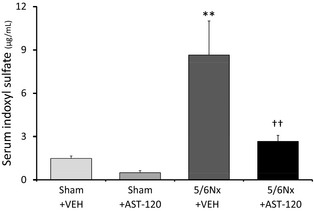
Serum levels of IS. Serum levels of IS increased significantly in the 5/6Nx–VEH group compared with the Sham–VEH group and was significantly inhibited by AST‐120. n=8 for each group. Data are shown as mean±SE. **P<0.01 vs Sham plus VEH. †† P<0.01 vs 5/6Nx plus VEH. 5/6Nx indicates 5/6 nephrectomy; IS, indoxyl sulfate; Sham, sham procedure; VEH, vehicle.
Oxidative Stress in the LA
To indirectly investigate reactive oxygen species levels in this model, we assayed MDA expression in rat atrial tissue. MDA expression was significantly upregulated in the 5/6Nx–VEH group compared with the sham–VEH group and was significantly attenuated by AST‐120 treatment (Figure 3) (n=5 for each group). Expression of NADPH oxidase subunits (a major site of reactive oxygen species production) was also investigated. Expression of NOX2 and NOX4 was significantly upregulated in the 5/6Nx–VEH group compared with the sham–VEH group and was attenuated by AST‐120 treatment (Figure 3) (n=5 for each group).
Figure 3.
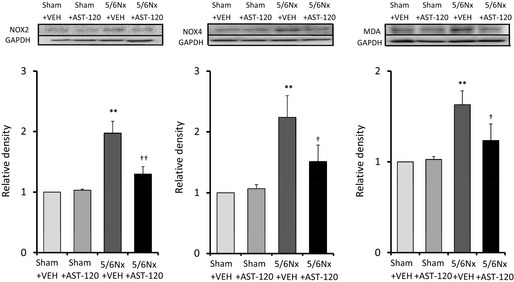
Oxidative stress in the left atrium. Expression of NOX2, NOX4, and MDA was upregulated in the 5/6Nx–VEH group and was significantly attenuated by AST‐120 treatment. n=5 for each group. Data are shown as mean±SE. **P<0.01 vs Sham plus VEH. † P<0.05. †† P<0.01 vs 5/6Nx plus VEH. 5/6Nx indicates 5/6 nephrectomy; MDA, malondialdehyde; NOX, NADPH oxidase; Sham, sham procedure; VEH, vehicle.
Proinflammatory Signaling in the LA
Inflammation is another facilitator of AF. Expression of CD68, MCP‐1, and VCAM‐1 in LA tissue was significantly upregulated in the 5/6Nx–VEH group compared with the sham–VEH group and was significantly attenuated by AST‐120 treatment (Figure 4) (n=6 for each group). Figure 5A and 5B shows immunohistochemical staining with anti‐MCP‐1 and anti‐VCAM‐1 in the endothelia of LAs. Brown staining (black arrows) indicates expression of MCP‐1 (Figure 5A) and VCAM‐1 (Figure 5B). Expression of MCP‐1 and VCAM‐1 was significantly increased in the 5/6Nx–VEH group compared with sham‐operated groups and was remarkably attenuated by AST‐120 treatment. Figure 5C and 5D show the representative immunofluorescent staining and quantitative analyses of CD68‐positive cells in LA tissue. There were many more CD68‐positive cells in the 5/6Nx–VEH group than in sham‐operated groups, and they were significantly suppressed by AST‐120 treatment. Figure 5E demonstrates double immunostaining with anti‐MCP‐1 and anti‐collagen type‐1 in LA. Expression of collagen type 1 (red staining) increased in accordance with the upregulation of MCP‐1 (white arrows) in the 5/6Nx–VEH group.
Figure 4.

Expression of proinflammatory factors in the left atrium. Expression of CD68, MCP‐1, and VCAM‐1 was significantly upregulated in the 5/6Nx–VEH group compared with the Sham–VEH group. This increase was significantly attenuated in the 5/6Nx–AST‐120 group. n=6 for each group. Data are shown as mean±SE. **P<0.01 vs Sham plus VEH. † P<0.05. †† P<0.01 vs 5/6Nx plus VEH. 5/6Nx indicates 5/6 nephrectomy; MCP‐1, monocyte chemoattractant protein 1; Sham, sham procedure; VCAM‐1, vascular cell adhesion molecule 1; VEH, vehicle.
Figure 5.
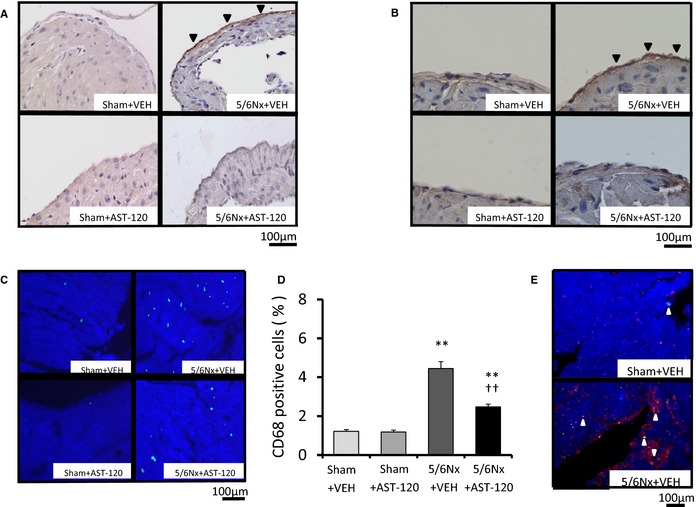
Immunohistochemical assay for proinflammatory factors. A and B, Brown immunostaining (black arrows) indicates expression of MCP‐1 (×400 magnification) and VCAM‐1 (×400 magnification) in the LA. Increased expression of MCP‐1 and VCAM‐1 was observed in the 5/6Nx–VEH group compared with sham‐operated groups, and both were attenuated by AST‐120 treatment. C and D, Representative immunofluorescent staining of CD68 (×400 magnification) and quantitative analyses of CD68‐positive cells revealed that more CD68‐positive cells were in the 5/6Nx–VEH group compared with sham‐operated groups, and cells were significantly suppressed by AST‐120 in LA tissue. E, Representative immunofluorescent double staining with anti‐MCP‐1 and anti‐collagen type 1 in LA demonstrated that expression of collagen type 1 (red staining) increased in accordance with the upregulation of MCP‐1 (white arrows) in the 5/6Nx–VEH group. n=6 for each group. Data are shown as mean±SE. **P<0.01 vs Sham plus VEH. †† P<0.01 vs 5/6Nx plus VEH. 5/6Nx indicates 5/6 nephrectomy; LA, left atrium; MCP‐1, monocyte chemoattractant protein 1; Sham, sham procedure; VCAM‐1, vascular cell adhesion molecule 1; VEH, vehicle.
Electron Micrographs of Monocytes on the Left Atrial Endothelium
In the 5/6Nx–VEH group, monocyte adhesion to endothelial cells and monocyte infiltration into connective tissues in LA were observed with scanning electron microscopy (Figure 6A) and transmission electron microscopy (Figure 6B). In sham groups and the 5/6Nx–AST‐120 group, monocyte on LA endothelium was not observed.
Figure 6.
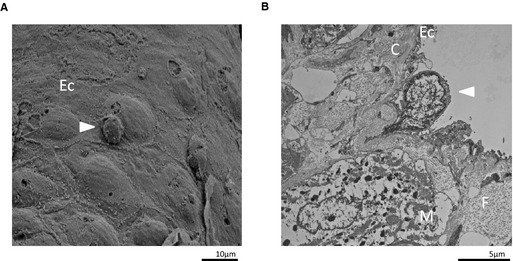
Electron micrographs of monocytes on the LA endothelium. A, Scanning electron micrograph of the inner surface of the LA in the 5/6Nx–VEH group 28 days after 5/6Nx treatment. The white arrow indicates monocyte adhesion to endothelial cells (×2000 magnification). B, Transmission electron micrograph of the cross‐section of the LA in the 5/6Nx–VEH group 28 days after 5/6Nx treatment. The white arrow indicates monocyte infiltration into connective tissues (×5000 magnification). 5/6Nx indicates 5/6 nephrectomy; C, connective tissue; Ec, endothelial cell; F, collagen fiber; LA, left atrium; M, atrial muscle; VEH, vehicle.
Profibrotic Signaling and Interstitial Fibrosis in RA, LA, and LV
Figure 7 shows the quantitative analyses of profibrotic factors in LA tissue (n=6 for each group). Expression of transforming growth factor β1, α‐smooth muscle actin, and collagen type 1 was upregulated in the 5/6Nx–VEH group compared with the sham–VEH group and was significantly attenuated by AST‐120 treatment. Figures 8 and 9 demonstrate the representative images and quantitative ratio of the area of fibrosis obtained by the Masson trichrome staining of LA and LV tissue (n=7 for each group). Blue staining indicates interstitial fibrosis. Extensive and heterogeneous interstitial fibrosis was observed in the 5/6Nx–VEH group and was reduced in the 5/6Nx–AST‐120 group. Figure 10 demonstrates the distribution of interstitial fibrosis in LA and in LA and RA appendages in the 5/6Nx–VEH and sham–VEH groups (n=5 for each group). There were no significant differences in the distribution of fibrosis in the 5/6Nx–VEH and sham–VEH groups.
Figure 7.
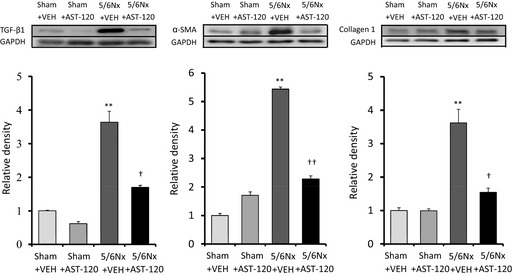
Expression of profibrotic factors in the LA. Expression of TGF‐β1, α‐SMA, and collagen type 1 was significantly upregulated in the 5/6Nx–VEH group compared with the Sham–VEH group. This increase was significantly attenuated in the 5/6Nx–AST‐120 group. n=6 for each group. Data are shown as mean±SE. **P<0.01 vs Sham plus VEH. † P<0.05. †† P<0.01 vs 5/6Nx plus VEH. 5/6Nx indicates 5/6 nephrectomy; α‐SMA, α‐smooth muscle actin; LA, left atrium; Sham, sham procedure; TGF, transforming growth factor; VEH, vehicle.
Figure 8.
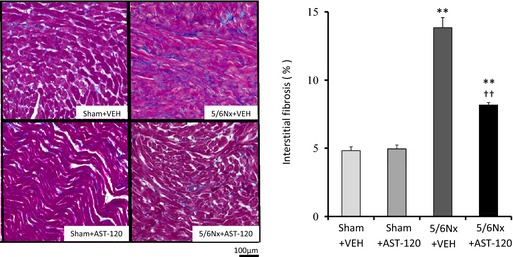
Left atrial interstitial fibrosis. Representative images and quantitative results of LA fibrosis evaluated by staining using Masson trichrome (×400 magnification). Blue staining indicates interstitial fibrosis. LA fibrosis was significantly increased in 5/6Nx groups compared with those of sham‐operated groups and was significantly attenuated by AST‐120 treatment. n=7 for each group. Data are shown as mean±SE. **P<0.01 vs Sham plus VEH. †† P<0.01 vs 5/6Nx plus VEH. 5/6Nx indicates 5/6 nephrectomy; LA, left atrium; Sham, sham procedure; VEH, vehicle.
Figure 9.
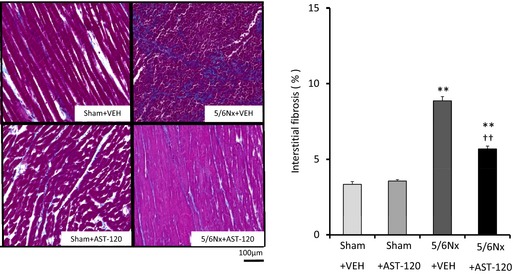
Left ventricular interstitial fibrosis. Representative images and quantitative analyses of interstitial fibrosis in the left ventricle by Masson trichrome staining (×400 magnification). Blue staining indicates interstitial fibrosis. Left ventricular fibrosis was increased in 5/6Nx groups compared with sham groups and was significantly attenuated by AST‐120 treatment. n=7 for each group. Data are shown as mean±SE. **P<0.01 vs Sham plus VEH. †† P<0.01 vs 5/6Nx plus VEH. 5/6Nx indicates 5/6 nephrectomy; Sham, sham procedure; VEH, vehicle.
Figure 10.
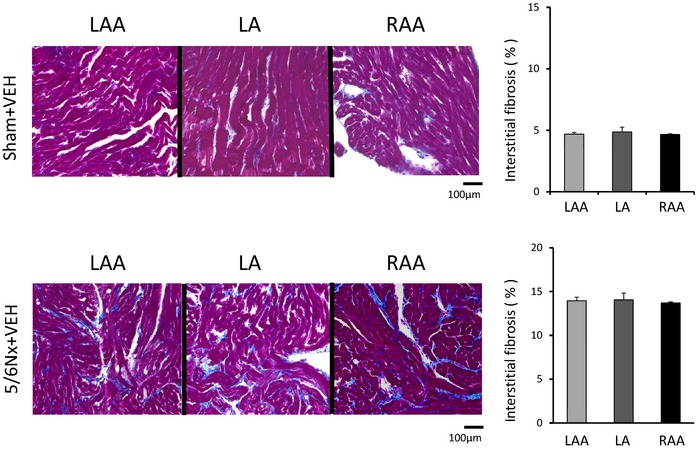
Interstitial fibrosis in LA and in RAA and LAA. Representative images and quantitative results of interstitial fibrosis in LA, RAA, and LAA by Masson trichrome staining (×400 magnification). Blue staining indicates interstitial fibrosis. There were no significant differences in the distribution of fibrosis in the 5/6Nx–VEH and Sham–VEH groups. n=5 for each group. Data are shown as mean±SE. 5/6Nx indicates 5/6 nephrectomy; LA, left atrium; LAA, LA appendage; RA, right atrium; RAA, RA appendage; Sham, sham procedure; VEH, vehicle.
Effects of IS on Cultured Fibroblasts
To investigate the direct effects of IS in vitro, we isolated fibroblasts from the atria of Sprague–Dawley rats. Incubating fibroblasts in a medium containing IS (150 μmol/L) for 72 hours increased expression of MDA, NOX2, and NOX4 (Figure 11B) (n=5 for each group). Expression of proinflammatory and profibrotic signaling molecules, such as MCP‐1, transforming growth factor β1, α‐smooth muscle actin, and collagen type 1, was also upregulated in fibroblasts by incubation with IS for 72 hours (Figure 11A and 11C). Figure 11D demonstrates that expression of transforming growth factor β1 and α‐smooth muscle actin was upregulated in a dose‐dependent manner by incubation with IS for 48 hours.
Figure 11.
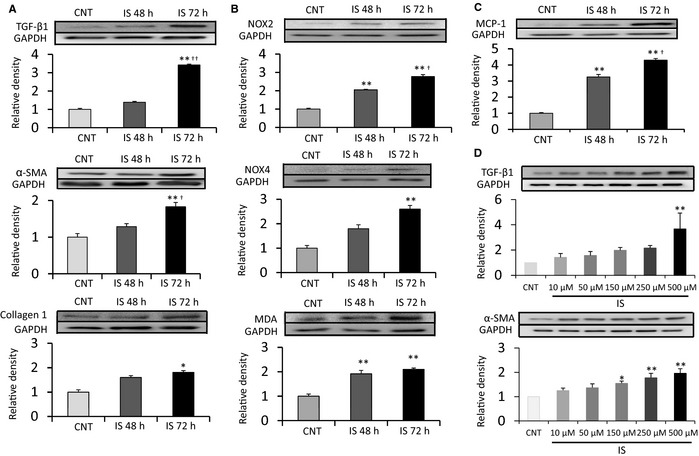
Effects of IS on cultured atrial fibroblasts. A through C, Cultured atrial fibroblasts were incubated with IS (150 μmol/L) for the indicated time periods. Addition of IS for 72 hours upregulated expression of TGF‐β1, α‐SMA, collagen type‐1, NOX2, NOX4, MDA, and MCP‐1 compared with those in CNT group. D, Cultured atrial fibroblasts were incubated with the indicated concentrations of IS for 48 hours. IS upregulated the expression of TGF‐β1 and α‐SMA in a dose‐dependent manner. A through C, n=5 for each group. Data are the mean±SE. *P<0.05, **P<0.01 vs CNT; † P<0.05, †† P<0.01 vs IS 48 hours. D, n=4 for each group. Data are the mean±SE. *P<0.05, **P<0.01 vs CNT. α‐SMA indicates α‐smooth muscle actin; CNT, control; IS, indoxyl sulfate; MCP‐1, monocyte chemoattractant protein 1; MDA, malondialdehyde; NOX, NADPH oxidase; TGF‐β1, transforming growth factor β1.
Electrophysiological Studies and AF Induction
Figure 12A shows representative ECG recordings of AF triggered by S3 extrastimulus pacing in the 5/6Nx–VEH group. AF was identified by a rapid and chaotic atrial rhythm and an irregular ventricular response. Prevalence of AF induced by double extrastimuli under Langendorff perfusion was significantly increased in the 5/6Nx–VEH group compared with the sham‐operated group and was significantly attenuated in the 5/6Nx–AST‐120 group (Figure 12B) (n=7 for each group). The interatrial conduction time and effective refractory period were measured in each group for basic cycle lengths of 200, 150, 120, and 90 ms. The interatrial conduction time was significantly prolonged at all basic cycle lengths tested in the 5/6Nx–VEH group; this prolongation was significantly reduced in the 5/6Nx–AST‐120 group (Figure 12C) (n=7 for each group). There were no significant differences in the effective refractory period of LA tissues among the 4 groups (Figure 12D) (n=7 for each group). Average duration of AF tended to be longer in the 5/6Nx–VEH group (5.88 seconds; n=7) than in the 5/6Nx–AST‐120 group (1.66 seconds; n=2) (Figure 12E).
Figure 12.
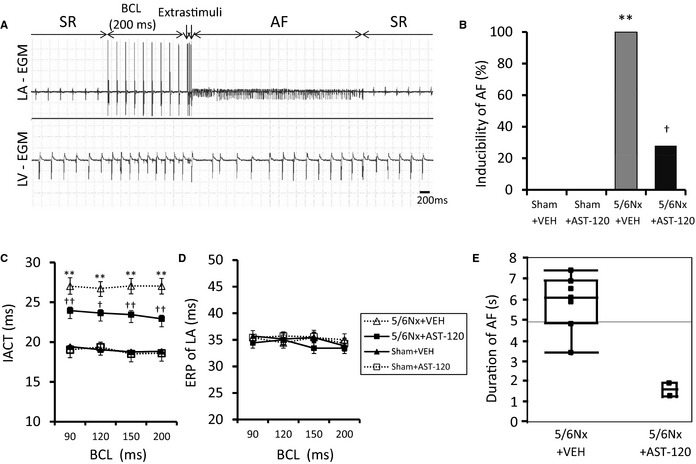
Electrophysiological studies and AF induction. A, Representative induction of AF. B, Quantitative analyses of AF inducibility. C, IACT. D, ERP in the LA. E, Duration of AF. AF was invariably induced in the 5/6Nx–VEH group and was significantly suppressed by AST‐120 treatment. The IACT was prolonged in the 5/6Nx–VEH group compared with sham‐operated groups in each BCL and was significantly improved by AST‐120 treatment. No significant differences were observed in the ERP among the 4 experimental groups. Average duration of AF tended to be longer in the 5/6Nx–VEH group than in the 5/6Nx–AST‐120 group. A through D, n=7 for each group. Data are shown as mean±SE. **P<0.01 vs Sham plus VEH. † P<0.05. †† P<0.01 vs 5/6Nx plus VEH. E, n=7 for the 5/6Nx–VEH group and n=2 for the 5/6Nx–AST‐120 group. The results are presented as a box plot that shows median, upper and lower quartiles, and range. 5/6Nx indicates 5/6 nephrectomy; AF, atrial fibrillation; BCL, basic cycle length; EGM, electrogram; ERP, effective refractory period; IACT, interatrial conduction time; LA, left atrium; LV, left ventricle; Sham, sham procedure; SR, sinus rhythm; VEH, vehicle.
Discussion
This study had the following core findings: (1) 5/6Nx increases the serum level of IS, oxidative stress, inflammation, and fibrosis in the LA; (2) these changes induced by 5/6Nx were attenuated by AST‐120 treatment; (3) in in vitro experiments, IS addition on cultured atrial fibroblasts upregulated the markers of oxidative stress, inflammation, and profibrotic signals; (4) AF was invariably induced by atrial extrastimuli in perfused hearts extracted from 5/6Nx rats and was attenuated by AST‐120 treatment.
Creatinine clearance in the 5/6Nx group was about one‐quarter that observed in sham‐operated rats, suggesting that 5/6Nx is an adequate model of renal dysfunction. Concomitantly, serum levels of IS were remarkably elevated by 5/6Nx, and treatment with AST‐120 almost completely suppressed this increase. LA enlargement and LV concentric hypertrophy observed in 5/6Nx groups were significantly prevented by AST‐120 treatment without significant improvement in systolic blood pressure, anemia, blood glucose levels, and renal function. These results suggest that LA enlargement may be attenuated by improvement of LV diastolic function and accumulating IS may directly contribute to the cardiac remodeling induced by renal dysfunction.
IS has been shown to increase oxidative stress and induce the production of reactive oxygen species via activation of NADPH oxidases.25, 26, 27, 28 NADPH oxidases are major sources of reactive oxygen species, and activation of NADPH oxidases was associated with the incidence of AF.29, 30, 31, 32, 33, 34, 35, 36 Furthermore, several studies demonstrated that oxidative stress plays an important role in renal dysfunction–induced cardiac fibrosis, and AST‐120 prevented cardiac damage by alleviating oxidative stress.13, 15 In the present study, expression of NOX2, a membrane‐spanning subunit of NADPH oxidases, and NOX4, which is predominantly localized in the mitochondria, was significantly upregulated in LA tissue isolated from 5/6Nx rats, and the expression of MDA was concomitantly upregulated. Consistently, circulating levels of MDA were elevated in patients with AF.37 Furthermore, we confirmed that IS directly increased the expression of NOX2 and NOX4 accompanied by the increase of MDA in cultured atrial fibroblasts. Taken together, it appears that IS exaggerates cardiac fibrosis in renal dysfunction by increasing reactive oxygen species via NADPH oxidases. This will exacerbate the development of AF substrates.
Inflammation is another critical factor in AF pathogenesis.18 A recent study showed that reduction of IS by AST‐120 can attenuate monocyte‐mediated inflammation in renal dysfunction.38 IS also stimulated expression of MCP‐1 (a chemokine required for monocyte accumulation) in human umbilical vein endothelial cells by inducing oxidative stress.39 Consistently, increased expression of MCP‐1, CD68, and VCAM‐1 in renal dysfunction was significantly attenuated by AST‐120 treatment in the present study. Consequently, monocyte‐mediated inflammation such as monocyte/macrophage infiltration in atrial tissue is likely to be a key process of atrial fibrosis induced by IS in renal dysfunction.
The interatrial conduction time was significantly prolonged without significant changes in the effective refractory period in LA tissue, and AF inducibility was enhanced in 5/6Nx groups in the present study. Renal dysfunction–induced structural remodeling such as interstitial fibrosis of atria may promote reentry and enhance AF inducibility by disturbances in atrial conduction.16, 17, 18 Chen et al recently reported the acute arrhythmogenic effects of IS in pulmonary veins and atria isolated from rabbit hearts.40 They showed that IS increased delayed after‐depolarizations and burst firings in pulmonary veins and also induced overload of intracellular calcium. In addition to these results, we showed that IS contributed to the inducibility of AF in the chronic phase of renal dysfunction in the present study.
Study Limitations
It is difficult to discuss the pathogenesis of AF from a single perspective because many factors (eg, oxidative stress, inflammation, hypertension, anemia and rennin–angiotensin system) contribute to the development of AF substrate in renal dysfunction. Although we did not observe significant improvement of renal function in the present study, AST‐120 treatment significantly improved renal function in a previous study41; therefore, we still cannot exclude the possible effects of improved renal function by AST‐120 treatment on cardiac remodeling. Furthermore, the present results showing that AST‐120 did not completely suppress cardiac remodeling and AF substrate may indicate the association of other factors in AF progression in renal dysfunction; for example, systemic hypertension may contribute, at least in part, to LV remodeling and diastolic dysfunction, which may be associated with LA enlargement and atrial fibrosis.
Conclusion
IS could be a predisposing factor for AF in renal dysfunction mediated by the progression of atrial remodeling involving oxidative stress, inflammation, and fibrosis. We propose that IS may be a promising therapeutic target for prevention of renal dysfunction–induced AF.
Sources of Funding
This study was supported by Grants‐in‐Aid for Scientific Research (C) 26462758 (Teshima) and 23592672 (Takahashi) from the Ministry of Education, Culture, Sports, Science, and Technology of Japan.
Disclosures
None.
Acknowledgments
We gratefully acknowledge the important advice and contributions of Hiroaki Kawazato and Aiko Yasuda (Division of Biomolecular Medicine and Medical Imaging Institute of Scientific Research, Faculty of Medicine, Oita University, Oita Japan) for carrying out electron microscopic studies. AST‐120 was kindly donated by Kureha Pharmaceuticals (Tokyo, Japan).
(J Am Heart Assoc. 2015;4:e002023 doi: 10.1161/JAHA.115.002023)
References
- 1. Benjamin EJ, Wolf PA, D'Agostino RB, Silbershatz H, Kannel WB, Levy D. Impact of atrial fibrillation on the risk of death: the Framingham Heart Study. Circulation. 1998;98:946–952. [DOI] [PubMed] [Google Scholar]
- 2. Go AS, Hylek EM, Phillips KA, Chang Y, Henault LE, Selby JV, Singer DE. Prevalence of diagnosed atrial fibrillation in adults: national implications for rhythm management and stroke prevention: the AnTicoagulation and Risk Factors in Atrial Fibrillation (ATRIA) Study. JAMA. 2001;285:2370–2375. [DOI] [PubMed] [Google Scholar]
- 3. Soliman EZ, Prineas RJ, Go AS, Xie D, Lash JP, Rahman M, Ojo A, Teal VL, Jensvold NG, Robinson NL, Dries DL, Bazzano L, Mohler ER, Wright JT, Feldman HI. Chronic kidney disease and prevalent atrial fibrillation: the Chronic Renal Insufficiency Cohort (CRIC). Am Heart J. 2010;159:1102–1107. [DOI] [PMC free article] [PubMed] [Google Scholar]
- 4. Alonso A, Lopez FL, Matsushita K, Loehr LR, Agarwal SK, Chen LY, Soliman EZ, Astor BC, Coresh J. Chronic kidney disease is associated with the incidence of atrial fibrillation: the Atherosclerosis Risk in Communities (ARIC) study. Circulation. 2011;123:2946–2953. [DOI] [PMC free article] [PubMed] [Google Scholar]
- 5. Baber U, Howard VJ, Halperin JL, Soliman EZ, Zhang X, McClellan W, Warnock DG, Muntner P. Association of chronic kidney disease with atrial fibrillation among adults in the United States: REasons for Geographic and Racial Differences in Stroke (REGARDS) Study. Circ Arrhythm Electrophysiol. 2011;4:26–32. [DOI] [PMC free article] [PubMed] [Google Scholar]
- 6. Bansal N, Fan D, Hsu CY, Ordonez JD, Marcus GM, Go AS. Incident atrial fibrillation and risk of end‐stage renal disease in adults with chronic kidney disease. Circulation. 2013;127:569–574. [DOI] [PMC free article] [PubMed] [Google Scholar]
- 7. Olesen JB, Lip GY, Kamper AL, Hommel K, Kober L, Lane DA, Lindhardsen J, Gislason GH, Torp‐Pedersen C. Stroke and bleeding in atrial fibrillation with chronic kidney disease. N Engl J Med. 2012;367:625–635. [DOI] [PubMed] [Google Scholar]
- 8. Fukunaga N, Takahashi N, Hagiwara S, Kume O, Fukui A, Teshima Y, Shinohara T, Nawata T, Hara M, Noguchi T, Saikawa T. Establishment of a model of atrial fibrillation associated with chronic kidney disease in rats and the role of oxidative stress. Heart Rhythm. 2012;9:2023–2031. [DOI] [PubMed] [Google Scholar]
- 9. Niwa T, Ise M. Indoxyl sulfate, a circulating uremic toxin, stimulates the progression of glomerular sclerosis. J Lab Clin Med. 1994;124:96–104. [PubMed] [Google Scholar]
- 10. Sun CY, Hsu HH, Wu MS. p‐Cresol sulfate and indoxyl sulfate induce similar cellular inflammatory gene expressions in cultured proximal renal tubular cells. Nephrol Dial Transplant. 2013;28:70–78. [DOI] [PubMed] [Google Scholar]
- 11. Ito S, Osaka M, Higuchi Y, Nishijima F, Ishii H, Yoshida M. Indoxyl sulfate induces leukocyte‐endothelial interactions through up‐regulation of E‐selectin. J Biol Chem. 2010;285:38869–38875. [DOI] [PMC free article] [PubMed] [Google Scholar]
- 12. Vaziri ND, Yuan J, Khazaeli M, Masuda Y, Ichii H, Liu S. Oral activated charcoal adsorbent (AST‐120) ameliorates chronic kidney disease‐induced intestinal epithelial barrier disruption. Am J Nephrol. 2013;37:518–525. [DOI] [PMC free article] [PubMed] [Google Scholar]
- 13. Fujii H, Nishijima F, Goto S, Sugano M, Yamato H, Kitazawa R, Kitazawa S, Fukagawa M. Oral charcoal adsorbent (AST‐120) prevents progression of cardiac damage in chronic kidney disease through suppression of oxidative stress. Nephrol Dial Transplant. 2009;24:2089–2095. [DOI] [PubMed] [Google Scholar]
- 14. Lekawanvijit S, Adrahtas A, Kelly DJ, Kompa AR, Wang BH, Krum H. Does indoxyl sulfate, a uraemic toxin, have direct effects on cardiac fibroblasts and myocytes? Eur Heart J. 2010;31:1771–1779. [DOI] [PubMed] [Google Scholar]
- 15. Lekawanvijit S, Kompa AR, Manabe M, Wang BH, Langham RG, Nishijima F, Kelly DJ, Krum H. Chronic kidney disease‐induced cardiac fibrosis is ameliorated by reducing circulating levels of a non‐dialysable uremic toxin, indoxyl sulfate. PLoS One. 2012;7:e41281. [DOI] [PMC free article] [PubMed] [Google Scholar]
- 16. Frustaci A, Chimenti C, Bellocci F, Morgante E, Russo MA, Maseri A. Histological substrate of atrial biopsies in patients with lone atrial fibrillation. Circulation. 1997;96:1180–1184. [DOI] [PubMed] [Google Scholar]
- 17. Nattel S, Burstein B, Dobrev D. Atrial remodeling and atrial fibrillation: mechanisms and implications. Circ Arrhythm Electrophysiol. 2008;1:62–73. [DOI] [PubMed] [Google Scholar]
- 18. Issac TT, Dokainish H, Lakkis NM. Role of inflammation in initiation and perpetuation of atrial fibrillation: a systematic review of the published data. J Am Coll Cardiol. 2007;50:2021–2028. [DOI] [PubMed] [Google Scholar]
- 19. Owada S, Goto S, Bannai K, Hayashi H, Nishijima F, Niwa T. Indoxyl sulfate reduces superoxide scavenging activity in the kidneys of normal and uremic rats. Am J Nephrol. 2008;28:446–454. [DOI] [PubMed] [Google Scholar]
- 20. Kume O, Takahashi N, Wakisaka O, Nagano‐Torigoe Y, Teshima Y, Nakagawa M, Yufu K, Hara M, Saikawa T, Yoshimatsu H. Pioglitazone attenuates inflammatory atrial fibrosis and vulnerability to atrial fibrillation induced by pressure overload in rats. Heart Rhythm. 2011;8:278–285. [DOI] [PubMed] [Google Scholar]
- 21. Fukui A, Takahashi N, Nakada C, Masaki T, Kume O, Shinohara T, Teshima Y, Hara M, Saikawa T. Role of leptin signaling in the pathogenesis of angiotensin II‐mediated atrial fibrosis and fibrillation. Circ Arrhythm Electrophysiol. 2013;6:402–409. [DOI] [PubMed] [Google Scholar]
- 22. Wakisaka O, Takahashi N, Shinohara T, Ooie T, Nakagawa M, Yonemochi H, Hara M, Shimada T, Saikawa T, Yoshimatsu H. Hyperthermia treatment prevents angiotensin II‐mediated atrial fibrosis and fibrillation via induction of heat‐shock protein 72. J Mol Cell Cardiol. 2007;43:616–626. [DOI] [PubMed] [Google Scholar]
- 23. Shimada T, Kawazato H, Yasuda A, Ono N, Sueda K. Cytoarchitecture and intercalated disks of the working myocardium and the conduction system in the mammalian heart. Anat Rec A Discov Mol Cell Evol Biol. 2004;280:940–951. [DOI] [PubMed] [Google Scholar]
- 24. Ono N, Yamaguchi T, Ishikawa H, Arakawa M, Takahashi N, Saikawa T, Shimada T. Morphological varieties of the Purkinje fiber network in mammalian hearts, as revealed by light and electron microscopy. Arch Histol Cytol. 2009;72:139–149. [DOI] [PubMed] [Google Scholar]
- 25. Dou L, Jourde‐Chiche N, Faure V, Cerini C, Berland Y, Dignat‐George F, Brunet P. The uremic solute indoxyl sulfate induces oxidative stress in endothelial cells. J Thromb Haemost. 2007;5:1302–1308. [DOI] [PubMed] [Google Scholar]
- 26. Shimoishi K, Anraku M, Kitamura K, Tasaki Y, Taguchi K, Hashimoto M, Fukunaga E, Maruyama T, Otagiri M. An oral adsorbent, AST‐120 protects against the progression of oxidative stress by reducing the accumulation of indoxyl sulfate in the systemic circulation in renal failure. Pharm Res. 2007;24:1283–1289. [DOI] [PubMed] [Google Scholar]
- 27. Nii‐Kono T, Iwasaki Y, Uchida M, Fujieda A, Hosokawa A, Motojima M, Yamato H, Kurokawa K, Fukagawa M. Indoxyl sulfate induces skeletal resistance to parathyroid hormone in cultured osteoblastic cells. Kidney Int. 2007;71:738–743. [DOI] [PubMed] [Google Scholar]
- 28. Nakagawa N, Hasebe N, Sumitomo K, Fujino T, Fukuzawa J, Hirayama T, Kikuchi K. An oral adsorbent, AST‐120, suppresses oxidative stress in uremic rats. Am J Nephrol. 2006;26:455–461. [DOI] [PubMed] [Google Scholar]
- 29. Dudley SC Jr, Hoch NE, McCann LA, Honeycutt C, Diamandopoulos L, Fukai T, Harrison DG, Dikalov SI, Langberg J. Atrial fibrillation increases production of superoxide by the left atrium and left atrial appendage: role of the NADPH and xanthine oxidases. Circulation. 2005;112:1266–1273. [DOI] [PubMed] [Google Scholar]
- 30. Yeh YH, Kuo CT, Chang GJ, Qi XY, Nattel S, Chen WJ. Nicotinamide adenine dinucleotide phosphate oxidase 4 mediates the differential responsiveness of atrial versus ventricular fibroblasts to transforming growth factor‐β. Circ Arrhythm Electrophysiol. 2013;6:790–798. [DOI] [PubMed] [Google Scholar]
- 31. Purohit A, Rokita AG, Guan X, Chen B, Koval OM, Voigt N, Neef S, Sowa T, Gao Z, Luczak ED, Stefansdottir H, Behunin AC, Li N, El‐Accaoui RN, Yang B, Swaminathan PD, Weiss RM, Wehrens XH, Song LS, Dobrev D, Maier LS, Anderson ME. Oxidized Ca2+/calmodulin‐dependent protein kinase II triggers atrial fibrillation. Circulation. 2013;128:1748–1757. [DOI] [PMC free article] [PubMed] [Google Scholar]
- 32. Kim YM, Guzik TJ, Zhang YH, Zhang MH, Kattach H, Ratnatunga C, Pillai R, Channon KM, Casadei B. A myocardial Nox2 containing NAD(P)H oxidase contributes to oxidative stress in human atrial fibrillation. Circ Res. 2005;97:629–636. [DOI] [PubMed] [Google Scholar]
- 33. Toyama K, Yamabe H, Uemura T, Nagayoshi Y, Morihisa K, Koyama J, Kanazawa H, Hoshiyama T, Ogawa H. Analysis of oxidative stress expressed by urinary level of 8‐hydroxy‐2′‐deoxyguanosine and biopyrrin in atrial fibrillation: effect of sinus rhythm restoration. Int J Cardiol. 2013;168:80–85. [DOI] [PubMed] [Google Scholar]
- 34. Youn JY, Zhang J, Zhang Y, Chen H, Liu D, Ping P, Weiss JN, Cai H. Oxidative stress in atrial fibrillation: an emerging role of NADPH oxidase. J Mol Cell Cardiol. 2013;62:72–79. [DOI] [PMC free article] [PubMed] [Google Scholar]
- 35. Rodrigo R, Korantzopoulos P, Cereceda M, Asenjo R, Zamorano J, Villalabeitia E, Baeza C, Aguayo R, Castillo R, Carrasco R, Gormaz JG. A randomized controlled trial to prevent post‐operative atrial fibrillation by antioxidant reinforcement. J Am Coll Cardiol. 2013;62:1457–1465. [DOI] [PubMed] [Google Scholar]
- 36. Saito S, Teshima Y, Fukui A, Kondo H, Nishio S, Nakagawa M, Saikawa T, Takahashi N. Glucose fluctuations increase the incidence of atrial fibrillation in diabetic rats. Cardiovasc Res. 2014;104:5–14. [DOI] [PubMed] [Google Scholar]
- 37. Leftheriotis DI, Fountoulaki KT, Flevari PG, Parissis JT, Panou FK, Andreadou IT, Venetsanou KS, Iliodromitis EK, Kremastinos DT. The predictive value of inflammatory and oxidative markers following the successful cardioversion of persistent lone atrial fibrillation. Int J Cardiol. 2009;135:361–369. [DOI] [PubMed] [Google Scholar]
- 38. Ito S, Higuchi Y, Yagi Y, Nishijima F, Yamato H, Ishii H, Osaka M, Yoshida M. Reduction of indoxyl sulfate by AST‐120 attenuates monocyte inflammation related to chronic kidney disease. J Leukoc Biol. 2013;93:837–845. [DOI] [PubMed] [Google Scholar]
- 39. Masai N, Tatebe J, Yoshino G, Morita T. Indoxyl sulfate stimulates monocyte chemoattractant protein‐1 expression in human umbilical vein endothelial cells by inducing oxidative stress through activation of the NADPH oxidase‐nuclear factor‐kappaB pathway. Circ J. 2010;74:2216–2224. [DOI] [PubMed] [Google Scholar]
- 40. Chen WT, Chen YC, Hsieh MH, Huang SY, Kao YH, Chen YA, Lin YK, Chen SA, Chen YJ. The uremic toxin indoxyl sulfate increases pulmonary vein and atrial arrhythmogenesis. J Cardiovasc Electrophysiol. 2015;26:203–210. [DOI] [PubMed] [Google Scholar]
- 41. Shibahara H, Shibahara N. Cardiorenal protective effect of the oral uremic toxin absorbent AST‐120 in chronic heart disease patients with moderate CKD. J Nephrol. 2010;23:535–540. [PubMed] [Google Scholar]