Abstract
Background
Gut microbiota has been suggested to play a role in almost all major diseases including cardio‐ and cerebrovascular diseases. A possible mechanism is the transformation of dietary choline and l‐carnitine into trimethylamine by gut bacteria. This metabolite is further oxidized into trimethylamine‐N‐oxide (TMAO) in liver and promotes atherogenesis. Nevertheless, little is known about gut microbial diversity and blood TMAO levels in stroke patients.
Methods and Results
We performed a case‐control study of patients with large‐artery atherosclerotic ischemic stroke and transient ischemic attack. TMAO was determined with liquid chromatography tandem mass spectrometry. Gut microbiome was profiled using Illumina sequencing of the 16S rRNA V4 tag. Within the asymptomatic control group, participants with and without carotid atherosclerotic plaques showed similar levels of TMAO without a significant difference in gut microbiota; however, the gut microbiome of stroke and transient ischemic attack patients was clearly different from that of the asymptomatic group. Stroke and transient ischemic attack patients had more opportunistic pathogens, such as Enterobacter, Megasphaera, Oscillibacter, and Desulfovibrio, and fewer commensal or beneficial genera including Bacteroides, Prevotella, and Faecalibacterium. This dysbiosis was correlated with the severity of the disease. The TMAO level in the stroke and transient ischemic attack patients was significantly lower, rather than higher, than that of the asymptomatic group.
Conclusions
Participants with asymptomatic atherosclerosis did not exhibit an obvious change in gut microbiota and blood TMAO levels; however, stroke and transient ischemic attack patients showed significant dysbiosis of the gut microbiota, and their blood TMAO levels were decreased.
Keywords: atherosclerosis, gut microbiome, stroke/transient ischemic attack, trimethylamine‐N‐oxide
Introduction
Dysbiosis of the gut microbiota has recently been found to be essential for the development of a variety of diet‐induced chronic inflammatory diseases, such as obesity, type 2 diabetes, and nonalcoholic fatty liver disease.1, 2, 3 Gut microbes transform phosphatidylcholine and l‐carnitine from ingested nutrients to trimethylamine, which is absorbed and further oxidized by hepatic flavin monooxygenase to trimethylamine‐N‐oxide (TMAO), a metabolite that could promote atherogenesis partly by promoting the formation of foam cells from macrophages.4, 5 The blood TMAO level has been reported to be positively correlated with long‐term mortality risk in patients with atherosclerosis, heart failure, and chronic kidney disease.5, 6, 7 In addition to the trimethylamine pathway, a metagenomic study suggested that symptomatic atherosclerosis was associated with an altered gut microbiome.8 These results suggest potentially important roles for gut microbiota in cardio‐ and cerebrovascular diseases including stroke and transient ischemic attack (TIA); however, these diseases have rarely been examined with respect to TMAO level and gut microbiota.
Methods
Research Participants and Sample Collection
We recruited large‐artery atherosclerotic ischemic stroke and TIA patients for study and asymptomatic persons undergoing physical examinations as controls. We did not use an age‐ and sex‐matching strategy in our selection of controls and patients but set the age range from 18 to 80 years. The participants in the patient group were consecutively recruited from the Department of Neurology, and the control group was recruited from the Health Examination Center of Nanfang Hospital (a teaching hospital affiliated with Southern Medical University in southern China). From February 2014 to February 2015, patients initially diagnosed with acute ischemic stroke and considered to have large‐artery atherosclerosis, by Trial of Org 10172 in Acute Stroke Treatment (TOAST) classification, or TIA were consecutively recruited. The following inclusion criteria were used: proven stroke or TIA due to cerebral infarction (according to standard clinical criteria with supporting brain imaging consisting of either computed tomography or magnetic resonance imaging and magnetic resonance angiography) and large‐artery atherosclerosis stroke subtype according to the TOAST classification system. Patients aged <18 years or with radiological evidence of intracerebral hemorrhage, a clear cause of stroke or TIA unrelated to atherosclerosis (eg, cervical artery dissection, perivascular procedural stroke, cardioembolism stroke, or the other TOAST subtypes), severe comorbid illness or an unstable medical condition (eg, congestive cardiac failure, respiratory failure, renal failure, or severe liver dysfunction), or consumption of probiotics or antibiotics within 1 month before admission were excluded. Color Doppler flow imaging showed that 62 patients with significant hemodynamic stenosis (7 considered to have carotid occlusion), 148 patients with no significant hemodynamic stenosis but with minor plaques, and 85 patients with significant carotid plaques were included. The first fasting blood samples were drawn from all participants within 24 hours after admission, and their first available fecal samples within 48 hours after admission were collected. The control group consisted of asymptomatic participants (not in any acute disease state by the report of physical examination and self‐report). Control participants did not use any type of antibiotics or probiotics within 1 month before admission or suffer from previous or current cerebrovascular diseases. All control participants completed color Doppler flow imaging, transcranial Doppler sonography, and echocardiography to determine their cardiovascular conditions. The asymptomatic control group was further divided into 3 subgroups based on the color Doppler flow imaging analyses. The AS group contained participants with obvious carotid plaques, the IMT group consisted of participants with increased intima–media thickness of the carotid arterial wall, and the remaining participants exhibited healthy carotid arteries and were defined as the non‐AS group.
For all participants, fasting EDTA–plasma samples, fresh fecal samples, and associated clinical data were collected. Plasma aliquots were centrifuged and immediately frozen at −80°C. Fecal sample aliquots were frozen at −80°C immediately after collection. All participants (or their direct relatives) gave written informed consent, and the ethics committee of Southern Medical University approved all study protocols.
Fecal DNA Extraction
The bacterial DNA was extracted from the fecal samples using the PowerSoil DNA Extraction Kit (Mo Bio), according to the manufacturer's instructions.9
Polymerase Chain Reaction Amplification of the V4 Region of Bacterial 16S rRNA Genes
The V4 variable regions of the bacterial 16S rRNA gene were amplified by polymerase chain reaction using the bar‐coded primers 514F (GTGCCAGCMGCCGCGGTAA) and 805R (GGACTACHVGGGTWTCTAAT). The polymerase chain reaction cycle conditions were described previously10: An initial denaturation at 94°C for 2 minutes; 30 cycles at 94°C for 30 seconds, at 52°C for 30 seconds, and at 72°C for 45 seconds; and a final extension at 72°C for 5 minutes. Each 25‐μL reaction consisted of 0.5 μL of template DNA, 2.0 μL of dNTP Mix (2.5 mmol/L; TaKaRa), 2.5 μL of TaKaRa 10×Ex Taq buffer (Mg2+ free), 1.5 μL of Mg2+ (25 mmol/L), 0.25 μL of TaKaRa Ex Taq DNA polymerase (2.5 units), 0.5 μL of 10 μmol/L bar code primer 514F, 0.5 μL of 10 μmol/L primer 805R, and 17.25 μL of double‐distilled water. All dilutions were carried out using sterile double‐distilled water.
Sequencing and Microbiome Data Analysis
All polymerase chain reaction products were mixed together and sent to Beijing Genomic Institute for sequencing using the Illumina Miseq (PE 150), according to the manufacturer's protocol. The raw sequences were preprocessed according to the BIPES protocol.10
We used QIIME (1.8.0) to perform the basic analyses as follows.11 Sequences were clustered into operational taxonomic units (OTUs) using the Usearch algorithm.12 Representative sequences for each OTU were determined based on sequence frequency, and representative sequences were aligned using PyNAST algorithms.13 Phylogenetic relationships were determined based on representative sequence alignment using FastTree.14 Taxonomic assignments for each representative sequence were determined, and the above information was combined to construct the BIOM file15 using the command pick_de_novo_otus.py –i clean.fasta –o output_dir. The command beta_diversity_through_plots.py –i otu.biom –o output_dir was used for the principal coordinate analysis (PCoA). All samples were normalized for the subsequent analysis. The sequences were deposited in the Sequence Read Archive database, and the accession numbers ranged from ERS725509 to ERS725741.
Random forest classification models were trained on features of the OTU data using the caret R package to classify samples from stroke patients and healthy controls.16 Training was achieved through 10‐fold cross‐validation and optimized using the area under the curve derived from receiver operating characteristic analysis. The receiver operating characteristic analysis was used to overcome the uneven distribution of the 2 sample types in this study.17
To determine the significantly differential taxa between stroke patients and healthy controls, we applied linear discriminant analysis effect size (LEfSe) to compare samples between the 2 groups.18 The linear discriminant analysis threshold was set to 3. LEfSe is an algorithm for high‐dimensional biomarker discovery; it identifies genomic features characterizing differences between ≥2 biological conditions. LEfSe determines the features most likely to explain differences between classes by coupling standard tests for statistical significance with additional tests encoding biological consistency and effect size. A linear discriminant analysis value will be calculated for each of the differential features detected by LEfSe, and that value represents the differences of the feature between tested groups.
Quantification of Plasma TMAO
Plasma was stored at −80°C until analysis. The TMAO levels in plasma were determined using stable isotope dilution liquid chromatography tandem mass spectrometry (6460 Series Triple Quadrupole LC/MS; Agilent), as described previously.19
Plasma (50 μL) was aliquoted to a 1.5‐mL tube and mixed with 200 μL of a 10 μmol/L internal standard composed of d9‐TMAO in methanol. The samples were vortexed for 1 minute, and then the supernatant was recovered following centrifugation at 15 000g at 4°C for 25 minutes. The supernatant (2 μL) was injected directly into a silica column (4.6×250 mm, 5 μm Luna silica, catalog no. 00G‐4274‐E0; Phenomenex) at a flow rate of 0.5 mL/min−1 with 80% solvent A (0.1% formic acid in water) and 20% solvent B (methanol). TMAO and d9‐TMAO were monitored in the positive multiple reaction monitoring mass spectrometry mode using characteristic precursor–production transitions including m/z 76/58 and m/z 85/66, respectively. To calculate the TMAO concentration, various concentrations of a TMAO standard were added to control plasma to prepare the calibration curves.
Statistical Analyses
Statistical tests were implemented using R (3.0.2; R Foundation for Statistical Computing). None of the tested indices in the present study passed the Shapiro–Wilk normality test and the Bartlett test of homogeneity of variances at the same time; therefore, we used the Wilcoxon rank sum test or Kruskal–Wallis rank sum test (Nemenyi test for multiple pairwise comparisons) to compare ≥2 groups, respectively, in case of false‐positive statistical significance. The chi‐square test was used for categorical variables. Because the microbiome data are multidimensional, we used the Adonis test implemented in QIIME 1.8.0 (a method similar to PERMANOVA, which partitions a distance matrix among sources of variation to describe the strength and significance that a categorical or continuous variable has in determining variation of distances). A value of P<0.05 was considered statistically significant in the compared groups.
Results
In the present study, 435 patients were screened, and 322 were recruited based on the inclusion criteria. Fasting blood samples were drawn from all participants. Among them, 141 patients provided fecal samples within 48 hours after admission. For the asymptomatic control group, 231 participants provided blood samples and 97 collected fresh fecal samples (Tables 1 and 2).
Table 1.
Characteristics of the Study Participants
| Patients (n=322) | Controls (n=231) | P Value | |
|---|---|---|---|
| Blood sample | 322 | 231 | |
| Fecal sample | 141 | 94 | |
| Male, n (%) | 220 (68.3) | 130 (56.3) | 0.004 |
| Age, y | 61 (19) | 56 (11) | <0.001 |
| BMI, kg/m2 | 23.62 (3.90) | 25.16 (4.25) | <0.001 |
| Stroke (LAA) | 297 | NA | |
| TIA | 25 | NA | |
| History of diabetes, n (%) | 125 (38.8) | 20 (8.66) | <0.001 |
| History of CAD, n (%) | 26 (8.1) | NA | |
| History of HBP, n (%) | 246 (76.4) | 40 (17.3) | <0.001 |
| History of HLP, n (%) | 145 (45.0) | NA | |
| TC, mmol/L | 4.64 (1.64) | 5.20 (1.20) | <0.001 |
| HDL, mmol/L | 0.95 (0.31) | 1.14 (0.33) | <0.001 |
| LDL, mmol/L | 2.91 (1.28) | 3.30 (0.94) | <0.001 |
| VLDL, mmol/L | 0.66 (0.43) | 0.68 (0.43) | 0.134 |
| TG, mmol/L | 1.30 (0.96) | 1.45 (1.04) | 0.510 |
| GLU, mmol/L | 5.62 (2.30) | 4.89 (0.93) | <0.001 |
| WBC, G/L | 7.89 (3.37) | 6.37 (2.12) | <0.001 |
| Cr, μmol/L | 78 (34) | 67 (20) | <0.001 |
| UA, μmol/L | 346 (121) | 365 (118) | 0.19 |
| TMAO, μmol/L | 2.70 (3.47) | 1.91 (1.99) | <0.001 |
Data represent median (interquartile range) unless otherwise indicated. BMI indicates body mass index; CAD, coronary artery disease; Cr, creatinine; GLU, glucose; HBP, high blood pressure; HDL, high‐density lipoprotein; HLP, hyperlipidemia; LAA, large‐artery atherosclerosis; LDL, low‐density lipoprotein; NA, not applicable due to selection criteria; TC, total cholesterol; TG, triglycerides; TIA, transient ischemic attack; TMAO, trimethylamine N‐oxide; UA, uric acid; VLDL, very low‐density lipoprotein; WBC, white blood cell count.
Table 2.
Characteristics of the Control Group
| Non‐AS (79) | IMT (n=104) | AS (n=48) | P Value | |
|---|---|---|---|---|
| Male, n (%) | 42 (53.8) | 55 (52.9) | 33 (68.8) | 0.157 |
| Age, y | 51.0 (11) | 57.0 (9.5) | 63.0 (8.75) | <0.001 |
| BMI, kg/m2 | 25.1 (4.5) | 25.2 (4.1) | 24.7 (6.1) | 0.939 |
| History of diabetes, n (%) | 2 (2.56) | 10 (9.61) | 8 (16.7) | 0.022 |
| History of HBP, n (%) | 13 (16.7) | 13 (12.5) | 14 (29.2) | 0.041 |
| SBP, mm Hg | 125.5 (25.3) | 128.0 (25) | 138.5 (29.8) | <0.001 |
| TC, mmol/L | 5.07 (1.28) | 5.3 (1.21) | 5.37 (1.47) | 0.052 |
| HDL, mmol/L | 1.18 (0.31) | 1.14 (0.32) | 1.11 (0.39) | 0.467 |
| LDL, mmol/L | 3.22 (0.91) | 3.34 (0.87) | 3.33 (1.14) | 0.069 |
| VLDL, mmol/L | 0.63 (0.37) | 0.73 (0.43) | 0.74 (0.46) | 0.058 |
| TG, mmol/L | 1.30 (1.00) | 1.42 (1.09) | 1.61 (0.95) | 0.329 |
| GLU, mmol/L | 4.7 (0.7) | 4.9 (0.9) | 5.2 (1.5) | <0.001 |
| WBC, G/L | 5.97 (2.05) | 6.40 (2.03) | 6.64 (3.19) | 0.262 |
| Cr, μmol/L | 66.0 (20) | 66.5 (21.8) | 69.0 (18.3) | 0.406 |
| UA, μmol/L | 370.0 (126) | 367.0 (115.3) | 354.0 (112.2) | 0.846 |
| TMAO, μmol/L | 2.68 (3.50) | 2.63 (3.63) | 2.92 (3.35) | 0.999 |
Data represent median (interquartile range) unless otherwise indicated. AS indicates atherosclerotic; BMI indicates body mass index; Cr, creatinine; GLU, glucose; HBP, high blood pressure; HDL, high‐density lipoprotein; IMT, intima–media thickness; LDL, low‐density lipoprotein; SBP, systolic blood pressure; TC, total cholesterol; TG, triglycerides; TMAO, trimethylamine N‐oxide; UA, uric acid; VLDL, very low‐density lipoprotein; WBC, white blood cell count.
Among the asymptomatic volunteers, systolic blood pressure, fasting glucose, and very low‐density lipoprotein levels were significantly higher in the AS group. No significant difference was observed for the TMAO levels among the 3 groups (Figure 1A), and the average level of the 3 groups was ≈4.14 μmol/L, with a median value of 2.71 μmol/L, which was comparable to that reported.
Figure 1.
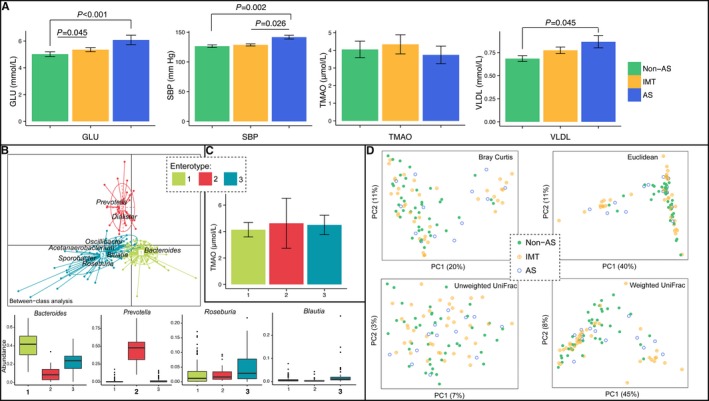
A, Comparison of blood GLU, SBP, blood TMAO, and VLDL values among the non‐AS, IMT, and AS subgroups within the asymptomatic control group. B, Three enterotypes were determined including type 1 (dominated by Bacteroides), type 2 (dominated by Prevotella), and type 3 (consisting of Bacteroides and other bacteria including Roseburia and Blautia). C, Comparison of TMAO levels in the 3 enterotypes in the control group. D, Principal coordinate analysis illustrating the grouping patterns of the non‐AS, IMT, and AS subgroups based on the Bray‐Curtis, euclidean, weighted UniFrac, and unweighted UniFrac distances. Each circle represents a sample, and the corresponding group can be found in the legend. Distances between any pair of samples represent the dissimilarities between these 2 samples. AS indicates atherosclerotic; GLU, glucose; SBP, systolic blood pressure; TMAO, trimethylamine‐N‐oxide; VLDL, very low‐density lipoprotein.
The gut microbiome samples could be classified into 3 enterotypes, which were dominated by Bacteroides, Prevotella, and others (mainly Roseburia and Blautia in the present study) (Figure 1B). This classification was similar to reports in European studies.20 We did not observe any significant differences in the TMAO level among the 3 enterotypes (Figure 1C). In addition, the PCoA (a dimensionality reduction method illustrating the relationship between samples based on distance matrix) using any distances did not show obvious grouping of the non‐AS, IMT, and AS participants among the asymptomatic controls by gut microbiota (Figure 1D). PCoA visualizes the unsupervised grouping pattern of a complex data set like microbiome, and clear separation (or trend) in PCoA by coloring samples from metadata indicates that the chosen information is related to microbiome. All of these analyses suggested that atherosclerosis was not related to a significantly different gut microbiome or blood TMAO level within the asymptomatic group.
In comparison, the stroke and TIA patients showed clearly different gut microbiota than that of asymptomatic controls. The α‐diversity, which includes species richness (represented by Chao1, observed species), phylogenetic diversity (represented by phylogenetic diversity whole tree), and richness and evenness (represented by Shannon index) of the microbial community, showed that the patient group had greater diversity than the control group. Chao1, observed species, and phylogenetic diversity whole tree reached statistical significance using the Wilcoxon rank sum test, whereas the Shannon index showed a similar trend without significance (P=0.091) (Figure 2).
Figure 2.
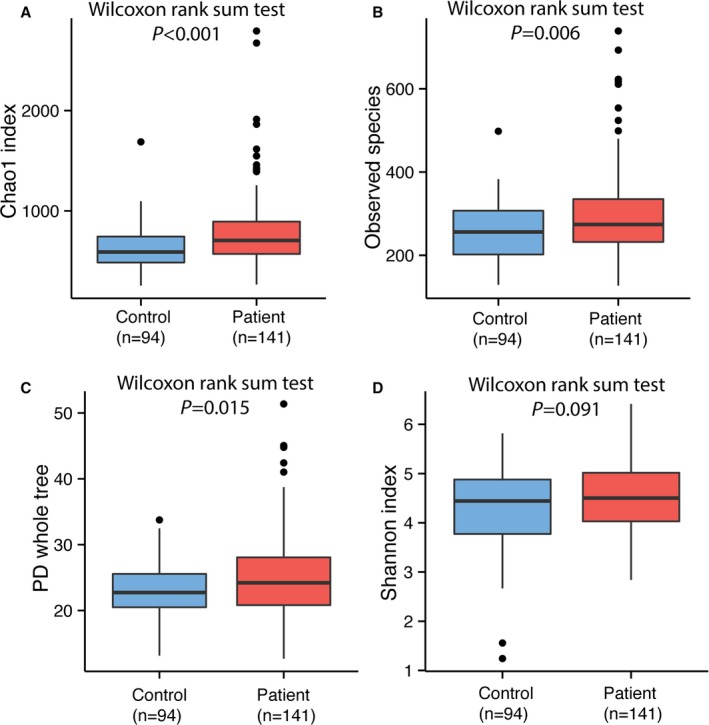
Comparison of α‐diversity between the gut microbiota of patients and controls. Four indices were used to represent the α‐diversity which is (A) Chao1, (B) observed species, (C) Shannon index, and (D) PD whole tree. PD indicates phylogenetic diversity.
Most of the gut bacteria detected in this study fall into 3 phyla: Bacteroidetes, Firmicutes, and Proteobacteria. The genus‐level characterization is more complex, in that 20 genera (mainly Bacteroides, Prevotella, Faecalibacterium, Escherichia/Shigella, and Roseburia) can compose up to 80% of the total flora (Figure 3). The difference of the microbiome communities between the 2 groups could be observed using both traditional PCoA (Figure 4A) and machine learning with the random forest method (Figure 4B). Machine learning is usually used for constructing models from gut microbiome to predict the phenotype (in this case, controls or patients). Even though acute stroke does not require diagnosis from gut microbiome, the high values for area under the receiver operating characteristic curve using both weighted and unweighted taxonomy information suggested that the gut microbiome of stroke and TIA patients could be differentiated from that of controls with high specificity and sensitivity. Furthermore, LEfSe analysis also showed a clear difference between patients and controls, with increasing levels of Proteobacteria and reduced amounts of Bacteroides, Prevotella, and Faecalibacterium in the patients (Figure 4C).
Figure 3.
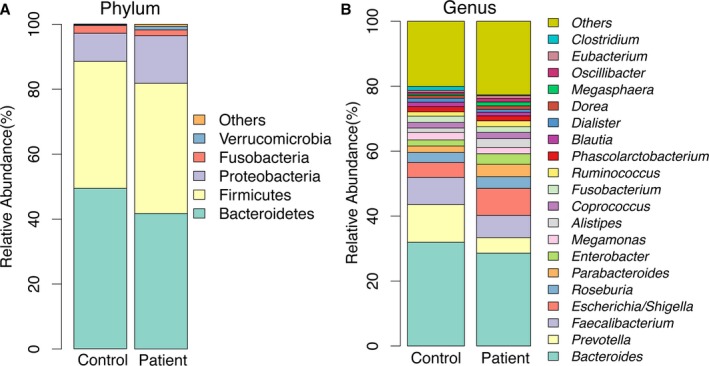
Taxonomic summary of the gut microbiota of patients and controls at (A) phylum level and (B) genus level.
Figure 4.
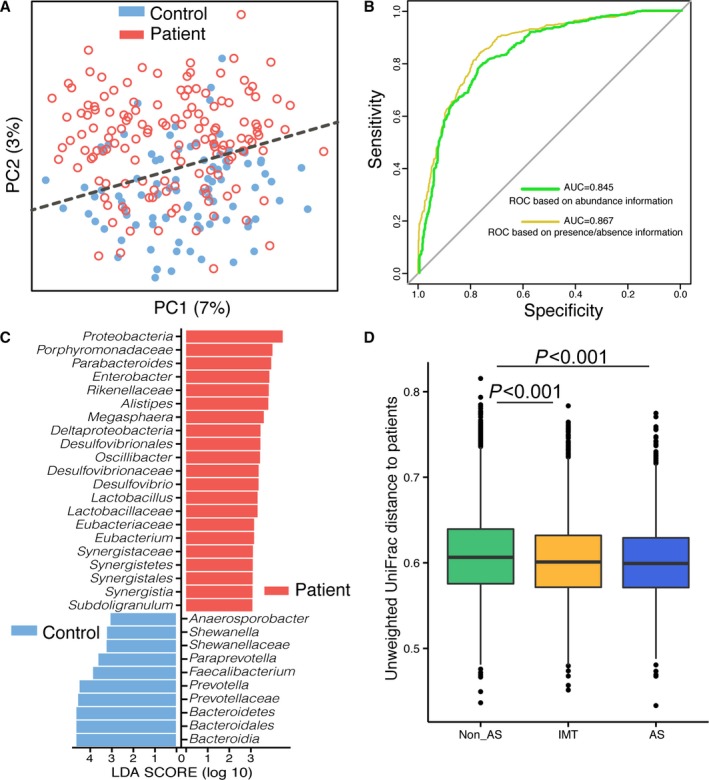
Comparison of gut microbiota between asymptomatic controls and stroke/TIA patients. A, Principal coordinate analysis based on the unweighted UniFrac distances. The red open circles represent samples (intestinal microbiota) of patients, and the blue closed circles represent samples of controls. B, Machine learning classification based on gut microbiota using random forest algorithms. C, Significantly discriminative taxa between the control participants and patients were determined using linear discriminant analysis effect size (LD[1]A effect size). The red bar chart represents the bacteria that was more abundant in patients’ fecal samples, and the blue bar chart represents the controls. It showed the increasing levels of Proteobacteria and reduced amounts of Bacteroides, Prevotella and Faecalibacterium in the patients. D, Unweighted UniFrac distances of each subgroup of control compared with stroke/TIA patients. AS indicates atherosclerotic; AUC indicates area under the curve; IMT, intima–media thickness; LEfSe, linear discriminate analysis size effect; ROC, receiver operating characteristic; TIA, transient ischemic attack.
According to the unweighted UniFrac distance analyses, the distance between the asymptomatic AS group and the stroke/TIA patient group was slightly smaller than the distances between the other 2 subgroups and the patient group (Kruskal–Wallis rank sum test followed by Nemenyi pairwise comparisons, P<0.05) (Figure 4D). The UniFrac distance represents the dissimilarity between 2 samples (groups) based on the presence or absence of information on OTUs and also considers the phylogenetic relationship between these OTUs. The smaller the UniFrac distance, the more similar the 2 microbial communities.21 This result indicated that the gut microbiota of the asymptomatic atherosclerotic participants exhibited slight dysbiosis, which was similar to that in stroke and TIA patients. It could be possible to reveal the dysbiosis of the gut microbiota in asymptomatic atherosclerotic persons with a much larger cohort.
We wondered when the gut microbiota of stroke patients changed. First, we compared samples collected within 24 hours after admission with those obtained within 24 to 48 hours. According to the α‐ and β‐diversity analyses, there was no difference between the 2 groups (Figure 5), indicating that those changes happened earlier than our first sampling time. We further stratified samples taken within 24 hours to assess whether there were any changes at the very early stage; however, our earliest samples were ≈14 hours from the event, and there were too few early stage samples to find any significant differences with those collected later.
Figure 5.
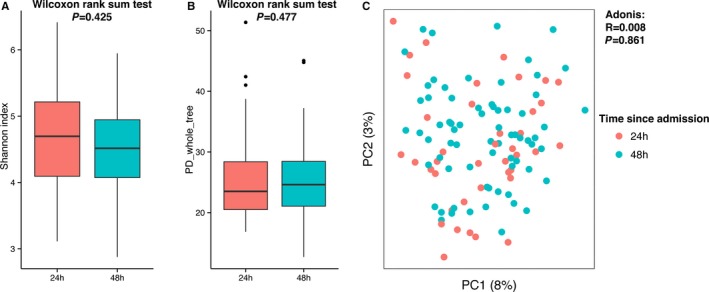
Diversity comparisons of the gut microbiota from different admission times (grouped as “within 24 hours” and “within 48 hours”) of stroke and transient ischemic attack patients: (A) Shannon index, α‐diversity; (B) PD whole tree, α‐diversity; and (C) principal coordinate analysis based on unweighted UniFrac, β‐diversity, tested by Adonis. PD indicates phylogenetic diversity.
A limitation of the present study is that the inclusion of patients and controls was not well balanced regarding age and sex distributions. To determine whether age and sex affected the gut microbiota, we selected 47 age‐ and sex‐matched pairs of samples from the control and patient groups (Table 3) and recaptured the observation that the gut microbiota of the control group can be separated from that of the patient group based on PCoA (Figure 6). Consequently, we suggest that the difference in gut microbiome was mainly due to stroke or TIA. In addition, we did not observe any significant differences between the gut microbiota of stroke and TIA patients for either α‐ or β‐diversity analyses (Figure 7A through 7C). Nevertheless, only 9 TIA patients were enrolled in this study, so this negative observation should be validated in larger scaled studies. We also tested whether the gut microbiota of initial stroke patients differed from that of recurrent stroke patients, and the results showed that this effect was very limited, according to α‐ and β‐diversity analyses (Figure 7D through 7F). In contrast, we observed that the severity of stroke, which is classified by National Institutes of Health Stroke Scale (NIHSS) score, correlated with gut microbiota. The α‐diversity of severe stroke patients (NIHSS score >4) was higher than that of mild stroke patients (NIHSS score ≤4) based on phylogenetic diversity whole tree (23.54 versus 26.47, P=0.014) (Figure 8A and 8B). Even though these 2 groups were not clearly separated in PCoA analysis, we observed that samples of severe stroke patients tended to be located in the left region of PCoA, whereas those of mild stroke patients tended to be located in the right region (Figure 8C). This was confirmed by the Adonis test (P=0.034). By further analysis using LEfSe, we determined that Proteobacteria, which are higher in stroke/TIA patients compared with controls, were more abundant in severe stroke patients than in mild stroke patients, whereas Bacteroides (which belong to Bacteroidetes) were depleted in severe stroke patients compared with mild stroke patients (Figure 8D).
Table 3.
Samples Adjust for Sex and Age
| Sample_ID | Group | Sex | Age (years) | Match | Sample_ID | Group | Sex | Age (years) |
|---|---|---|---|---|---|---|---|---|
| Co27 | C | Male | 41 | Matches to | P076 | P | Male | 41 |
| Co59 | C | Male | 44 | Matches to | P065 | P | Male | 44 |
| Co65 | C | Male | 44 | Matches to | P113 | P | Male | 44 |
| Co92 | C | Female | 45 | Matches to | P086 | P | Female | 45 |
| Co48 | C | Male | 45 | Matches to | P116 | P | Male | 45 |
| Co37 | C | Male | 46 | Matches to | P005 | P | Male | 46 |
| Co77 | C | Male | 46 | Matches to | P030 | P | Male | 46 |
| Co46 | C | Female | 48 | Matches to | P012 | P | Female | 48 |
| Co44 | C | Male | 50 | Matches to | P118 | P | Male | 50 |
| Co06 | C | Male | 51 | Matches to | P002 | P | Male | 51 |
| Co26 | C | Male | 51 | Matches to | P007 | P | Male | 51 |
| Co66 | C | Male | 51 | Matches to | P015 | P | Male | 51 |
| Co84 | C | Male | 51 | Matches to | P073 | P | Male | 51 |
| Co85 | C | Male | 51 | Matches to | P150 | P | Male | 51 |
| Co98 | C | Female | 53 | Matches to | P068 | P | Female | 53 |
| Co61 | C | Male | 53 | Matches to | P001 | P | Male | 53 |
| Co04 | C | Female | 55 | Matches to | P121 | P | Female | 55 |
| Co41 | C | Female | 55 | Matches to | P129 | P | Female | 55 |
| Co83 | C | Female | 55 | Matches to | P146 | P | Female | 55 |
| Co96 | C | Male | 55 | Matches to | P088 | P | Male | 55 |
| Co32 | C | Female | 56 | Matches to | P166 | P | Female | 56 |
| Co50 | C | Male | 56 | Matches to | P009 | P | Male | 56 |
| Co60 | C | Male | 56 | Matches to | P111 | P | Male | 56 |
| Co78 | C | Male | 56 | Matches to | P144 | P | Male | 56 |
| Co36 | C | Male | 57 | Matches to | P036 | P | Male | 57 |
| Co14 | C | Male | 58 | Matches to | P067 | P | Male | 58 |
| Co91 | C | Male | 58 | Matches to | P163 | P | Male | 58 |
| Co87 | C | Female | 59 | Matches to | P142 | P | Female | 59 |
| Co21 | C | Male | 59 | Matches to | P006 | P | Male | 59 |
| Co45 | C | Male | 59 | Matches to | P041 | P | Male | 59 |
| Co94 | C | Male | 59 | Matches to | P171 | P | Male | 59 |
| Co10 | C | Male | 60 | Matches to | P020 | P | Male | 60 |
| Co76 | C | Female | 61 | Matches to | P128 | P | Female | 61 |
| Co23 | C | Female | 62 | Matches to | P132 | P | Female | 62 |
| Co89 | C | Male | 62 | Matches to | P045 | P | Male | 62 |
| Co11 | C | Female | 63 | Matches to | P131 | P | Female | 63 |
| Co33 | C | Female | 63 | Matches to | P139 | P | Female | 63 |
| Co43 | C | Female | 63 | Matches to | P162 | P | Female | 63 |
| Co47 | C | Male | 63 | Matches to | P052 | P | Male | 63 |
| Co16 | C | Female | 64 | Matches to | P114 | P | Female | 64 |
| Co17 | C | Male | 64 | Matches to | P059 | P | Male | 64 |
| Co93 | C | Male | 65 | Matches to | P057 | P | Male | 65 |
| Co38 | C | Male | 66 | Matches to | P054 | P | Male | 66 |
| Co19 | C | Male | 68 | Matches to | P080 | P | Male | 68 |
| Co86 | C | Male | 69 | Matches to | P049 | P | Male | 69 |
| Co95 | C | Female | 70 | Matches to | P137 | P | Female | 70 |
| Co73 | C | Female | 73 | Matches to | P042 | P | Female | 73 |
C indicates control; P, patient.
Figure 6.
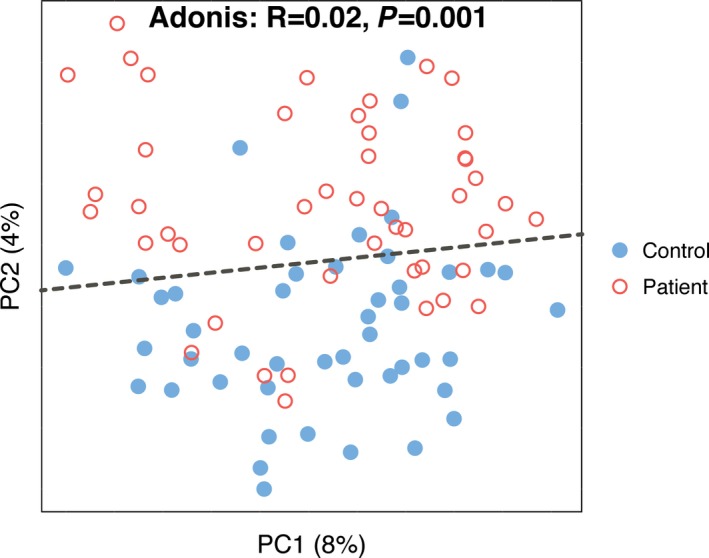
Principal coordinate analysis of 47 pairs of age‐ and sex‐matched controls and patients based on unweighted UniFrac.
Figure 7.
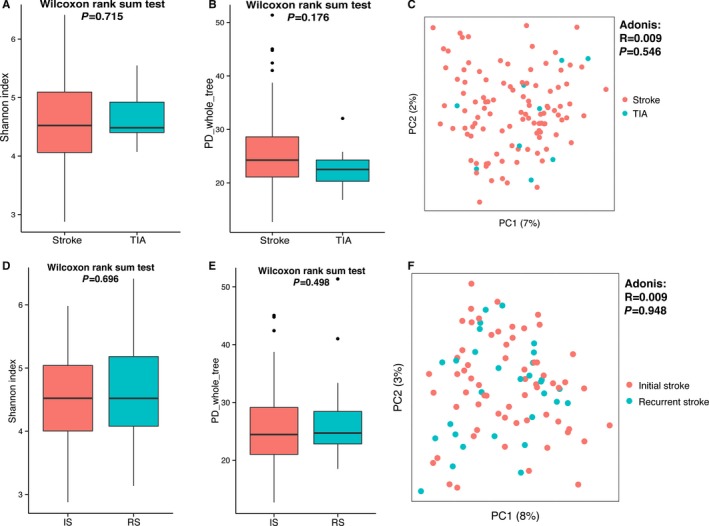
Diversity comparisons between the gut microbiota of stroke and TIA patients (A through C) and of initial and recurrent stroke patients (D through F): (A and D) Shannon index, α‐diversity; (B and E) PD whole tree, α‐diversity; and (C and F) principal coordinate analysis based on unweighted UniFrac, β‐diversity, tested by Adonis. IS indicates initial stroke; PD, phylogenetic diversity; RS, recurrent stroke; TIA, transient ischemic attack.
Figure 8.
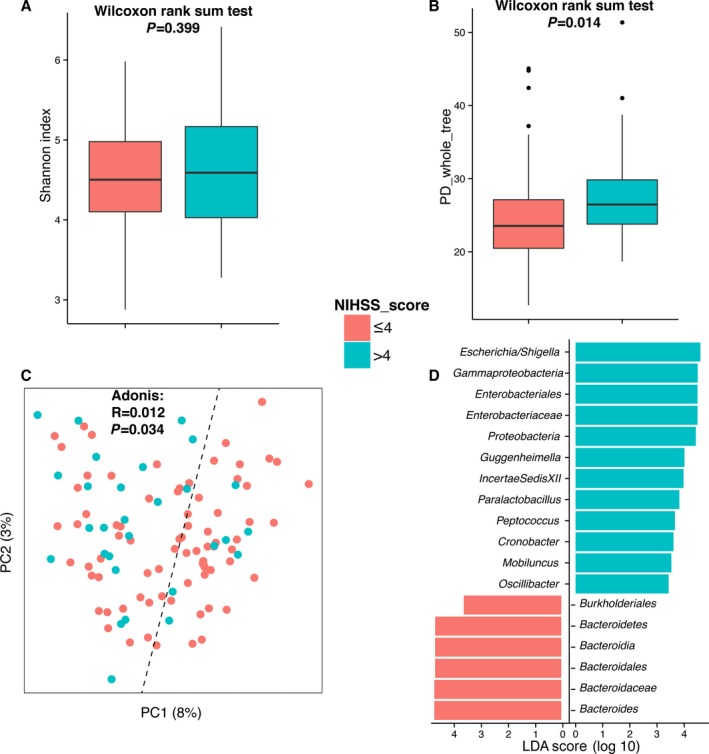
Diversity comparisons between the gut microbiota of mild and severe stroke or transient ischemic attack patients: (A) Shannon index, α‐diversity; (B) PD whole tree, α‐diversity; (C) principal coordinate analysis based on unweighted UniFrac, β‐diversity, tested by Adonis; and (D) linear discriminant analysis effect size–determined differential features. NIHSS indicates National Institutes of Health Stroke Scale; PD, phylogenetic diversity.
The TMAO level of the stroke and TIA patients showed a result that was the opposite of our initial expectations. Our data clearly showed a significant decrease, rather than an increase, in TMAO levels in stroke and TIA patients (Figure 9). For this TMAO experiment, blood samples from all 322 patients and 141 controls were studied. The average and median TMAO levels of stroke/TIA patients were only 2.68 μmol/L and 1.91 μmol/L, respectively, which were comparable to quartile 1 in a US cohort.5
Figure 9.
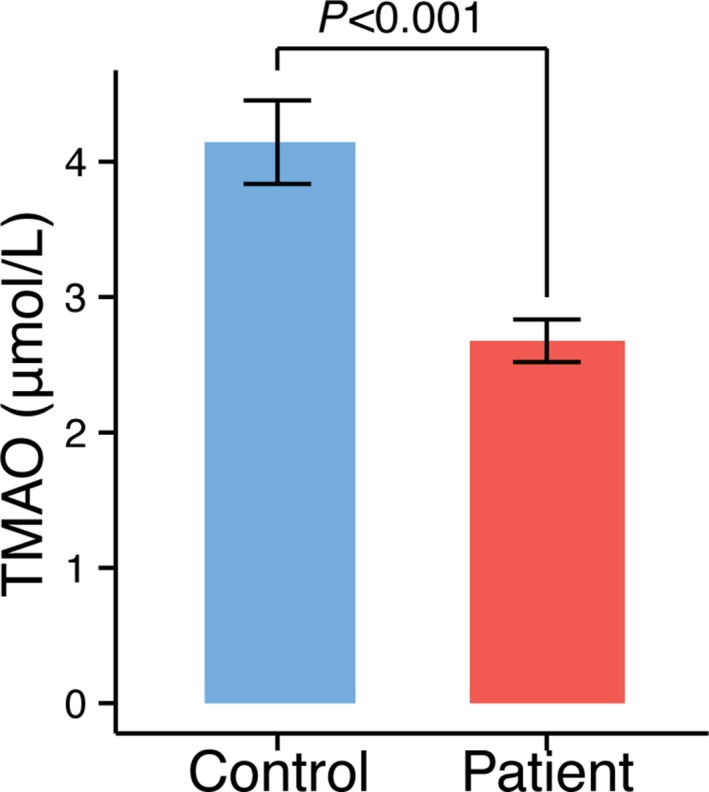
TMAO levels in stroke or transient ischemic attack patients and asymptomatic controls. TMAO indicates trimethylamine‐N‐oxide.
Discussion
The present study provides new information about TMAO levels and gut microbiome in asymptomatic atherosclerotic and stroke/TIA patients. It has been reported, using pyrosequencing of 16S rRNA tags, that atherosclerotic patients in the United States had similar gut microbiota to that of controls,22 and our present results from a Chinese population are consistent with that report. In comparison, significant changes in gut microbiota were observed in stroke and TIA patients; for instance, the 3 major depleted genera in the patient groups, namely, Bacteroides, Prevotella, and Faecalibacterium, are major commensal or beneficial microbes. In particular, Faecalibacterium has been widely recognized as a critical butyrate acid–producing beneficial bacterium that is reduced in many diseases.2, 3, 23 In contrast, the microbes that were enriched in stroke and TIA patients were mainly opportunistic pathogens, such as Enterobacter, Megasphaera, and Desulfovibrio.2, 3 Furthermore, Proteobacteria is more abundant not only in stroke and TIA patients compared with controls but also more abundant in severe stroke patients compared with mild stroke patients. These findings indicate that gut microbiota changes are involved in the onset or even the severity of stroke. Nevertheless, all samples in this study were collected from stroke inpatients, and it remains unclear if these changes in the gut microbiota had already taken place in persons prone to stroke before stroke actually occurred or were caused by stroke‐induced stress shortly after the event.
Although the TMAO level has been suggested to be involved in atherosclerosis,4, 5 and many cohort studies have suggested that an increased number of adverse outcomes are associated with high TMAO levels,4, 5, 6, 7 no reports have examined the increase in TMAO levels in asymptomatic atherosclerosis patients. Our present results did not find an increase in the TMAO levels of asymptomatic atherosclerosis patients, which indicated that more research is needed to evaluate the fasting blood TMAO level in relation to the risk assessment of atherosclerosis; however, our study found that the blood TMAO level is lower in stroke and TIA patients. We postulate that either the stroke event or the treatment may reduce TMAO, and that may be clarified with further animal studies.
In summary, the present study suggests that dysbiosis of the gut microbiota and reduction of the blood TMAO level occur in stroke and TIA patients. Although we could not determine whether these changes occurred before or after stroke or TIA, this dysbiosis and the long‐term effect in stroke patients clearly deserves further study.
Sources of Funding
This work was supported through funding from the National Natural Science Foundation of China (NSFC31322003, 31270152), the Natural Science Foundation of Guangdong Province of China (2014A030313353), the Guangzhou Science and Technology Plan Foundation of Guangdong Province of China (201510010078).
Disclosures
None.
(J Am Heart Assoc. 2015;4:e002699 doi: 10.1161/JAHA.115.002699)
References
- 1. Ridaura VK, Faith JJ, Rey FE, Cheng J, Duncan AE, Kau AL, Griffin NW, Lombard V, Henrissat B, Bain JR, Muehlbauer MJ, Ilkayeva O, Semenkovich CF, Funai K, Hayashi DK, Lyle BJ, Martini MC, Ursell LK, Clemente JC, Van Treuren W, Walters WA, Knight R, Newgard CB, Heath AC, Gordon JI. Gut microbiota from twins discordant for obesity modulate metabolism in mice. Science. 2013;341:1241214. [DOI] [PMC free article] [PubMed] [Google Scholar]
- 2. Qin J, Li Y, Cai Z, Li S, Zhu J, Zhang F, Liang S, Zhang W, Guan Y, Shen D, Peng Y, Zhang D, Jie Z, Wu W, Qin Y, Xue W, Li J, Han L, Lu D, Wu P, Dai Y, Sun X, Li Z, Tang A, Zhong S, Li X, Chen W, Xu R, Wang M, Feng Q, Gong M, Yu J, Zhang Y, Zhang M, Hansen T, Sanchez G, Raes J, Falony G, Okuda S, Almeida M, LeChatelier E, Renault P, Pons N, Batto JM, Zhang Z, Chen H, Yang R, Zheng W, Li S, Yang H, Wang J, Ehrlich SD, Nielsen R, Pedersen O, Kristiansen K, Wang J. A metagenome‐wide association study of gut microbiota in type 2 diabetes. Nature. 2012;490:55–60. [DOI] [PubMed] [Google Scholar]
- 3. Abu‐Shanab A, Quigley EM. The role of the gut microbiota in nonalcoholic fatty liver disease. Nat Rev Gastroenterol Hepatol. 2010;12:691–701. [DOI] [PubMed] [Google Scholar]
- 4. Tang WH, Wang Z, Levison BS, Koeth RA, Britt EB, Fu X, Wu Y, Hazen SL. Intestinal microbial metabolism of phosphatidylcholine and cardiovascular risk. N Engl J Med. 2013;368:1575–1584. [DOI] [PMC free article] [PubMed] [Google Scholar]
- 5. Koeth RA, Wang Z, Levison BS, Buffa JA, Org E, Sheehy BT, Britt EB, Fu X, Wu Y, Li L, Smith JD, DiDonato JA, Chen J, Li H, Wu GD, Lewis JD, Warrier M, Brown JM, Krauss RM, Tang WH, Bushman FD, Lusis AJ, Hazen SL. Intestinal microbiota metabolism of L‐carnitine, a nutrient in red meat, promotes atherosclerosis. Nat Med. 2013;19:576–585. [DOI] [PMC free article] [PubMed] [Google Scholar]
- 6. Tang WH, Wang Z, Fan Y, Levison B, Hazen JE, Donahue LM, Wu Y, Hazen SL. Prognostic value of elevated levels of intestinal microbe‐generated metabolite trimethylamine‐N‐oxide in patients with heart failure: refining the gut hypothesis. J Am Coll Cardiol. 2014;64:1908–1914. [DOI] [PMC free article] [PubMed] [Google Scholar]
- 7. Tang WH, Wang Z, Kennedy DJ, Wu Y, Buffa JA, Agatisa‐Boyle B, Li XS, Levison BS, Hazen SL. Gut microbiota‐dependent trimethylamine N‐oxide (TMAO) pathway contributes to both development of renal insufficiency and mortality risk in chronic kidney disease. Circ Res. 2015;116:448–455. [DOI] [PMC free article] [PubMed] [Google Scholar]
- 8. Karlsson FH, Fak F, Nookaew I, Tremaroli V, Fagerberg B, Petranovic D, Bäckhed F, Nielsen J. Symptomatic atherosclerosis is associated with an altered gut metagenome. Nat Commun. 2012;3:1245. [DOI] [PMC free article] [PubMed] [Google Scholar]
- 9. Peng X, Yu KQ, Deng GH, Jiang YX, Wang Y, Zhang GX, Zhou HW. Comparison of direct boiling method with commercial kits for extracting fecal microbiome DNA by Illumina sequencing of 16S rRNA tags. J Microbiol Methods. 2013;95:455–462. [DOI] [PubMed] [Google Scholar]
- 10. Zhou HW, Li DF, Tam NF, Jiang XT, Zhang H, Sheng HF, Qin J, Liu X, Zou F. BIPES, a cost‐effective high‐throughput method for assessing microbial diversity. ISME J. 2011;5:741–749. [DOI] [PMC free article] [PubMed] [Google Scholar]
- 11. Caporaso JG, Kuczynski J, Stombaugh J, Bittinger K, Bushman FD, Costello EK, Fierer N, Peña AG, Goodrich JK, Gordon JI, Huttley GA, Kelley ST, Knights D, Koenig JE, Ley RE, Lozupone CA, McDonald D, Muegge BD, Pirrung M, Reeder J, Sevinsky JR, Turnbaugh PJ, Walters WA, Widmann J, Yatsunenko T, Zaneveld J, Knight R. QIIME allows analysis of high‐throughput community sequencing data. Nat Methods. 2010;7:335–336. [DOI] [PMC free article] [PubMed] [Google Scholar]
- 12. Edgar RC. Search and clustering orders of magnitude faster than BLAST. Bioinformatics. 2010;26:2460–2461. [DOI] [PubMed] [Google Scholar]
- 13. Caporaso JG, Bittinger K, Bushman FD, DeSantis TZ, Andersen GL, Knight R. PyNAST: a flexible tool for aligning sequences to a template alignment. Bioinformatics. 2010;26:266–267. [DOI] [PMC free article] [PubMed] [Google Scholar]
- 14. Price MN, Dehal PS, Arkin AP. FastTree: computing large minimum evolution trees with profiles instead of a distance matrix. Mol Biol Evol. 2009;26:1641–1650. [DOI] [PMC free article] [PubMed] [Google Scholar]
- 15. McDonald D, Clemente JC, Kuczynski J, Rideout JR, Stombaugh J, Wendel D, Wilke A, Huse S, Hufnagle J, Meyer F, Knight R, Caporaso JG. The Biological Observation Matrix (BIOM) format or: how I learned to stop worrying and love the ome‐ome. Gigascience. 2012;1:7. [DOI] [PMC free article] [PubMed] [Google Scholar]
- 16. Kuhn M. Building predictive models in R using the caret package. J Stat Softw. 2008;28:1–26. [Google Scholar]
- 17. Fawcett Tom. An introduction to ROC analysis. Pattern Recogn Lett. 2006;27:861–874. [Google Scholar]
- 18. Segata N, Izard J, Waldron L, Gevers D, Miropolsky L, Garrett WS, Huttenhower C. Metagenomic biomarker discovery and explanation. Genome Biol. 2011;12:R60. [DOI] [PMC free article] [PubMed] [Google Scholar]
- 19. Wang Z, Levison BS, Hazen JE, Donahue L, Li XM, Hazen SL. Measurement of trimethylamine‐N‐oxide by stable isotope dilution liquid chromatography tandem mass spectrometry. Anal Biochem. 2014;455:35–40. [DOI] [PMC free article] [PubMed] [Google Scholar]
- 20. Arumugam M, Raes J, Pelletier E, Le Paslier D, Yamada T, Mende DR, Fernandes GR, Tap J, Bruls T, Batto JM, Bertalan M, Borruel N, Casellas F, Fernandez L, Gautier L, Hansen T, Hattori M, Hayashi T, Kleerebezem M, Kurokawa K, Leclerc M, Levenez F, Manichanh C, Nielsen HB, Nielsen T, Pons N, Poulain J, Qin J, Sicheritz‐Ponten T, Tims S, Torrents D, Ugarte E, Zoetendal EG, Wang J, Guarner F, Pedersen O, de Vos WM, Brunak S, Doré J; MetaHIT Consortium , Antolín M, Artiguenave F, Blottiere HM, Almeida M, Brechot C, Cara C, Chervaux C, Cultrone A, Delorme C, Denariaz G, Dervyn R, Foerstner KU, Friss C, van de Guchte M, Guedon E, Haimet F, Huber W, van Hylckama‐Vlieg J, Jamet A, Juste C, Kaci G, Knol J, Lakhdari O, Layec S, Le Roux K, Maguin E, Mérieux A, Melo Minardi R, M'rini C, Muller J, Oozeer R, Parkhill J, Renault P, Rescigno M, Sanchez N, Sunagawa S, Torrejon A, Turner K, Vandemeulebrouck G, Varela E, Winogradsky Y, Zeller G, Weissenbach J, Ehrlich SD, Bork P. Enterotypes of the human gut microbiome. Nature. 2011;473:174–180. [DOI] [PMC free article] [PubMed] [Google Scholar]
- 21. Lozupone C, Lladser ME, Knights D, Stombaugh J, Knight R. UniFrac: an effective distance metric for microbial community comparison. ISME J. 2011;5:169–172. [DOI] [PMC free article] [PubMed] [Google Scholar]
- 22. Koren O, Spor A, Felin J, Fåk F, Stombaugh J, Tremaroli V, Behre CJ, Knight R, Fagerberg B, Ley RE, Bäckhed F. Human oral, gut, and plaque microbiota in patients with atherosclerosis. Proc Natl Acad Sci USA. 2011;108(suppl 1):4592–4598. [DOI] [PMC free article] [PubMed] [Google Scholar]
- 23. Barcenilla A, Pryde SE, Martin JC, Duncan SH, Stewart CS, Henderson C, Flint HJ. Phylogenetic relationships of butyrate‐producing bacteria from the human gut. Appl Environ Microbiol. 2000;66:1654–1661. [DOI] [PMC free article] [PubMed] [Google Scholar]


