

Abstract
Background
Several studies have indicated that chronic kidney disease is independently associated with the presence of left ventricular hypertrophy (LVH). However, little clinical data are currently available regarding the detailed correlation between LVH and renal function in elderly patients with non–end‐stage renal disease.
Methods and Results
A total of 300 in‐ and outpatients (more than 60 years of age, non‐end‐stage renal disease), 251 with LVH and 49 without LVH, seen at Beijing Friendship Hospital from January 2000 to December 2010 were included in this retrospective study. One observation period of 12 months was used to detect rapid kidney function decline. The evaluations of cardiac structure and function were performed via echocardiography. The multivariable logistic analysis showed patients with LVH had a much higher risk of rapid kidney function decline than those without LVH. Additionally, the baseline left ventricular mass index was 140 (125–160) g/m2 in the non–chronic kidney disease group, 152 (130–175) g/m2 in the mild chronic kidney disease group (estimated glomerular filtration rate (eGFR)≥60 ml/min/1.73 m2), and 153 (133–183) g/m2 in the severe chronic kidney disease group (eGFR<60 ml/min/1.73 m2), with a significant difference (P=0.009).
Conclusions
Our data demonstrate that a high rate of renal function decline contributes to pathological LVH in non–end‐stage renal disease elderly patients and that LVH is positively associated with renal function decline followed by an increased risk of rapid kidney function decline.
Keywords: chronic kidney disease, left ventricular hypotrophy, left ventricular mass index, non–end‐stage renal disease, rapid kidney function decline
Introduction
There are many risk factors that influence renal function, such as drugs with renal toxicity, infection, heart failure, etc. The estimated glomerular filtration rate (eGFR) is the main index for evaluating renal function.1 Patients with decreased eGFR are less capable of enduring disease attacks; thus, they have poor outcomes when subjected to infection, heart failure, and so on. Clinicians attach importance to renal function and its associated risk factors in the elderly. Although aging is an indispensable factor, comorbidities can also contribute to the rate of eGFR decrease.2 Controlling blood pressure and glucose are important methods for maintaining renal function in elderly patients, but blood pressure and glucose control can only partially slow down the rate of eGFR decline. Previous studies have shown that hypertension and cardiovascular diseases are detrimental to long‐term renal function because they cause hyperfiltration in the glomeruli; however, little is known about the relationship between left ventricular hypertrophy (LVH) and renal function in elderly patients with non–end‐stage renal disease (non‐ESRD).3
Heart disease is a major risk factor of kidney damage, the prognosis of which depends on not only blood pressure level but also associated factors such as LVH.4 The latter frequently develops among patients with hypertension or cardiovascular diseases. Several echocardiography studies have indicated that chronic kidney disease (CKD) is independently associated with the presence of LVH, suggesting that renal function is related to left ventricular mass index (LVMI).5, 6, 7 Furthermore, the results of experimental and animal studies also support the association between CKD and LVMI.
LVH emerges as an adaptive response to overload, such as pressure or volume, to some extent, but long‐term LVH leads to left ventricular dysfunction, resulting in the constriction of the renal arteries, less blood‐perfusion of the glomeruli, and alteration of the glomerular membrane filtration coefficient and tubular reabsorption.8, 9 The inflammatory response associated with LVH also contributes to the progression of CKD.10 Thus, LVH appears to be a type of adverse cardiac remodeling that contributes to risk factors of CKD. We hypothesized that LVH patients would have a rapid rate of eGFR decline due to adverse cardiac remodeling. The aim of the present study was to evaluate the association of renal function with left ventricular structural alterations in a clinic‐based sample of consecutive patients.
Methods
Approvals
All experiments were performed following the relevant guidelines and regulations of Capital Medical University. This study was approved by the Medical Ethics Committee of Capital Medical University (No. IRB00005735). All study participants gave both verbal and written informed consent before study enrollment.
Study Design and Patients
We performed a retrospective cohort study to compare the rate of renal function decline between non‐ESRD elderly patients with or without LVH. We enrolled 300 in‐ and outpatients (>60 years of age) from January 2000 to December 2010 at Beijing Friendship Hospital who had complete echocardiography, renal function, and other basic medical and laboratory information. The patients who had no complete echocardiography or renal function examination within 1‐year follow‐up were excluded. LVH was defined as LVMI ≥125 g/m2 in men and LVMI ≥110 g/m2 in women.11 Rapid kidney function decline (RKFD) was defined as a decline in eGFR of at least 5 mL/min per 1.73 m2 for 12 months.9
The exclusion criteria were as follows: eGFR ≤15 mL/min per 1.73 m2, renal artery stenosis, nephrectomy in 1 kidney, undergoing renal replacement therapy, and end‐stage cancer. Hypertension was defined as systolic blood pressure ≥140 mm Hg, diastolic blood pressure ≥90 mm Hg at the time of the visit (the mean of 2 readings), patient self‐report of a history of hypertension, or the use of antihypertensive medications. Dyslipidemia was defined as low‐density lipoprotein ≥2.6 mmol/L, high‐density lipoprotein <1.03 mmol/L, and triglycerides >1.69 mmol/L; patient self‐report of hypercholesterolemia; or the use of lipid‐lowering treatments. Diabetes mellitus was defined as fasting blood glucose ≥7.0 mmol/L or patient self‐report of a history of diabetes or the use of diabetes medications. CKD was defined as abnormalities in kidney structure or function present for >3 months.12 Hyperuricemia was defined as uric acid >416 μmol/L or the use of urate‐lowering therapy.
Collection of Demographic, Medical, and Laboratory Data
Demographic and medical data, including age, sex, and comorbid conditions were obtained from medical records or patient interviews. Body mass index was calculated as the weight in kilograms divided by the square of the height in meters. Blood pressure was measured with subjects in the supine position, using a mercury sphygmomanometer with an appropriate cuff on the left arm; the average of 2 readings was used for the statistical analysis. Heart rate was counted over a full minute.
A 12‐hour overnight fasting venous blood sample was collected for measurements of total cholesterol, high‐density lipoprotein, triglycerides, low‐density lipoprotein, plasma glucose, serum uric acid, blood urea nitrogen (BUN), hemoglobin (Hgb), calcium, and phosphorus.
According to the K/DIGO‐2012 guidelines,12 eGFR was calculated using the chronic kidney disease epidemiologic collaboration equation (CKD‐EPI). CKD‐EPI creatinine equation: eGFR=141×min (Scr/κ,1)α×max(Scr/κ,1)−1.209×0.993Age×1.018 [if female]×1.159 [if black], where Scr is serum creatinine (in mg/dL); κ=0.7 [if female]; κ=0.9 [if male]; α=−0.329 [if female]; α=−0.411 [if male]; min is the minimum of Scr/κor 1; and max is the maximum of Scr/κor 1.
The echocardiographic examination was performed by a single experienced echocardiographer using a VIVID 7 (General ElectricMedical Systems, Horten, Norway) to evaluate cardiac structure and function while the participant was quietly respiring in the left decubitus position. The left ventricular mass was calculated using the Devereux‐modified method11: left ventricular mass =0.8×1.04×(EDD+IVST+PWTd)3−0.8×1.04×IVST3+0.6. EDD=end‐diastolic diameter; IVST=intraventricular septum thickness; PWTd=posterior wall thickness in diastole. LVMI was calculated by dividing the left ventricular mass by body surface area.
Statistical Analysis
SPSS 16.0 (SPSS Inc.) and Microsoft Office software 2010 (Microsoft Inc.) were used for the data analyses. Normally distributed, continuous data are presented as the means±SD, and continuous data with skewed distributions are presented as the medians (M25–M75). Count data are expressed as percentages (%). The Student t test or ANOVA were performed if the data were normally distributed. The Kruskal–Wallis test was applied if the data were abnormally distributed. The χ2 test was used to analyze count data. Univariate logistic regression analyses were performed to identify factors related to RKFD. Multivariable logistic regression analysis was used to identify independent variables related to RKFD. We considered variables that had a P<0.10 in the univariate logistic regression analysis as independent variables for inclusion in the multivariable logistic regression analysis. A 2‐sided P<0.05 was considered to indicate a statistically significant difference.
Results
Baseline Characteristics
The comparisons of demographic and clinical data between the LVH patients and non‐LVH controls are presented in Table 1. The study cohort consisted of 245 males (81.7%) and 55 females (18.3%), and the mean age of the participants was 80.1±7.6 years. There were no significant differences in gender (P=0.160), age (P=0.145), eGFR (P=0.333), and systolic (P=0.105) or diastolic blood pressure (P=0.067) between the LVH patients and non‐LVH controls. In contrast, body mass index (P=0.038) and diabetes mellitus (P=0.028) were significantly higher in the LVH patients than in the controls. We did not rule out the possible interference of therapeutic drugs in the study; thus, the eGFR and prevalence of hypertension may not have been different between subjects with and without LVH. As elderly persons often have comorbidities that can contribute to the prevalence of LVH and the rate of eGFR decline, the proportion of elderly persons without LVH may be relatively less than that among younger individuals. As shown in Table 2, the LVH group had a larger left atrial diameter (P=0.032), end‐diastolic diameter (P=0.033), end‐systolic diameter (P=0.020), left ventricular mass (P=0.023), and LVMI (P<0.001) compared to the control group.
Table 1.
Clinical Characteristics of Patients With and Without LVH
| Total | With LVH | Without LVH | P Value | |
|---|---|---|---|---|
| N | 300 | 251 | 49 | |
| Sex, male | 245 (81.7%) | 201 (80.1%) | 44 (89.8%) | 0.160 |
| Age, y | 80.1±7.6 | 80.4±7.5 | 78.7±8.0 | 0.145 |
| SBP, mm Hg | 130 (120–150) | 133 (120–150) | 130 (120–140) | 0.105 |
| DBP, mm Hg | 70 (70–80) | 72 (70–80) | 70 (70–80) | 0.067 |
| Pulse, beats/min | 70 (64–76) | 70 (64–76) | 72 (68–79) | 0.197 |
| BMI, kg/m2 | 24.2±3.4 | 24.4±3.4 | 23.3±3.6 | 0.038 |
| Laboratory parameters | ||||
| eGFR, mL/min per 1.73 m2 | 60.6±15.3 | 60.3±15.7 | 62.3±13.0 | 0.333 |
| Hgb, g/L | 128.9±16.3 | 128.8±16.2 | 129.8±16.8 | 0.691 |
| BUN, mmol/L | 15.7 (12.9–19.1) | 15.7 (13.0–19.5) | 15.5 (12.0–17.9) | 0.248 |
| Ca, mmol/L | 2.19 (2.10–2.30) | 2.19 (2.10–2.30) | 2.18 (2.10–2.28) | 0.570 |
| P, mmol/L | 1.03 (0.91–1.19) | 1.03 (0.91–1.19) | 1.00 (0.84–1.16) | 0.443 |
| UA, μmol/L | 331±92 | 334±93 | 315±82 | 0.183 |
| Glu, mmol/L | 5.2 (4.6–6.1) | 5.2 (4.62–6.1) | 5.1 (4.6–5.7) | 0.617 |
| CHOL, mmol/L | 4.5±0.9 | 4.49±0.92 | 4.64±0.82 | 0.279 |
| TG, mmol/L | 1.19 (0.89–1.64) | 1.21 (0.90–1.63) | 1.09 (0.83–1.69) | 0.540 |
| HDL, mmol/L | 1.04 (0.86–1.25) | 1.02 (0.84–1.23) | 1.06 (0.86–1.28) | 0.540 |
| Medical history | ||||
| DM | 116 (38.7%) | 105 (41.8%) | 11 (22.4%) | 0.028 |
| HT | 247 (82.3%) | 212 (84.5%) | 35 (71.4%) | 0.111 |
| Dyslipidemia | 161 (53.7%) | 139 (55.4%) | 22 (44.9%) | 0.390 |
| CHD | 267 (89.0%) | 227 (90.4%) | 40 (81.6%) | 0.237 |
| CKD | 211 (70.3%) | 180 (71.7%) | 31 (63.3%) | 0.244 |
| Hyperuricemia | 50 (16.7%) | 44 (17.5%) | 6 (12.2%) | 0.485 |
BMI indicates body mass index; BUN, blood urea nitrogen; Ca, calcium; CHD, chronic heart disease; CHOL, total cholesterol; CKD, chronic kidney disease; DBP, diastolic blood pressure; DM, diabetes mellitus; eGFR, estimated glomerular filtration rate; Glu, glucose; HDL, high‐density lipoprotein; Hgb, hemoglobin; HT, Hypertension; LVH, left ventricular hypertrophy; P, phosphorus; SBP, systolic blood pressure; TG, triglycerides; UA, serum uric acid.
Table 2.
Echocardiographic Measurements in the Entire Cohort and the Subgroups With and Without LVH
| Total | With LVH | Without LVH | P Value | |
|---|---|---|---|---|
| N | 300 | 251 | 49 | |
| Lad | 3.4 (3.2–3.8) | 3.4 (3.2–3.8) | 3.3 (3.1–3.6) | 0.032 |
| EDD | 4.9 (4.6–5.4) | 5.0 (4.7–5.4) | 4.8 (4.6–5.2) | 0.033 |
| ESD | 3.1 (2.8–3.5) | 3.1 (2.8–3.5) | 3.0 (2.8–3.2) | 0.020 |
| LVEF, % | 66 (62–70) | 66 (62–70) | 66 (63–71) | 0.642 |
| IVST | 1.00 (0.90–1.10) | 1.00 (0.90–1.10) | 0.96 (0.90–1.10) | 0.083 |
| PWTd | 1.00 (0.90–1.04) | 1.00 (0.90–1.06) | 0.96 (0.90–1.02) | 0.200 |
| LV mass | 273 (239–333) | 273 (247–342) | 261 (223–310) | 0.023 |
| LVMI, g/m2 | 150 (129–176) | 157 (139–182) | 108 (100–119) | <0.001 |
EDD indicates end‐diastolic diameter; ESD, end‐systolic diameter; IVST, intraventricular septum thickness; LAd, left atrial diameter; LV mass, left ventricular mass; LVEF, left ventricular ejection fraction; LVH, left ventricular hypertrophy; LVMI, left ventricular mass index; PWTd, posterior wall thickness in diastole.
eGFR Decline Speed Changes Showed That Renal Function Tended to Decline Faster in the LVH Group Than in the Non‐LVH Group
To determine whether LVH affects the rate of renal function decline, we compared the eGFR changes between the 2 study groups. The eGFR change for all patients was −2.06±8.63 mL/min per 1.73 m2. As shown in Figure 1, the eGFR change for the LVH group was negative (−2.49±8.98 mL/min per 1.73 m2) and the eGFR change in the non‐LVH group was positive (0.15±6.10 mL/min per 1.73 m2). The decrease in renal function was significantly greater in the LVH group than in the non‐LVH group (P=0.013), although the eGFR was nearly stable in both groups.
Figure 1.
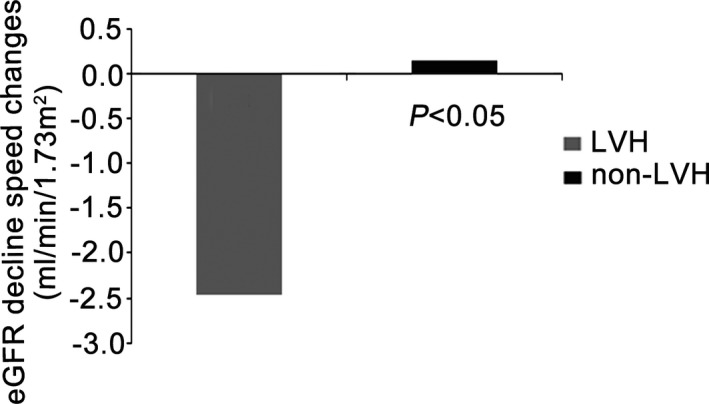
eGFR decline speed changes in the LVH and non‐LVH groups. eGFR indicates estimated glomerular filtration rate; LVH, left ventricular hypertrophy; non‐LVH, without left ventricular hypertrophy.
Univariate Logistic Regression Analysis
To compare the rate of renal function decline between the patients with and without LVH, we performed univariate analyses. As shown in Table 3, the factors associated with RKFD were Hgb (odds ratio 0.981; 95% CI 0.967–0.996; P=0.015), BUN (odds ratio 1.037; 95% CI 0.997–1.079; P=0.069), LVH (odds ratio 4.291; 95% CI 1.759–10.465; P=0.001) and dyslipidemia (odds ratio 1.794; 95% CI 1.105–2.913; P=0.018). In contrast, body mass index, diabetes mellitus, and systolic and diastolic blood pressure were not associated with RKFD.
Table 3.
Factors Associated With RKFD (Univariate Logistic Regression Analysis)
| Variable | OR | 95% CI | P Value |
|---|---|---|---|
| Age | 1.001 | 0.970 to 1.033 | 0.957 |
| BMI | 1.019 | 0.950 to 1.094 | 0.591 |
| Baseline eGFR | 1.005 | 0.989 to 1.021 | 0.535 |
| SBP | 1.008 | 0.995 to 1.021 | 0.228 |
| DBP | 1.017 | 0.993 to 1.042 | 0.164 |
| Pulse | 0.995 | 0.971 to 1.020 | 0.689 |
| Hgb | 0.981 | 0.967 to 0.996 | 0.015a |
| BUN | 1.037 | 0.997 to 1.079 | 0.069a |
| UA | 1.000 | 0.998 to 1.003 | 0.711 |
| Ca | 0.713 | 0.185 to 2.748 | 0.624 |
| P | 0.710 | 0.285 to 1.766 | 0.462 |
| LVH | 4.291 | 1.759 to 10.465 | 0.001a |
| HT | 1.145 | 0.615 to 2.131 | 0.669 |
| DM | 0.673 | 0.413 to 1.097 | 0.112 |
| CHD | 1.000 | 0.464 to 2.154 | 1.000 |
| CKD | 0.953 | 0.562 to 1.615 | 0.858 |
| Dyslipidemia | 1.794 | 1.105 to 2.913 | 0.018a |
BMI indicates body mass index; BUN, blood urea nitrogen; Ca, calcium; CHD, chronic heart disease; CKD, chronic kidney disease; DBP, diastolic blood pressure; DM, diabetes mellitus; eGFR, estimated glomerular filtration rate; Hgb, hemoglobin; HT, Hypertension; LVH, left ventricular hypertrophy; OR, odds ratio; P, phosphorus; RKFD, rapid kidney function decline; SBP, systolic blood pressure; UA, serum uric acid.
Independent variables.
Multivariable Logistic Analysis
The multivariable logistic analysis showed that baseline eGFR, Hgb level, BUN, LVH, and dyslipidemia were associated with RKFD. The Hgb level was negatively correlated with the incidence of RKFD, while baseline eGFR and BUN were positively correlated with it. Patients with LVH had a much higher risk of RKFD than patients without LVH. The logistic regression analysis results and the specific odds ratios are shown in Table 4.
Table 4.
Multivariate Logistic Analysis for Predictors of RKFD
| Variable | OR | 95% CI | P Value |
|---|---|---|---|
| Baseline eGFR | 1.026 | 1.005 to 1.048 | 0.016 |
| Hgb | 0.981 | 0.965 to 0.997 | 0.023 |
| BUN | 1.059 | 1.004 to 1.116 | 0.034 |
| LVH | 4.531 | 1.823 to 11.259 | 0.001 |
| Dyslipidemia | 1.794 | 1.076 to 2.990 | 0.025 |
BUN indicates blood urea nitrogen; eGFR, estimated glomerular filtration rate; Hgb, hemoglobin; LVH, left ventricular hypertrophy; OR: odds ratio; RKFD, rapid kidney function decline.
Comparison of LVMI Between the Non‐CKD Group and Different Subgroups of CKD Patients
To compare LVMI in different subgroups of CKD patients, we classified all patients into 3 subgroups: non‐CKD, mild CKD (eGFR ≥60 mL/min per 1.73 m2), and severe CKD (eGFR <60 mL/min per 1.73 m2). Figure 2 shows that the LVMI in the 3 groups were significantly different (P=0.009). The baseline LVMI was 140 (125–160) g/m2 in the non‐CKD group, 152 (130–175) g/m2 in the mild CKD group, and 153 (133–183) g/m2 in the severe CKD group.
Figure 2.
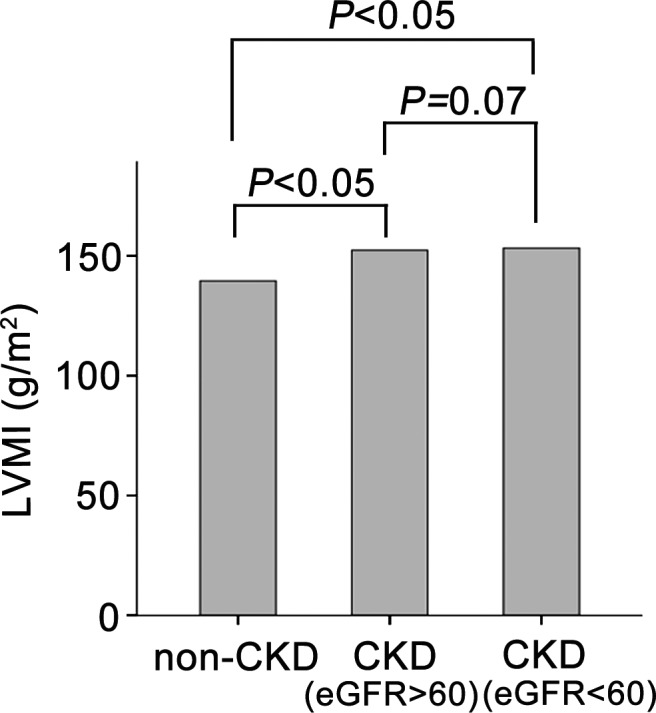
Comparison of LVMI between the non‐CKD group and different subgroups of CKD patients according to renal function. CKD indicates chronic kidney disease; eGFR, estimated glomerular filtration rate; LVMI, left ventricular mass index; non‐CKD, without chronic kidney disease.
Discussion
In the present study, we enrolled 300 elderly Chinese patients, most of whom had chronic diseases. All patients were under antihypertensive and lipid‐lowering treatments. Echocardiography was performed on all patients in order to evaluate cardiac function and calculate LVMI. The prevalence of LVH in the present study was much higher than that reported in the general population.13, 14, 15 The majority of patients included in this study had hypertension, chronic heart disease, or CKD at the time of enrollment, but their blood pressures were normal (130/70 mm Hg). Patients with LVH had a slightly higher mean blood pressure than patients without LVH, but this difference was not statistically significant (133/72 versus 130/70 mm Hg; P=0.105/0.067). Diabetes mellitus was present in 38.7% of the study subjects, and more than two thirds of the enrolled participants had CKD.
Previous studies have shown that the prevalence of LVH is higher in CKD patients and tends to increase with the progression of CKD, especially in ESRD patients.16, 17, 18, 19, 20, 21 However, few studies have focused on the effects of LVH on renal function. Some studies have found that LVH is a beneficial compensatory process in CKD patients, as it allows the left ventricle to produce additional force to increase cardiac work and maintain constant wall tension.22 However, our study obtained complete different results. To evaluate the impact of LVH on renal function in patients >60 years of age, we compared the rate of eGFR decline between patients with and without LVH. Subjects with LVH exhibited a faster renal function decline.
Moreover, in the univariate logistic regression analyses, Hgb, BUN, LVH, and dyslipidemia were associated with a higher incidence of RKFD. Considering that many studies have shown that both eGFR and albuminuria can predict the relative risk of RKFD, we included baseline eGFR and 4 other factors in the multivariate logistic analysis. After adjusting for several potential confounders, the analysis showed that the incidence rate of RKFD was significantly associated with LVH: the incidence of RKFD was ≈4.5‐fold higher in the LVH group than in the non‐LVH group.
The following is a potential explanation for how LVH accelerates the rate of eGFR decline and causes RKFD: (1) One of the predominant causes of LVH is hypertension, as it can lead to constriction of the renal arteries, afferent arterioles, and efferent arterioles and alter the glomerular membrane filtration coefficient and tubular reabsorption.23 (2) Long‐term LVH can induce left ventricular dysfunction and decrease blood perfusion in the glomeruli, resulting in renal tubular ischemia. (3) In patients with LVH, the associated inflammatory response, indicated by, for example, elevated plasma levels of high‐sensitivity C‐reactive protein and interleukin‐6, may contribute to and accelerate the progression of systolic dysfunction and cause rapid progression of CKD.10
However, the blood pressure and ejection rate were not significantly different between the LVH and non‐LVH groups in our study. Thus, there must be other pathophysiologic agents that increase the rate of renal impairment in LVH patients. The association between CKD and LVH is well known; hypertension and volume overload are major causes of CKD. It was reported that about 75% of adults that suffered CKD have LVH. Siedlecki et al identify additional mechanisms that load‐independent primary stimuli trigger or contribute to ventricular hypertrophy in uremia.24
Consistent with previous studies of RKFD and eGFR, a lower baseline eGFR is a risk factor for RKFD.25, 26 BUN was also found to be independently associated with RKFD, and a lower Hgb was found be associated with a slightly higher risk of RKFD.
Participants in the non‐CKD group were younger than those in the CKD group, probably because renal function decreases with aging and is an important factor in the increased prevalence of CKD in the elderly.27, 28 The Hgb level in the non‐CKD group was the highest among the 3 CKD groups. This might be because less erythrogenin is secreted by impaired kidneys. The levels of BUN and uric acid increased with renal injury severity. Although left atrial diameter, end‐diastolic diameter, end‐systolic diameter, ejection fraction, intraventricular septum thickness, and posterior wall thickness in diastole were not significantly different between the 3 groups, LVMI was higher in the CKD group. Previous studies found that ESRD induced LVH through the induction of hypertension or anemia,16 but few studies discussed LVMI changes in non‐ESRD patients. Our study showed that moderate renal function injury tended to be associated with a higher LVMI, even though the blood pressure levels of the patients in our study were within the normal range. However, some limitations of this retrospective cohort study must be considered: (1) This study only focused on elderly patients; therefore, the conclusions made here cannot be generalized to patients below 60 years of age. (2) The non‐LVH group contained fewer patients than the LVH group, and the follow‐up duration was relatively short. (3) The possibility of interference from therapeutic drugs was not excluded. (4) The baseline characteristics demonstrated that the samples were predominantly male and the effect modification by sex was not evaluated.
In conclusion, the results of this study showed that LVH is positively associated with renal function decline and a subsequent increased risk of RKFD; therefore, regression of LVH may serve not only to decrease cardiovascular mortality but also to maintain renal function.
Sources of Funding
This work was supported by National Natural Science Foundation of China (81300121, 81370003, 81570223, and 81400263) and Basic‐Clinical Cooperation Project of Chinese Capital Medical University (13JL59).
Disclosures
None.
(J Am Heart Assoc. 2015;4:e002213 doi: 10.1161/JAHA.115.002213)
References
- 1. Yahalom G, Kivity S, Segev S, Sidi Y, Kurnik D. Estimated glomerular filtration rate in a population with normal to mildly reduced renal function as predictor of cardiovascular disease. Eur J Prev Cardiol. 2013;21:941–948. [DOI] [PubMed] [Google Scholar]
- 2. Bhandari S. How to measure renal function in clinical practice: age affects estimated glomerular filtration rate. BMJ. 2006;333:918. [DOI] [PMC free article] [PubMed] [Google Scholar]
- 3. Kumar M, Mohan L, Dikshit H. Study of changes in renal function by perindopril and telmisartan during treatment of systemic hypertension. J Clin Diagn Res. 2014;8:C7–C09. [DOI] [PMC free article] [PubMed] [Google Scholar]
- 4. Masugata H, Senda S, Goda F, Yamagami A, Okuyama H, Kohno T, Hosomi N, Yukiiri K, Noma T, Imai M, Kiyomoto H, Nishiyama A, Kohno M. Echocardiographic assessment of the cardio‐renal connection: is left ventricular hypertrophy or diastolic function more closely correlated with estimated glomerular filtration rate in patients with cardiovascular risk factors? Clin Exp Hypertens. 2010;32:113–120. [DOI] [PubMed] [Google Scholar]
- 5. London GM. Left ventricular alterations and end‐stage renal disease. Nephrol Dial Transplant. 2002;17(suppl 1):29–36. [DOI] [PubMed] [Google Scholar]
- 6. Berl T, Henrich W. Kidney‐heart interactions: epidemiology, pathogenesis, and treatment. Clin J Am Soc Nephrol. 2006;1:8–18. [DOI] [PubMed] [Google Scholar]
- 7. Schiffrin EL, Lipman ML, Mann JF. Chronic kidney disease: effects on the cardiovascular system. Circulation. 2007;116:85–97. [DOI] [PubMed] [Google Scholar]
- 8. Faul C, Amaral AP, Oskouei B, Hu MC, Sloan A, Isakova T, Gutierrez OM, Aguillon‐Prada R, Lincoln J, Hare JM, Mundel P, Morales A, Scialla J, Fischer M, Soliman EZ, Chen J, Go AS, Rosas SE, Nessel L, Townsend RR, Feldman HI, St John Sutton M, Ojo A, Gadegbeku C, Di Marco GS, Reuter S, Kentrup D, Tiemann K, Brand M, Hill JA, Moe OW, Kuro‐O M, Kusek JW, Keane MG, Wolf M. FGF23 induces left ventricular hypertrophy. J Clin Invest. 2011;121:4393–4408. [DOI] [PMC free article] [PubMed] [Google Scholar]
- 9. Middleton RJ, Parfrey PS, Foley RN. Left ventricular hypertrophy in the renal patient. J Am Soc Nephrol. 2001;12:1079–1084. [DOI] [PubMed] [Google Scholar]
- 10. Gupta J, Dominic EA, Fink JC, Ojo AO, Barrows IR, Reilly MP, Townsend RR, Joffe MM, Rosas SE, Wolman M, Patel SS, Keane MG, Feldman HI, Kusek JW, Raj DS. Association between inflammation and cardiac geometry in chronic kidney disease: findings from the CRIC study. PLoS One. 2015;10:e124772. [DOI] [PMC free article] [PubMed] [Google Scholar]
- 11. Devereux RB, Alonso DR, Lutas EM, Gottlieb GJ, Campo E, Sachs I, Reichek N. Echocardiographic assessment of left ventricular hypertrophy: comparison to necropsy findings. Am J Cardiol. 1986;57:450–458. [DOI] [PubMed] [Google Scholar]
- 12. Andrassy KM. Comments on ‘KDIGO 2012 clinical practice guideline for the evaluation and management of chronic kidney disease’. Kidney Int. 2013;84:622–623. [DOI] [PubMed] [Google Scholar]
- 13. Schirmer H, Lunde P, Rasmussen K. Prevalence of left ventricular hypertrophy in a general population. The Tromso Study. Eur Heart J. 1999;20:429–438. [DOI] [PubMed] [Google Scholar]
- 14. Drazner MH, Dries DL, Peshock RM, Cooper RS, Klassen C, Kazi F, Willett D, Victor RG. Left ventricular hypertrophy is more prevalent in blacks than whites in the general population: the Dallas Heart Study. Hypertension. 2005;46:124–129. [DOI] [PubMed] [Google Scholar]
- 15. Paoletti E, Bellino D, Cassottana P, Rolla D, Cannella G. Left ventricular hypertrophy in nondiabetic predialysis CKD. Am J Kidney Dis. 2005;46:320–327. [DOI] [PubMed] [Google Scholar]
- 16. Nitta K, Iimuro S, Imai E, Matsuo S, Makino H, Akizawa T, Watanabe T, Ohashi Y, Hishida A. Risk factors for increased left ventricular hypertrophy in patients with chronic kidney disease. Clin Exp Nephrol. 2013;17:730–742. [DOI] [PMC free article] [PubMed] [Google Scholar] [Retracted]
- 17. Imai E, Matsuo S, Makino H, Watanabe T, Akizawa T, Nitta K, Iimuro S, Ohashi Y, Hishida A. Chronic Kidney Disease Japan Cohort study: baseline characteristics and factors associated with causative diseases and renal function. Clin Exp Nephrol. 2010;14:558–570. [DOI] [PubMed] [Google Scholar]
- 18. Bayauli MP, Lepira FB, Kayembe PK, M'Buyamba‐Kabangu JR. Left ventricular hypertrophy and geometry in type 2 diabetes patients with chronic kidney disease. An echocardiographic study. Cardiovasc J Afr. 2012;23:73–77. [DOI] [PMC free article] [PubMed] [Google Scholar]
- 19. Levin A, Thompson CR, Ethier J, Carlisle EJ, Tobe S, Mendelssohn D, Burgess E, Jindal K, Barrett B, Singer J, Djurdjev O. Left ventricular mass index increase in early renal disease: impact of decline in hemoglobin. Am J Kidney Dis. 1999;34:125–134. [DOI] [PubMed] [Google Scholar]
- 20. Nardi E, Palermo A, Mule G, Cusimano P, Cottone S, Cerasola G. Left ventricular hypertrophy and geometry in hypertensive patients with chronic kidney disease. J Hypertens. 2009;27:633–641. [DOI] [PubMed] [Google Scholar]
- 21. Tucker B, Fabbian F, Giles M, Thuraisingham RC, Raine AE, Baker LR. Left ventricular hypertrophy and ambulatory blood pressure monitoring in chronic renal failure. Nephrol Dial Transplant. 1997;12:724–728. [DOI] [PubMed] [Google Scholar]
- 22. London G. Pathophysiology of cardiovascular damage in the early renal population. Nephrol Dial Transplant. 2001;16(suppl 2):3–6. [DOI] [PubMed] [Google Scholar]
- 23. Guyton AC. Renal function curve–a key to understanding the pathogenesis of hypertension. Hypertension. 1987;10:1–6. [DOI] [PubMed] [Google Scholar]
- 24. Siedlecki AM, Jin X, Muslin AJ. Uremic cardiac hypertrophy is reversed by rapamycin but not by lowering of blood pressure. Kidney Int. 2009;75:800–808. [DOI] [PMC free article] [PubMed] [Google Scholar]
- 25. Brantsma AH, Bakker SJ, Hillege HL, de Zeeuw D, de Jong PE, Gansevoort RT. Cardiovascular and renal outcome in subjects with K/DOQI stage 1‐3 chronic kidney disease: the importance of urinary albumin excretion. Nephrol Dial Transplant. 2008;23:3851–3858. [DOI] [PubMed] [Google Scholar]
- 26. Tonelli M, Muntner P, Lloyd A, Manns BJ, James MT, Klarenbach S, Quinn RR, Wiebe N, Hemmelgarn BR. Using proteinuria and estimated glomerular filtration rate to classify risk in patients with chronic kidney disease: a cohort study. Ann Intern Med. 2011;154:12–21. [DOI] [PubMed] [Google Scholar]
- 27. Musso CG, Oreopoulos DG. Aging and physiological changes of the kidneys including changes in glomerular filtration rate. Nephron Physiol. 2011;119(suppl 1):1–5. [DOI] [PubMed] [Google Scholar]
- 28. Esposito C, Torreggiani M, Arazzi M, Serpieri N, Scaramuzzi ML, Manini A, Grosjean F, Esposito V, Catucci D, La Porta E, Dal Canton A. Loss of renal function in the elderly Italians: a physiologic or pathologic process? J Gerontol A Biol Sci Med Sci. 2012;67:1387–1393. [DOI] [PubMed] [Google Scholar]