Abstract
Background
Endocrine functions of the heart have been well established. We investigated the hypothesis that cardiac secretion of a unique phospholipase A2 recently identified by our laboratory (cardiac secreted phospholipase A2 [sPLA 2]) establishes a heart–liver endocrine axis that is negatively regulated by matrix metalloproteinase‐2 (MMP‐2).
Methods and Results
In Mmp2 −/− mice, cardiac (but not hepatic) sPLA 2 was elevated, leading to hepatic inflammation, immune cell infiltration, dysregulation of the sterol regulatory element binding protein‐2 and liver X receptor‐α pathways, abnormal transcriptional responses to dietary cholesterol, and elevated triglycerides in very low‐density lipoprotein and in the liver. Expression of monocyte chemoattractant protein‐3, a known MMP‐2 substrate, was elevated at both mRNA and protein levels in the heart. Functional studies including in vivo antibody neutralization identified cardiac monocyte chemoattractant protein 3 as a possible agonist of cardiac sPLA 2 secretion. Conversely, systemic sPLA 2 inhibition almost fully normalized the cardiohepatic phenotype without affecting monocyte chemoattractant protein‐3. Finally, wild‐type mice that received high‐performance liquid chromatography–isolated cardiac sPLA 2 from Mmp2 −/− donors developed a cardiohepatic gene expression profile similar to that of Mmp2 −/− mice.
Conclusions
These findings identified the novel MMP‐2/cardiac sPLA 2 pathway that endows the heart with important endocrine functions, including regulation of inflammation and lipid metabolism in the liver. Our findings could also help explain how MMP2 deficiency leads to cardiac problems, inflammation, and metabolic dysregulation in patients.
Keywords: heart, inflammation, liver, matrix metalloproteinase, metabolism, phospholipase A2
Introduction
Matrix metalloproteinase‐2 (MMP‐2), sometimes referred to as gelatinase A or 72 kDa collagenase, is a member of a family comprising 25 different Zn‐dependent endoproteases. A spectrum of cellular processes covering cellular proliferation, angiogenesis, and inflammation is modulated through MMP‐2–dependent cleavage and regulation of extracellular matrix components, cell membrane receptors, latent growth factors, and cytokines.1
Among the cytokines targeted by MMP‐2 is monocyte chemoattractant protein‐3 (MCP‐3 encoded by Ccl7).2, 3 MCP‐3 is a CC‐motif (N‐terminus has 2 consecutive conserved cysteine residues) chemokine that is 76 amino acids long. Binding of the hemopexin domain of MMP‐2 to MCP‐3 facilitates cleavage of MCP‐3 at a glycine/isoleucine bond. The resultant MCP‐3 peptide serves as a general antagonist of CC‐chemokine receptors that inhibits inflammation signaling by intact MCP‐3 and other chemokine receptor ligands.2
MCP‐3 is also reported to be a physiological substrate of MMP‐2 in arthritis.2 Interestingly, humans with genetic loss of MMP‐2 activity suffer from crippling arthritis4, 5, 6 and a spectrum of cardiovascular problems including congenital cardiac malformations, transposition of the great arteries, mitral valve prolapse, bicuspid aortic valve, and atrial and ventricular septal defects.4, 7 The molecular mechanisms underlying these pathologies are unknown, leaving clinicians without effective treatments.4 In addition to inflammatory diseases, obesity has been linked to single‐nucleotide polymorphisms in the human MMP2 gene8 and MMP2 gene promoter.9 Genetic loss of MMP‐2 (Mmp2 −/−) in mice results in an arthritis‐like phenotype associated with skeletal, bone, and craniofacial defects.5 In addition, Mmp2 −/− mice resist diet‐induced obesity during development,10, 11 exhibit cardiac inflammation at baseline,12 and are predisposed to hypertensive heart disease due to abnormal regulation of the sterol regulatory binding protein 2 (SREBP‐2) pathway in the heart.13
The evident coexistence of inflammation and metabolic dysregulation with MMP‐2 deficiency is of potential clinical significance but is very poorly understood. In this study, we report that the hepatic metabolic phenotype in Mmp2 −/− mice can be largely explained by a novel heart–liver axis involving myocardial secretion of a unique phospholipase A2 (PLA2), which we coined cardiac secreted PLA 2 (sPLA2).12 Our findings identify a novel functional link between cardiac inflammation and hepatic metabolism.
Materials and Methods
Oil Red O stain, alkaline phosphatase, and cholesterol were from Sigma‐Aldrich. Dulbecco minimum essential medium, antibodies against liver X receptor (LXR), TaqMan quantitative reverse transcription–polymerase chain reaction (qRT‐PCR) primers, TRIzol reagent, random primers, Superscript II, and penicillin/streptomycin were from Life Technologies. SREBP‐2 antibody was from Abcam. The “high carb” TD.88122 mouse diet (74% calories from carbohydrates) was from Harlan Laboratories. Recombinant human pro–MMP‐2 was from EMD Millipore. Collagen‐coated cell dishes were from Greiner Bio‐One. Varespladib was from Selleck Chemicals. PNGase F was from Promega. Enhanced chemiluminescence western blotting detection reagent was from GE Healthcare. Horseradish peroxidase–conjugated antirabbit antibodies and Bio‐Rad Protein Assay were from Bio‐Rad. The Pierce bicinchoninic acid protein assay kit was from Thermo Scientific. MCP‐3, neutralizing MCP‐3 antibody, and control isotype‐matched IgG1 were from R&D Systems, Inc. Densitometry was performed using ImageQuant 5.1 (Molecular Dynamics).
Animals
All protocols were approved by the University of Alberta animal care committee and conducted in accordance with institutional guidelines issued by the Canada Council on Animal Care. Except as otherwise stated, wild‐type (WT) mice aged 10 to 15 weeks were purchased from Charles River Laboratories (Wilmington, DE) or Jackson Laboratory (Bar Harbor, ME) and compared with age‐ and sex‐matched Mmp7 −/− and Mmp9 −/− mice purchased from Jackson Laboratory. Mmp2 −/− and Mmp2 +/− mice were bred at the University of Alberta. All mice were of a C57BL/6 background and were housed in the Health Sciences Laboratory Animal Services of the University of Alberta with a 12‐hour light/dark cycle. Mice were fed a chow diet ad libitum (PicoLab Rodent Diet 20; Lab Diet), which was used in all experiments unless otherwise specified. At the end of the experiments, mice were euthanized with 65 mg/kg of sodium pentobarbital, the blood was collected with EDTA‐coated syringes and tubes, and the organs were excised and snap‐frozen in liquid nitrogen. Of note, we found that Mmp2 −/− reproduced very slowly in our facility. Consequently, this study was conducted with limited numbers of mice available to us at any time. Typically, 4 to 5 mice were used per treatment group.
In Vivo Responses to Dietary Cholesterol, Fasting, and Fasting–Refeeding
The dietary regimens in these studies followed previously described protocols.14 In the cholesterol supplementation studies, Mmp2 −/− or WT mice (aged 12 to 14 weeks) were fed chow supplemented with 0% or 0.15% cholesterol for 2.5 or 6.5 days. In this study, the mice were not fasted before being euthanized. In the fasting and fasting–refeeding studies, mice (aged 10 to 22 weeks) were fasted for 16 hours or were fasted for 16 hours, fed a high‐carbohydrate diet (TD.88122 mouse diet) for 4 hours, and then euthanized.
In Vivo Pharmacological Studies
To study the contribution of systemic sPLA2 to the inflammatory and lipid metabolic phenotype of MMP‐2 deficiency, mice were gavaged with the sPLA2 inhibitor varespladib (10 mg/kg per day). The varespladib stock was prepared in dimethyl sulfoxide, as per the manufacturer's instructions, and diluted to the working concentration before each experiment. Aqueous dimethyl sulfoxide solution of the same concentration as in the varespladib working solution (equivalent to dimethyl sulfoxide 2.6 μL/kg per day) was used in control experiments (vehicle). Treatment was conducted for 2.5 or 5 days, followed by euthanasia. To study the contribution of MCP‐3 to the phenotype of MMP‐2 deficiency, Mmp2 −/− mice were injected (intraperitoneally) with neutralizing MCP‐3 antibody (0.6 mg/kg per day) for 2.5 days, and their responses were compared with those of WT mice that underwent exactly the same protocol. The dose regimen followed a previous report.3
Metabolic Studies
Metabolic caging studies were conducted at the Core Facility of the Cardiovascular Research Center, University of Alberta. Mice were individually housed in Oxymax/CLAMS metabolic chambers (Columbus Instruments) in which O2 consumption, CO2 production, food and water consumption, and movement were measured over 2 days and 2 nights.
Cell Culture Studies
Primary cardiomyocytes were isolated from WT or Mmp2 −/− mouse hearts using the classical method of retrograde perfusion with collagenase through the coronary arteries to digest the extracellular matrix of the heart.15 This method resulted in the release of calcium‐tolerant, rod‐shaped mouse cardiomyocytes from adult hearts, as confirmed by microscopy. The isolated myocytes were seeded at a density of ≈104 cells/cm2 and cultured in serum‐free Dulbecco minimum essential medium on collagen‐coated dishes. The effects of extracellular MMP‐2 or brefeldin A on sPLA2 activity were analyzed in primary cells cultured in Dulbecco minimum essential medium supplemented with 0.1% filter sterilized BSA in the absence or presence of human recombinant MMP‐2 (40 nmol/L) or brefeldin A (1 μmol/L) for 16 hours.
qRT‐PCR
Tissue was extracted by homogenizing 30 to 50 mg pieces of frozen tissue at 4°C in 1 mL of TRIzol reagent using the Bullet Blender (Next Advance). RNA was isolated from TRIzol according to the manufacturer's instructions, and cDNA was generated from RNA using random primers and Superscript II reverse transcriptase. RNA isolated for each mouse's tissue was quantitated in triplicate to obtain a value representative of the relevant tissue for each mouse. Expression analysis of the reported genes was performed by TaqMan qRT‐PCR using an ABI 7900 HT sequence detection system (Applied Biosystems). For data normalization, both Gapdh and Actb (to confirm interpretation of data relative to Gapdh) were used as internal standards at steady state. The qRT‐PCR data chosen for the figures are relative to Gapdh because we did not observe any significant quantitative differences in Gapdh versus Actb expression among WT, Mmp2 −/−, Mmp7 −/−, and Mmp9 −/− mice fed chow. The genes chosen to characterize the cardiohepatic phenotype of Mmp2 −/− mice and reported throughout the figures were found by experimentation to be differentially expressed across these genotypes of MMP deficiency and thus provide useful markers for studying the metabolic pathways modulated by these MMPs.
Protein Determinations
Colorimetric measurement of total protein was done using the Bio‐Rad Protein Assay or Pierce bicinchoninic acid protein assay kit, according to the manufacturer's instructions. Determination of hepatic liver LXR‐α and SREBP‐2 protein levels was conducted by western blotting. Briefly, 15‐ to 25‐mg liver pieces were homogenized using the Bullet Blender at 4°C in a buffer of 5 mmol/L CaCl2, 150 mmol/L NaCl, 0.5 mmol/L NaN3, and 25 mmol/L Tris, pH 7.4, with complete protease inhibitor (Roche). The homogenate was incubated for 1 hour at 37°C with 50 units of alkaline phosphatase, then NP‐40 was added to a concentration of 1%, and the samples were sonicated. The samples were incubated for 3 hours at 37°C with PNGase (10 units/μL). Homogenate was diluted at 1:5 (vol/vol) with SDS‐PAGE loading buffer (15% SDS, 8 mol/L urea, 10% 2‐mercaptoethanol, 25% glycerol, 0.2 mol/L Tris pH 6.8), heated at 37°C for 20 minutes, and subjected to 10% SDS‐PAGE using the SE260 electrophoresis system (Hoefer). Following electrophoresis, proteins were transferred to a nitrocellulose membrane using the TE22 system (Hoefer). Membranes were visualized with Ponceau S acid stain; scanned to assess protein load; blocked in 5% BSA in 20 mmol/L Tris, 150 mmol/L NaCl, pH 7.4, containing 0.1% Tween‐20; probed overnight with primary antibodies to LXR‐α or SREBP‐2; rinsed; probed for 30 minutes with secondary antibodies; and washed in 20 mmol/L Tris, 150 mmol/L NaCl, pH 7.4 containing 0.1% Tween‐20 to remove excess antibody. Immunoreactivity was revealed using enhanced chemiluminescence detection reagent.
In Vitro Assays of PLA2 Enzymatic Activity and Inhibitor Profiles
PLA2 activity was measured by 2 different methods. Dr Fernandez‐Patron's laboratory used the commercial assay kit (Cayman) with diheptanoyl thio‐phosphatidyl choline as substrate, per the manufacturer's instructions. Ex vivo tissue release of sPLA2 activity was equally measured using the Cayman kit, as described earlier.12 Confirmatory studies and the extended characterization of cardiac sPLA2 biochemical properties were conducted by Dr Lambeau's laboratory using the highly sensitive [3H]‐oleic acid–radiolabeled Escherichia coli membrane assay. Of note, E coli membranes are richer in phosphatidyl ethanolamine than in phosphatidyl choline, thus the Cayman kit and E coli assay methods display different sensitivities. For comparative biochemical characterization, cardiac and plasma sPLA2 activity was assessed in the presence and absence of a panel of inhibitors of various enzyme classes. Briefly, whole hearts (≈100 mg) were lysed in 1 mL PBS using Lysing Matrix D (Bio 101 Systems) and centrifuged at 20 000g for 15 minutes. A soluble fraction of the lysate was collected and used in analyses. Next, sPLA2 enzymatic activity was assayed at 37°C for 1 hour in 250 μL of assay buffer (0.1 mol/L Tris‐HCl, pH 8.0; 10 mmol/L CaCl2, 0.1% BSA) with the addition of ≈100 000 decays per minute of [3H]‐oleic acid–radiolabeled E coli membranes. Sample volume was adjusted in proportion to the amount of added sPLA2 and ranged from 10 to 0.003 μL (60 to 0.190 μg of total protein) for heart lysates and 3 to 0.003 μL (126 to 0.112 μg of total protein) for pools of WT and/or Mmp2 −/− plasma (4 WT and 5 Mmp2 −/− mice were used in these experiments). After the appropriate incubation time, reactions were stopped by the addition of 300 μL stop buffer (0.1 mol/L EDTA, 0.2% fatty acid‐free BSA). Samples were then centrifuged (3 minutes; 28 893 g), and the supernatant was submitted to scintillation counting.16
To assess the specificity of the observed activity, samples were incubated prior to the assay for 15 minutes at room temperature in the presence of different inhibitors: DTT (10 mmol/L, reducing agent, incubation 30 minutes at 56°C; Euromedex), EDTA (40 mmol/L, a nonspecific inhibitor of Ca2+‐dependent PLA2; Euromedex), MJ33 (30 μmol/L, PLA2 inhibitor; Santa Cruz Biotechnology), KH064 (10 μmol/L, sPLA2 inhibitor; Sigma‐Aldrich), YM 26734 (10 μmol/L, sPLA2 inhibitor; Tocris Bioscience), AACOCF3 (10 μmol/L, cytosolic PLA2 and calcium‐independent PLA2 inhibitor; Interchim), N‐(p‐amylcinnamoyl)anthranilic acid (100 μmol/L, PLA2 inhibitor; Calbiochem), bromoenol lactone (3 μmol/L, calcium‐independent PLA2 inhibitor; Interchim), or heparin (100 μg/mL, PLA2 inhibitor; Sigma‐Aldrich).
Time‐Resolved Fluoroimmunoassay for Detection of sPLA2 Protein Levels
Time‐resolved fluoroimmunoassay has equal or higher sensitivity than the [3H]‐oleic acid–radiolabeled E coli membrane PLA2 enzyme assay and was performed as described previously,17 using antibodies specific for the following sPLA2: mGIB (PLA2G1B), mGIIA (PLA2G2A), mGIID (PLA2G2D), mGIIE (PLA2G2E), mGIIF (PLA2G2F), mGV (PLA2G5), or mGX (PLA2G10)18 with 0.5 μL of pooled plasma (20 μg total protein) or 5 μL of heart lysate (31 μg total protein). Samples from 2 WT and 2 Mmp2 −/− mice were used for time‐resolved fluoroimmunoassay. Recombinant sPLA2 proteins were prepared as described19 and served as positive controls.
Measurements of Eicosanoids
Prostaglandin E2 in the heart and liver was measured by the Prostaglandin E2 Express EIA Kit (Cayman).
Oil Red O Stain
Oil Red O stain was used to image droplets containing neutral lipids (triglycerides, diglycerides, and cholesteryl esters) in 10‐μm‐thick sections of frozen liver. The sections were cut with a cryostat from Optimal Cutting Temperature‐embedded liver pieces. The sections were deposited onto glass microscope slides, stained with 0.5% Oil Red O in isopropanol, rinsed with 60% isopropanol then water, and then mounted with a coverslip for microscopic inspection.
Extraction of Lipids From Tissues
Lipids were extracted from tissues, as described previously.20 Tissue was homogenized in 8 to 30 μL of water/mg of tissue using the Bullet Blender. A total of 500 to 1000 μL of homogenate or lysate was mixed at a ratio of 3:4:8 aqueous homogenate/lysate:methanol:chloroform and vortexed for 1 minute and then centrifuged for 15 minutes to separate phases. The bottom phase containing lipids was transferred into a new tube, dried down under argon, and resuspended in 100 μL chloroform to be used for downstream lipid analysis.
Chromatographic Determinations of Lipid Content
High‐performance liquid chromatography (HPLC) and fast‐performance liquid chromatography analyses were performed at the Lipid and Lipid Metabolite Analysis Core Facility, part of the Women and Children's Health Research Institute and Faculty of Medicine and Dentistry at the University of Alberta. Hepatic lipids were extracted in the presence of 50 μg dipalmitoyl‐phosphatidyl dimethylethanolamine as an internal standard and separated by HPLC, as described previously.21 Lipid species were separated in an Onyx monolithic silica normal‐phase column (Phenomenex) using a 3‐solvent system in an 1100 series HPLC system (Agilent Technologies) and quantified using in‐line detection with an Alltech ELSD2000 evaporative light‐scattering detector (W. R. Grace). Plasma lipoprotein particles were resolved in a Superose 6 10/300 gel‐filtration fast‐performance liquid chromatography column isocratically with 50 mmol/L NaCl buffer using a 1200 series HPLC system (Agilent Technologies). Cholesterol or triglycerides in lipoproteins were detected enzymatically by in‐line reaction at 37°C.
Hepatic Cell Isolation and Flow Cytometric Analysis
Hepatic cells were isolated according to a previously described method22 with minor modifications. To enumerate absolute number of immune cell subsets, mice were fully perfused with PBS to minimize contamination of peripheral blood, and livers were cut into same‐sized (same‐volume) segments. To enumerate absolute number of immune cell subsets, mouse liver was cut into same‐sized segments. Each segment was incubated with an enzyme mixture containing 675 U/mL collagenase I, 18.75 U/mL collagenase XI, and 9 U/mL hyaluronidase (Sigma‐Aldrich) in calcium‐ and magnesium‐containing Hanks’ balanced salt solution for 40 minutes at 37°C with gentle shaking. After digestion with enzyme mix, cells were washed and further processed by percoll (Roche) gradient to enrich CD45+ immune cells. Single‐cell suspensions were incubated in culture supernatant from the 2.42G2 hybridoma (Fc receptor block, ATCC HB‐197) prior to staining with the indicated antibodies (BioLegend). Stained cells were acquired using a BD LSRFortessa flow cytometer (BD Biosciences) and analyzed with FlowJo (Tree Star). Side‐scattered light (SSClow) and forward scattering light (FSClow) dead cells and doublet cells were gated out and analyzed with FlowJo.
Isolation of Cardiac sPLA2 by a Multidimensional Orthogonal Strategy
Cardiac tissue was washed 2 times with sterile PBS, finely minced, and homogenized in sterile PBS (1 mL per 100 mg of cardiac tissue) using the Bullet Blender. The homogenate was next subjected to differential centrifugal fractionation. First, we produced a 300g pellet by centrifuging at 4°C for 10 minutes. The resultant supernatant was centrifuged at 10 000g at 4°C for 30 minutes. The resultant pellet was resuspended in 250 μL of the Cayman sPLA2 activity kit buffer (25 mmol/L Tris‐HCl, pH 7.5, 10 mmol/L CaCl2, 100 mmol/L KCl, and 0.3 mol/L Triton X‐100). An sPLA2‐rich supernatant was obtained after centrifugation at 100 000g at 4°C for 60 minutes.
Analysis of sPLA2 activity distribution reproducibly showed that the 100 000g supernatant contained most of the cardiac sPLA2, regardless of whether frozen or fresh cardiac tissue was subjected to the centrifugal fractionation scheme. We concentrated cardiac sPLA2 at −20°C by subjecting the 100 000g supernatant to precipitation with acetone. Briefly, supernatant was mixed 1:4 (vol/vol) with acetone, and protein was left to precipitate at −20°C for 2 hours. Following centrifugation at 28 893 g, the organic phase was removed, and precipitated protein was dried at 37°C for 10 minutes, sonicated, and resuspended in 250 μL of Cayman sPLA2 activity kit buffer. Aliquots were kept at −80°C for later use.
In studies to establish cardiac sPLA2 as a biological mediator and determinant of the cardiohepatic phenotype of MMP‐2–deficient mice, we subjected hearts from 5 different Mmp2 −/− mice to the earlier fractionation scheme. Next, 80 μL of the acetone concentrate was resolved using an HPLC system equipped with a size exclusion column (25 cm×4.6 mm) packed with Superdex 75 prep grade (GE Healthcare Life Sciences). The separation was carried out under isocratic conditions using sterile PBS supplemented with 10 mmol/L CaCl2 as the mobile phase and a flow rate of 200 μL/min. Fractions were collected every 10 minutes. The described combination of differential centrifugation, acetone precipitation, and size exclusion chromatography reproducibly yielded a distinct low‐molecular‐weight (<20 kDa) fraction with high cardiac sPLA2 activity and little protein content, confirmed by both SDS‐PAGE and Bradford assays. The sPLA2 activity detected when WT hearts were subjected to the above fractionation protocol was negligible. Size exclusion fractions with the most sPLA2 activity typically corresponded to fractions F6 to F8. In experiments described in this paper, fractions F6 and F7 were combined and used to intraperitoneally inject WT mice (denoted recipient mice) with or without the pan‐sPLA2 inhibitor varespladib (10 mg/kg per day) for 5 consecutive days.
Statistical Analysis
Unless otherwise indicated, the results are reported as mean±SEM. Results were analyzed with the SigmaPlot 11 software (Systat Software) using 1‐way ANOVA or Student t test, as appropriate. ANOVA with repeated‐measures analysis was conducted to determine differences among groups in time‐course experiments. Whenever the normality and equal variance assumptions were not met, statistical significance (P<0.05) was determined by applying nonparametric Wilcoxon signed rank sum tests and Kruskal–Wallis tests.
Results
Loss of MMP‐2 Affects Systemic Metabolism
Compared with age‐matched WT mice, male Mmp2 −/− mice aged 10 to 14 weeks exhibited normal food intake and reduced locomotor activity that were associated with decreased body weight and increased energy expenditure (Figure 1).
Figure 1.
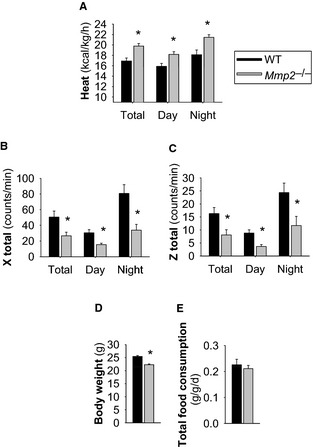
Systemic metabolic abnormalities of matrix metalloproteinase 2–deficient mice. A, Heat/energy expenditure (normalized to body weight). B and C, Locomotor activity. D, Body weight. E, Total food consumption. n=11 Mmp2 −/− mice, n=5 WT mice. *P≤0.05 vs WT. The studies were conducted in metabolic cages. WT indicates wild type.
Loss of MMP‐2 was associated with changes in hepatic and plasma lipids: Fasted Mmp2 −/− mice had elevated triglycerides in the liver (Figure 2A and 2B) and very low‐density lipoprotein (Figure 2C, top) and decreased cholesterol in high‐density lipoprotein (Figure 2C, bottom). Nonfasted Mmp2 −/− mice also had elevated hepatic triglycerides (Figure 2D).
Figure 2.
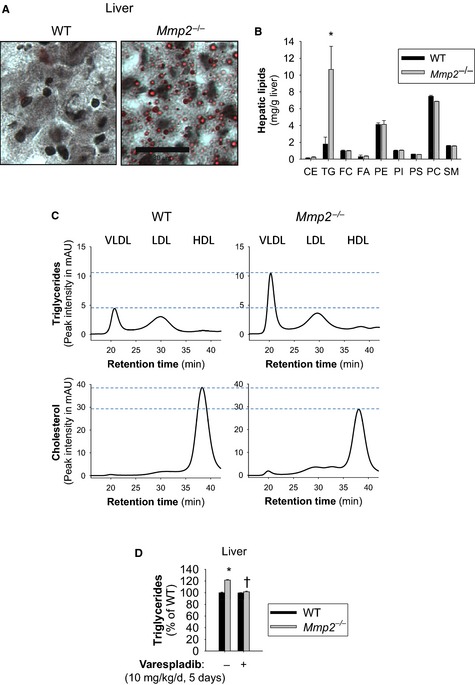
Matrix metalloproteinase 2 deficiency is associated with abnormalities in lipid storage and transport. A, Oil Red O stain of neutral lipid species from frozen liver sections of fasted mice. Scale bar=30 μm. B, Fasting levels of hepatic lipids in Mmp2 −/− vs WT mice as assessed by high‐performance liquid chromatography with in‐line evaporative light‐scattering detection. n=3 per genotype.*P<0.05 vs WT. C, Fasted TG and cholesterol levels in lipoparticle fractions of plasma separated by fast‐performance liquid chromatography (left). Traces correspond to pools of plasma from Mmp2 −/− and WT. D, Hepatic TGs were elevated in nonfasting mice. Gavage treatment with vehicle or pan–secreted phospholipase A2 inhibitor varespladib; normalized hepatic TG levels in nonfasting Mmp2 −/− mice. n=4 individual mice per genotype per group (or treatment). *P≤0.05 vs WT. † P≤0.05 vs Mmp2 −/− administered vehicle. CE indicates cholesteryl esters; FA, free fatty acids; FC, free cholesterol; HDL, high‐density lipoprotein; mAU, milliabsorbance units; LDL, low‐density lipoprotein; PC, phosphatidyl choline; PE, phosphatidyl ethanolamine; PI, phosphatidyl inositol; PS, phosphatidyl serine; SM, sphingomyelin; TG, triglyceride; VLDL, very low‐density lipoprotein; WT, wild type.
The qRT‐PCR analysis revealed Nr1h3 (encoding LXR‐α) to be the most downregulated gene in the liver of Mmp2 −/− mice (Figure 3A). Reduced LXR‐α protein was confirmed by western blotting (Figure 3B). Consistent with LXR‐α promotion of the transcription of genes involved in fatty acid synthesis,23 mRNA expression of hepatic Fasn (encoding fatty acid synthase) was repressed in Mmp2 −/− mice (Figure 3A). Likewise, expression of another LXR‐α target, lysophosphatidylcholine acyltransferase 3 (LPCAT3, encoded by Lpcat3), was downregulated (Figure 3A). LPCAT3 catalyzes the attachment of polyunsaturated fatty acids to membrane phospholipids.24, 25 Downregulation of LXR‐α and Lpcat3 (one of its target genes) suggested a potential link between the metabolic phenotype of MMP‐2 deficiency and hepatic membrane phospholipid remodeling, a process potentially associated with inflammation signaling in MMP‐2–deficient mice12 and that was investigated in the experiments described below.
Figure 3.
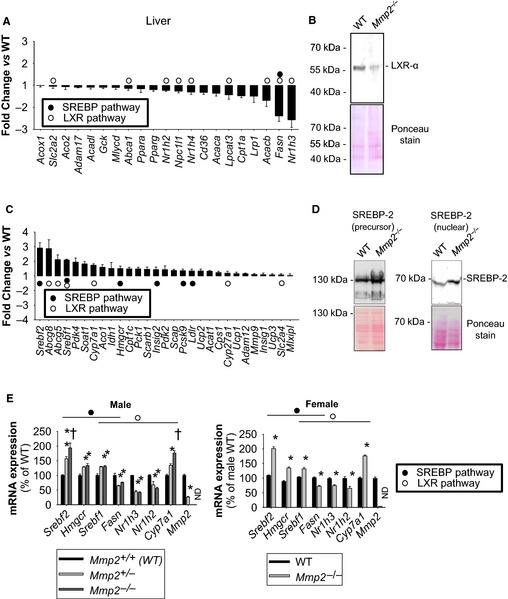
Lipid metabolic gene expression profile analysis of the hepatic phenotype of MMP‐2–deficient mice. A, qRT‐PCR analysis identified several downregulated metabolic genes in Mmp2 −/− mice. These results are representative of 4 mice per genotype. The data for the LXR‐α (encoded by Nr1h3) pathway genes were confirmed in multiple studies and different batches of WT and Mmp2 −/− mice. B, Western blot confirming reduced hepatic LXR‐α protein in Mmp2 −/− mice. Pool of 4 per genotype. C, qRT‐PCR analysis identified several upregulated metabolic genes in Mmp2 −/− mice. These results are representative of 4 mice per genotype. The data for the SREBP‐2 (encoded by Srebf2) pathway genes were confirmed in multiple studies and different batches of WT and Mmp2 −/− mice. D, Western blot confirming elevated hepatic SREBP‐2 protein in Mmp2 −/− mice. Pool of 4 per genotype. E, The major lipid metabolic gene expression abnormalities of MMP‐2 deficiency are present in both sexes and in haploinsufficient mice. (Left) Male mice with both copies (Mmp2 +/+), lacking 1 copy (Mmp2 +/−), or lacking both copies (Mmp2 −/−) of Mmp2. n=4 for Mmp2 +/+ and n=4 for Mmp2 −/−, n=3 for Mmp2 +/−. *P≤0.05 vs WT. † P≤0.05 vs Mmp2 +/−. (Right) Female mice. n=5. *P≤0.05 vs WT. LXR‐α indicates liver X receptor α; MMP‐2, matrix metalloproteinase 2; ND, not detected; qRT‐PCR, quantitative reverse transcription–polymerase chain reaction; SREBP‐2, sterol regulatory binding protein 2; WT, wild type.
The hepatic gene expression phenotype in Mmp2 −/− mice was complex, with some LXR‐α target genes being significantly upregulated, for example, cholesterol 7α‐hydroxylase (the rate‐limiting enzyme in the classical bile acid biosynthesis pathway, encoded by Cyp7a1) and ATP‐binding cassette G5 and G8 (2 cholesterol transporters, encoded by Abcg5 and Abcg8) (Figure 3C).
Moreover, we detected increased hepatic expression of the transcription factor SREBP‐2 (encoded by Srebf2) and many of its target genes including Hmgcr, Ldlr, and Pcsk9 in Mmp2 −/− mice (Figure 3C). Hmgcr encodes 3‐hydroxy‐3‐methylglutaryl‐coenzyme A reductase, the rate‐limiting enzyme in the cholesterol and isoprenoid synthesis pathways. Ldlr encodes the low‐density lipoprotein receptor, which is involved in clearance of low‐density lipoprotein from circulation. Pcsk9 encodes proprotein convertase subtilisin/kexin type 9, a protein that binds and negatively regulates hepatic low‐density lipoprotein receptor protein levels.26 The upregulation of SREBP‐2 protein and its proteolytically processed transcriptionally active form (nuclear SREBP‐2) was confirmed by western blotting (Figure 3D) and was restricted to cardiac and hepatic tissues (Figure S1). LXR‐α and SREBP‐2 expression profiles were similar in Mmp2 −/− and haploinsufficient (Mmp2 +/−) mice (Figure 3E, left panel). Furthermore, male and female Mmp2 −/− mice exhibited similar gene expression profiles, demonstrating lack of sexual dimorphism in the regulation of LXR‐α or SREBP‐2 by MMP‐2 (Figure 3E, right panel).
Loss of MMP‐2 (or MMP‐7 or MMP‐9, as determined in studies with Mmp7 −/− and Mmp9 −/− mice) (Figure S2) had only a limited impact on carbohydrate and nitrogen metabolism and bile acid production. Of note, insulin resistance was evident in the stress phase of the insulin‐tolerance test, which is driven by adrenocorticotropic hormone–mediated signals such as cortisol release from the adrenals.27 These data revealed MMP‐2 as a modulator of the hepatic LXR and SREBP pathways.
MMP‐2 Modulates Transcriptional Responses to Dietary Cholesterol
To investigate the contribution of MMP‐2 to hepatic transcriptional responses to metabolic cues, we subjected mice to dietary cholesterol supplementation. Dietary cholesterol inhibits the SREBP‐2 pathway to decrease hepatic synthesis and uptake of cholesterol; at the same time, oxysterols activate LXR‐α signaling to increase the clearance of hepatic cholesterol.28, 29 Consistently, WT mice fed chow supplemented with 0.15% cholesterol exhibited decreased hepatic expression of Srebf2 and Hmgcr along with a powerful induction of Cyp7a1 and Cyp27a, 2 rate‐limiting enzymes in the bile acid synthesis pathways. In contrast, in Mmp2 −/− mice, the same genes (ie, Srebf2, Hmgcr, Cyp7a1, and Cyp27a) showed blunted transcriptional responses reminiscent of a hepatic insensitivity to dietary cholesterol, whereas other genes such as Srebf1 and Fasn, were clearly uncoupled in their responses (Figure 4). These data identified MMP‐2 as a modulator of hepatic transcriptional responses to dietary cholesterol.
Figure 4.
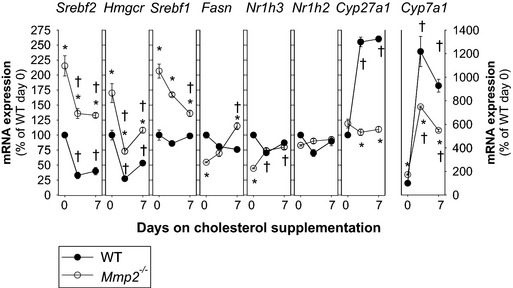
Time course of hepatic transcriptional responses to dietary cholesterol supplementation. Mice were fed either chow or chow supplemented with 0.15% cholesterol for up to 1 week. Gene expression analysis was conducted at 0, 2.5, and 7 days. Analysis involved a total of 12 Mmp2 −/− mice and 12 WT mice (n=4 mice per time point). *P<0.05 vs WT. † P<0.05 vs 0 days on cholesterol. WT, wild type.
A Heart–Liver Axis Mediated by Cardiac sPLA2 and Negatively Regulated by MMP‐2
Cardiac sPLA2 localizes to cardiomyocytes
Recently, we reported an MMP‐2/cardiac sPLA2 mechanism that modulates blood pressure homeostasis, cardiac inflammation, and lipopolysaccharide‐induced fever.12 We confirmed the heart as a major source of systemic sPLA2 activity in Mmp2 −/− mice (Figure 5A). We also detected elevated sPLA2 activity in the aorta but not in skeletal muscle or the liver (Figure 5A). Ex vivo release of sPLA2 activity was evident from the heart but not from the liver (Figure 5A and inset). Cardiac sPLA2 activity was significantly elevated in Mmp2 −/− mice (versus WT) whether the substrate was diheptanoyl thio‐phosphatidyl choline or [3H]‐oleic acid–radiolabeled E coli membranes. Analysis of plasma sPLA2 activity with the highly sensitive E coli membrane assay indicated a 1000‐fold elevation in Mmp2 −/− mice (Figure 5A inset, Figure S3). Cardiac sPLA2 activity was evenly distributed across left and right cardiac atria and ventricles (Figure 5B). Cardiomyocytes isolated from Mmp2 −/− whole hearts displayed significantly elevated intracellular sPLA2 activity (Figure 5C). Culture of Mmp2 −/− cardiomyocytes with recombinant human MMP‐2 at 40 nmol/L, a concentration that approximates that of plasma MMP‐2, reduced sPLA2 activity (Figure 5C, left panel). Brefeldin A (1 μmol/L), an inhibitor of the classical secretory pathway at the level of the endoplasmic reticulum to Golgi transition, blunted sPLA2 activity in Mmp2 −/− cardiomyocytes (Figure 5C, right panel).
Figure 5.
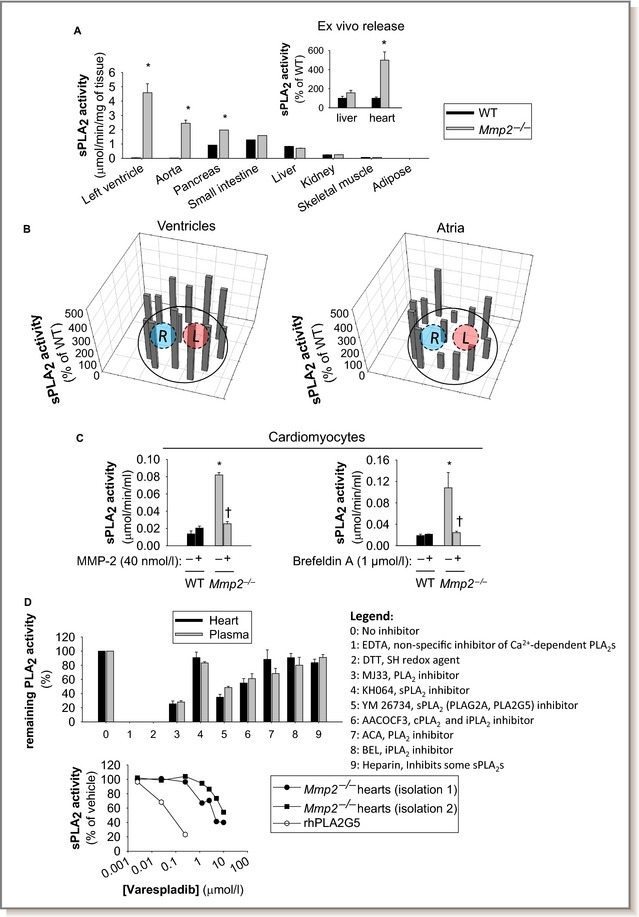
Tissue profiling and intracardiac localization of sPLA 2. A, The heart is the predominant source of sPLA 2 activity in Mmp2 −/− mice. The sPLA 2 activity (pools of 4 mice per genotype) was analyzed in duplicate. *P≤0.05 vs WT (statistical unit was the duplicate). (Inset) Ex vivo release of sPLA 2 activity was elevated for specimens of left ventricle, but not liver, from Mmp2 −/− mice. Ex vivo release results are representative of 3 determinations conducted on different days with different mice.*P≤0.05 vs WT. B, Intracardiac distribution of sPLA 2 activity in Mmp2 −/− mice. Frozen heart sections (≈1 mm thick) were divided into pieces with approximately equal surface area (≈1 mm2), homogenized, and individually assessed for sPLA 2 activity. Diagrams present mean values of sPLA 2 activity normalized to protein content in each piece of tissue. n=3 mice per genotype. C, Cardiac sPLA 2 localizes to cardiomyocytes. Isolated Mmp2 −/− cardiomyocytes grown on 6‐well plates in MMP‐free media had significantly elevated intracellular sPLA 2 activity that was blunted by extracellular MMP‐2 and brefeldin A. Intracellular sPLA 2 activity pooled from 3 individual wells (≈105 cells per well) and analyzed in duplicate per genotype. *P≤0.05 vs WT untreated (−). † P≤0.05 vs Mmp2 −/− untreated (−). No activity was detected in conditioned media. Results are representative of 3 independent preparations of cardiomyocytes. D, (Top) PLA 2 activity inhibitor profiling indicates that cardiac sPLA 2 is present in plasma. Pools of 4 WT and 5 Mmp2 −/− were analyzed in duplicate. (Bottom) Varespladib inhibition clearly differentiated between sPLA 2 from Mmp2 −/− heart homogenates and human (rh)PLA2G5. Comparison of the enzyme obtained in 2 independent heart homogenizations corresponding to 8 different Mmp2 −/− mice. AACOCF3 indicates Arachidonyl trifluoromethyl ketone; ACA, N‐(p‐amylcinnamoyl)anthranilic acid; BEL, bromoenol lactone; cPLA2, cytosolic phospholipase A2; DTT, dithiothreitol; iPLA2, calcium‐independent phospholipase A2; L, left; MMP‐2, matrix metalloproteinase‐2; R, right; rh, recombinant human; SH, sulfhydryl; sPLA2, secreted phospholipase A2; WT, wild type; YM 26734, 1,1′‐[5‐[3,4‐Dihydro‐7‐hydroxy‐2‐(4‐hydroxyphenyl)‐2H‐1‐benzopyran‐4‐yl]‐2,4,6‐trihydroxy‐1,3‐phenylene]bis‐1‐dodecanone.
Cardiac sPLA2, an elusive unique enzyme, circulates in plasma
We reported previously that cardiac and plasma sPLA2 had similar molecular weights (≈18–20 kDa), had similar apparent Michaelis–Menten constants for diheptanoyl thio‐phosphatidyl choline of ≈235 μmol/L, required calcium for activity, and were not cleaved or inactivated by incubation with MMP‐2.12 Cardiac and plasma sPLA2 had strikingly similar activity profiles against a panel of inhibitors indicative that the cardiac enzyme is present in the circulation (Figure 5D, top panel). The pan‐sPLA2 blocker varespladib30 decreased cardiac sPLA2 activity with a half maximal inhibitory concentration of 10 μmol/L, similar to what we reported for indoxam (≈2 μmol/L)12 and different from PLA2G5 (Figure 5D, bottom panel). Using a time‐resolved fluorescence immunoassay with highly specific antibodies against various mouse sPLA2 isoforms, we excluded PLA2G1B, PLA2G2A/2D/2E/2F, PLA2G5, and PLA2G10 as major components of either cardiac or plasma sPLA2 in Mmp2 −/− mice (Figure S4).
Systemic sPLA2 activity contributes to the hepatic inflammatory and lipid metabolic phenotype of MMP‐2 deficiency
Treatment of Mmp2 −/− mice with the pan‐sPLA2 inhibitor varespladib (10 mg/kg per day) reduced sPLA2 activity time dependently to baseline (ie, WT) levels in the heart (Figure 6A, left) and in plasma (Figure 6A, right). Furthermore, varespladib normalized numerous lipid metabolic genes (in particular, Nr1h3 [encodes LXR‐α] and Srebf2 [encodes SREBP‐2]) and proinflammatory markers in the liver (Figure 6B) and the heart (Figure 6C) as well as immune cell infiltration in the liver of Mmp2 −/− mice (Figure 7). Similarly, varespladib lowered prostaglandin E2 levels in the heart and liver (Figure S5) and normalized the levels of hepatic triglycerides in Mmp2 −/− mice (Figure 2D).
Figure 6.
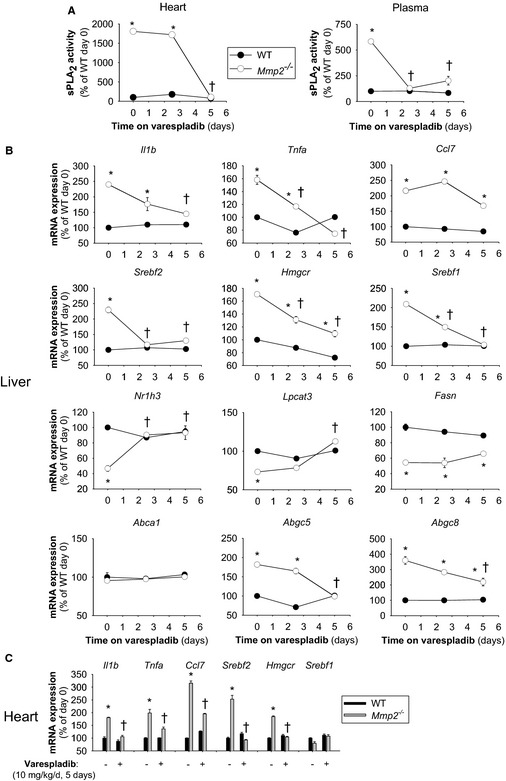
High systemic sPLA 2 activity sustains the inflammatory and lipid metabolic gene expression phenotype of matrix metalloproteinase 2–deficient mice. A, Cardiac and plasma sPLA 2 activity in Mmp2 −/− mice administered the pan‐sPLA 2 inhibitor varespladib (10 mg/kg per day). B, Hepatic expression of inflammatory and lipid metabolic genes in mice administered varespladib (10 mg/kg per day). C, Cardiac expression of inflammatory and lipid metabolic genes in administered varespladib (10 mg/kg per day). Analysis of 12 mice per genotype (n=4 per time point). *P≤0.05 vs WT (time 0 days). † P≤0.05 vs Mmp2 −/− (time 0 days). sPLA2 indicates secreted phospholipase A2; WT, wild type.
Figure 7.
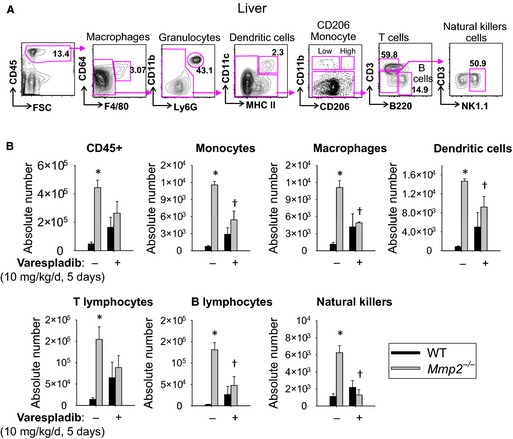
Hepatic immune cell infiltration in matrix metalloproteinase 2–deficient mice depends on high systemic sPLA 2 activity. A, Gating strategy for infiltrating immune cells (CD45+), hepatic macrophages (CD64+F4/80+), dendritic cells (CD11c+ MHC II +), monocytes (CD206Low CD11b+), T cells (CD3+), B cells (B220+), and natural killer cells (NK1.1+). B, Hepatic immune cell infiltration in Mmp2 −/− mice administered the pan‐sPLA 2 inhibitor varespladib (10 mg/kg per day, gavage, for 5 days). Collagenase‐treated and liberated cells were surface‐stained for indicated markers (A) and quantitated. n=3 WT and n=5 Mmp2 −/−. *P≤0.05 vs WT untreated. † P≤0.05 vs Mmp2 −/− untreated. MHC II, major histocompatibility complex II; sPLA2, secreted phospholipase A2; SSC, Side‐scattered light (a magnitude proportional to cell granularity or internal complexity); WT, wild type.
Adaptive transfer of cardiac sPLA2 evokes the cardiohepatic phenotype of MMP‐2–deficient mice
When HPLC‐isolated cardiac sPLA2 from Mmp2 −/− donors was injected into WT mice (fractions F6 and F7), the recipient WT mice displayed highly elevated plasma and cardiac sPLA2 activity (Figure 8). Moreover, the cardiohepatic gene expression profile of WT mice that received HPLC‐isolated cardiac sPLA2 from Mmp2 −/− donors was strikingly similar to that of Mmp2 −/− mice. The phenotypic changes evoked by cardiac sPLA2 from Mmp2 −/− donors were blunted in mice that also received the pan‐sPLA2 inhibitor varespladib (Figure 9).
Figure 8.
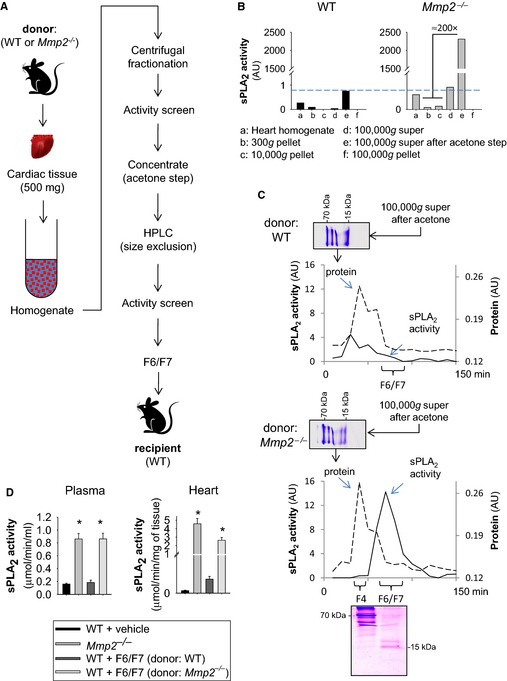
HPLC isolation of biologically active cardiac sPLA 2. A, Strategy for isolation of biologically active cardiac sPLA 2 for in vivo studies. Hearts from 5 Mmp2 −/− or WT mice were pooled to obtain sufficient cardiac sPLA 2 for in vivo characterization. B, Representative centrifugal fractionation. Note that the 100 000g supernatant fraction is rich in active cardiac sPLA 2, and WT hearts express negligible cardiac sPLA 2 activity, as opposed to Mmp2 −/− hearts. C, Representative HPLC isolation of active cardiac sPLA 2 and Coomassie blue–stained 16% T, 3% C Tricine–SDS‐PAGE gels of 100 000g supernatant before and after size‐exclusion fractionation. D, Phenotypes induced by HPLC fractions F6 and F7 from Mmp2 −/− donors vs WT donors in recipient WT mice. Injection of HPLC fractions F6 and F7 from Mmp2 −/− donors (but not from WT donors) evoked high sPLA 2 activity in both plasma and the heart of WT recipient mice after 5 consecutive injection‐days. For comparison, we show the levels of activity in intact Mmp2 −/− mice. WT plus vehicle: Mice received 100 μL of HPLC mobile phase (vehicle) consistent with sterile PBS, 10 mmol/L CaCl2. WT plus fractions F6 and F7: Mice received HPLC fractions F6 and F7 from WT donors and from Mmp2 −/− donors. *P≤0.05 vs WT. n=4 mice per treatment. AU indicates arbitrary units; HPLC, high‐performance liquid chromatography; sPLA2, secreted phospholipase A2; WT, wild type.
Figure 9.
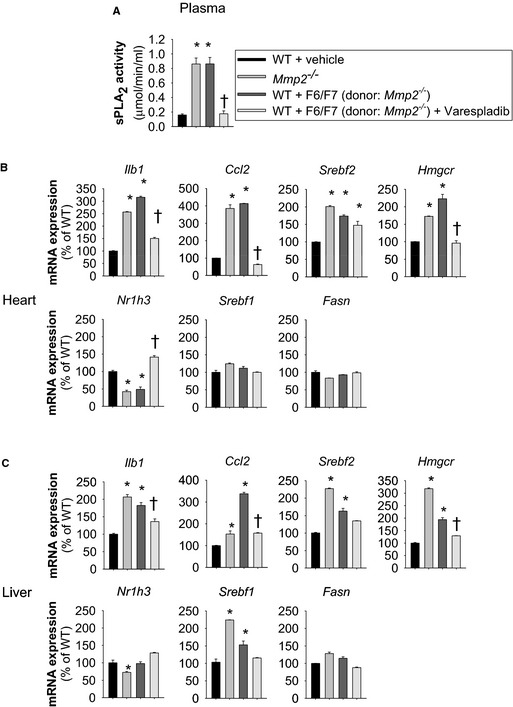
Cardiac sPLA 2 is a biological mediator and determinant of the cardiohepatic phenotype of matrix metalloproteinase 2–deficient mice. A, The increase in plasma sPLA 2 evoked by high‐performance liquid chromatography–isolated cardiac sPLA 2 from Mmp2 −/− donors was prevented by coadministering varesladib (10 mg/kg per day). B and C, Increased plasma sPLA 2 was associated with a cardiohepatic gene expression profile very similar to that of Mmp2 −/− mice. These changes were prevented by coadministering varespladib. n=4 mice per group. *P≤0.05 vs WT. † P≤0.05 vs WT+F6/F7 (donor: Mmp2 −/−). sPLA2 indicates secreted phospholipase A2; WT, wild type.
No phenotypic transformation was evident in mice that received the HPLC fractions F6 and F7 from WT donors, which, despite originating from the same amount (500 mg) of cardiac tissue, contained negligible sPLA2 activity (Figure S6).
These results clearly show that circulating cardiac sPLA2 is a biological mediator and determinant of the cardiohepatic phenotype of MMP‐2–deficient mice. Taken together with the potent in vivo effects of varespladib on sPLA2 activity (Figure 6), the upregulation of both plasma and cardiac sPLA2 in WT mice administered HPLC‐isolated cardiac sPLA2 from Mmp2 −/− donors is consistent with the autocrine feed‐forward loop proposed previously for sPLA2.12, 31
Evidence in support of MCP‐3 as an agonist of cardiac sPLA2
The data to date indicate that cardiac sPLA2 is a unique enzyme produced and released by cardiomyocytes into plasma, where it circulates and affects liver function. Furthermore, cardiac sPLA2 intracellular activation is inhibited by extracellular MMP‐2, likely by blocking an agonist.
To identify possible triggers of cardiac sPLA2 activity, we first examined the impact of feeding and fasting. Neither fasting nor fasting and refeeding with a high‐carbohydrate diet (Figure S7) or dietary supplementation with polyunsaturated fatty acids (data not shown) or cholesterol12 affected cardiac sPLA2 activity.
Second, we examined the influence of circadian rhythm on cardiac sPLA2 activity. We observed small increases in the mRNA levels for conventional sPLA2 isoforms in Mmp2 −/− mice euthanized at night but no differences in cardiac sPLA2 activity at night (9:30 pm±0.5 hour) versus day (11:30 am±0.5 hour) (Figure S8).
Third, we examined whether MCP‐3 (a proinflammatory CC‐chemokine bound, cleaved, and inactivated by MMP‐22) had the potential to induce cardiac sPLA2 activation or secretion.
Although Ccl7 mRNA (encodes MCP‐3) was elevated at baseline in both Mmp2 −/− liver and heart (Figure 6B and 6C), MCP‐3 protein levels were significantly elevated only in the heart, not in the liver or plasma, of Mmp2 −/− mice (Figure 10). The reason for the cardiac‐specific overexpression of MCP‐3 was not investigated further.
Figure 10.
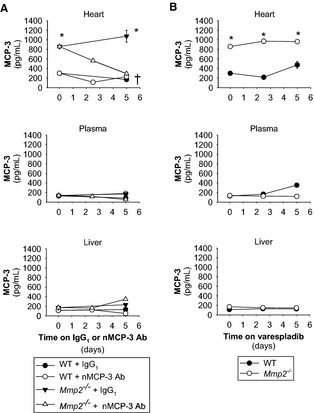
Cardiac MCP‐3 expression is upregulated in Mmp2 −/− mice and unrelated to systemic secreted phospholipase A2 activity. A, MCP‐3 protein levels in the heart, plasma, and liver of mice administered nMCP‐3 Ab or isotype‐matched IgG1 (0.6 mg/kg per day). Results are representative of 19 to 20 mice per genotype (n=3 to 4 mice per time point). *P≤0.05 vs WT at day 0. † P≤0.05 vs Mmp2 −/− plus IgG1 at day 5. Note that the data presented for day 2.5 refer to pools of 3 to 4 mice for which MCP‐3 levels were measured in duplicate; for simplicity, no statistical analysis is indicated at day 2.5. B, MCP‐3 protein levels in the heart, plasma, and liver of mice administered varespladib (10 mg/kg per day). Results are representative of 12 to 13 mice per genotype (3 to 5 mice per time point were pooled and MCP‐3 levels were measured in duplicate). *P≤0.05 vs WT at day 0. † P≤0.05 vs Mmp2 −/− at day 5. MCP‐3 indicates monocyte chemoattractant protein 3; nMCP‐3 Ab, neutralizing MCP‐3 monoclonal antibody; WT, wild type.
To assess the in vivo significance of MCP‐3 for cardiac sPLA2 activity, we injected mice with either neutralizing MCP‐3 monoclonal antibody or isotype‐matched IgG1 at a dose (0.6 mg/kg per day, intraperitoneally) validated in a previous study.3 Neutralizing MCP‐3 antibody (but not control IgG1) treatment normalized cardiac MCP‐3 protein levels in Mmp2 −/− mice (Figure 10). Ex vivo incubation during 3 hours with MCP‐3 (200 nmol/L) enhanced the release of sPLA2 activity by 87% from WT heart and 39% from Mmp2 −/− heart; however, sPLA2 release from liver was unchanged regardless of genotype (Figure 11). Most important, neutralizing MCP‐3 antibody (but not IgG1) fully normalized cardiac and plasma sPLA2 activity in Mmp2 −/− mice (Figure 12A). Neutralizing MCP‐3 antibody partially restored gene expression of Mmp2 −/− mice including LXR‐α, SREBP‐2, and inflammatory markers in the heart (Figure 12B) and liver (Figure 12C). In contrast to neutralizing MCP‐3 antibody, systemic sPLA2 inhibition with varespladib did not normalize MCP‐3 protein expression in the heart of Mmp2 −/− mice (Figure 10). These results identified cardiac MCP‐3 as a possible agonist acting upstream of cardiac sPLA2; however, the possibility that other cytokines or mechanisms contribute to cardiac sPLA2 activation or release warrants further research.
Figure 11.
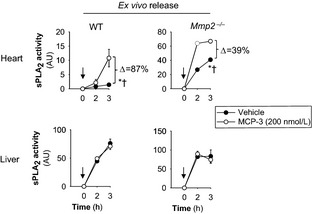
MCP‐3 enhances sPLA 2 activity release from myocardium. MCP‐3 enhanced the ex vivo release of sPLA 2 activity from heart but not liver. Freshly dissected specimens of the indicated organs (≈2 mm3) were subjected to the ex vivo release bioassay described previously12 in the presence or absence of MCP‐3 (200 nmol/L). n=3 mice. Arrows indicate when MCP‐3 or PBS (vehicle) was added. *P≤0.05 vs time 0 hours. † P≤0.05 vs vehicle (passive ex vivo release). MCP‐3 indicates monocyte chemoattractant protein 3; sPLA2, secreted phospholipase A2; WT, wild type.
Figure 12.
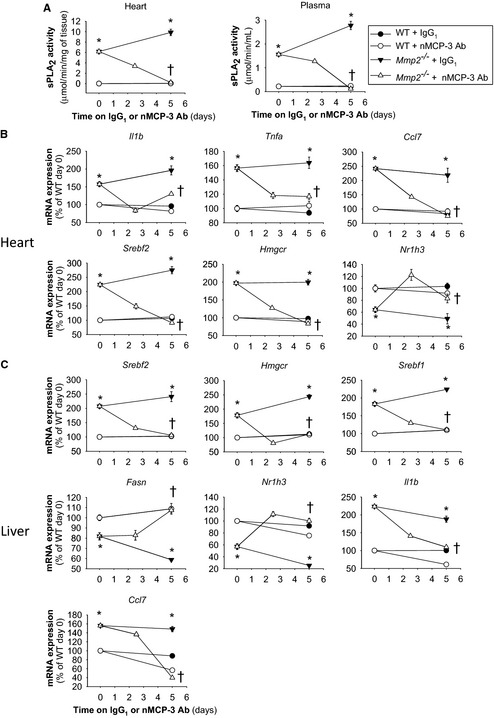
MCP‐3 affects the cardiohepatic phenotype of Mmp2 −/− mice mimicking effects of sPLA 2. A, Cardiac and plasma sPLA 2 activity levels in mice administered nMCP‐3 Ab or isotype‐matched IgG1 (0.6 mg/kg per day). B, Cardiac gene expression in mice administered nMCP‐3 Ab or IgG1 (0.6 mg/kg per day). C, Hepatic gene expression in mice administered nMCP‐3 Ab or IgG1 (0.6 mg/kg per day). Analysis of 9 to 12 mice per genotype (n=3 to 4 per time point). *P≤0.05 vs WT (time 0 days). † P≤0.05 vs Mmp2 −/− (time 0 days). AU indicates arbitrary units; MCP‐3, monocyte chemoattractant protein 3; nMCP‐3 Ab, neutralizing MCP‐3 monoclonal antibody; sPLA2, secreted phospholipase A2; WT, wild type.
Discussion
Our study identified a novel endocrine function of the heart: the production and secretion of a unique PLA2 by cardiomyocytes. Secretion of cardiac sPLA2 into the plasma enables a previously unknown heart–liver axis that is activated, at least in part, by the proinflammatory CC‐chemokine MCP‐3 and negatively regulated by extracellular MMP‐2, which cleaves MCP‐3.2 This heart–liver endocrine axis profoundly influences the inflammatory and lipid metabolic gene expression characteristics of the liver, effectively increasing the levels of hepatic and very low‐density lipoprotein triglycerides. Because the heart is a major user of very low‐density lipoprotein triglycerides, the MMP‐2/cardiac sPLA2 system may enable the heart to signal the liver to satisfy the energy needs (Figure 13). Our findings identify cardiac sPLA2 as a key biological mediator of the cardiohepatic phenotype associated with MMP‐2 deficiency in mice. These findings could also help explain how MMP2 deficiency leads to cardiac problems and delayed growth in patients.4, 5, 6, 32
Figure 13.
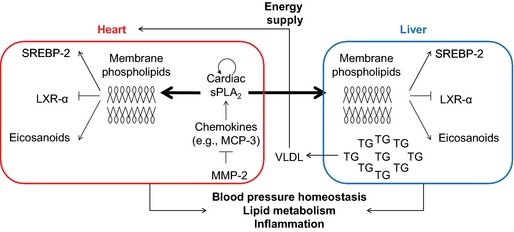
Proposed model for a novel heart–liver axis mediated by cardiac sPLA2. Key elements of the proposed model are the heart (source and autocrine/paracrine target of cardiac sPLA 2), MCP‐3 (agonist of cardiac sPLA 2), MMP‐2 (endogenous inhibitor), cardiac sPLA 2 (signaling molecule), and liver (a noncardiac target of cardiac sPLA 2). We propose that, under physiological conditions, MMP‐2 activity maintains low levels of certain chemokines, such as MCP‐3, by proteolysis.2, 3 MMP‐2 deficiency (due to functional blockade or genetic deletion) and MCP‐3 may trigger cardiac sPLA 2 release from the heart. Cardiac sPLA 2 circulates in the plasma, reaching distant target organs (eg, liver) and affecting the inflammatory and lipid metabolic phenotype of these organs. The MMP‐2/cardiac sPLA 2 system may serve multiple purposes including signaling to the liver to provide the heart with TGs and maintaining systemic blood pressure homeostasis. LXR‐α indicates liver X receptor‐α; MCP‐3 indicates monocyte chemoattractant protein 3; MMP‐2, matrix metalloproteinase 2; sPLA2, secreted phospholipase A2; SREBP‐2, sterol regulatory binding protein 2; TG, triglyceride; VLDL, very low‐density lipoprotein.
The endocrine function of the heart was first suggested in the days of the discovery of the circulatory system by William Harvey in the 17th century.33 The concept has since evolved through the work of many. In 1921, Loewi discovered the release of acetylcholine from cardiac sympathetic nerves.34 Investigations conducted between 1971 and 1983 by de Bold's team revealed the secretion of cardiac natriuretic peptides from granules present in the atria (but absent in ventricles).35 In addition to natriuresis, cardiac natriuretic peptides mediate vasodilation in the failing heart,35 increase glucogenesis in the liver,36 regulate lipolysis in adipocytes,37 and promote thermogenesis and energy expenditure.38 The heart is also source, albeit not exclusively, of other polypeptide hormones, including adrenomedullin and endothelins, which—acting in autocrine, paracrine, and endocrine fashion—provide additional cardiovascular and metabolic regulatory mechanisms.35 Likewise, the heart may regulate white adipose tissue and liver function through as‐yet‐unidentified factors produced and released downstream of mediator complex subunit 13, a protein with transcription that is negatively regulated by the heart‐specific microRNA‐208a. This latter mechanism may promote resistance to obesity induced by a high‐fat diet and improve insulin sensitivity.39, 40 Bidirectional interactions between the heart and the liver have been demonstrated in mice bearing a hypertrophic cardiomyopathy‐causing mutation in myosin (R403Q).41 This mutation is associated with decreased cardiac lipid uptake and increased plasma and hepatic lipid content together with increased gluconeogenesis and blood glucose that may ultimately exacerbate cardiac disease.41
Our previous studies revealed autocrine/paracrine actions of cardiac sPLA2 involving the modulation of inflammatory and lipid metabolic gene expression in the heart.12 Furthermore, we documented the systemic effects of cardiac sPLA2 on systolic blood pressure and fever.12 Extending these observations, our current research identifies the liver as the first target organ of cardiac sPLA2.
Pioneering work on MMP‐2–deficient mice revealed lipodystrophy as an important trait.11 In this study, we identified new metabolic traits of MMP‐2 deficiency. These include (1) hepatic lipid deposition; (2) altered expression of transcription factors and enzymes involved in sensing, biosynthesis, and catabolism of lipids in the liver; (3) altered transcriptional responses to dietary cholesterol; and (4) abnormal oxygen consumption and locomotor activity patterns.
Our study provides several lines of evidence indicating that this complex phenotype is caused, at least in part, by activation of a heart–liver axis mediated by cardiac sPLA2. This axis is broken down as follows. First, systemic absence of MMP‐2 increases the bioavailability of MCP‐3; this was shown by the cardiac‐specific excess of MCP‐3 protein observed in this study. Second, MCP‐3 enhances cardiac sPLA2 release. Once secreted, cardiac sPLA2 reaches distant target organs (eg, liver) where hydrolysis of the outer leaflet of membrane phospholipids releases sn‐2 esterified fatty acids.42, 43 Such fatty acids include precursors of eicosanoids and ligands of nuclear metabolic transcription factors such as LXR‐α.25, 43, 44 Downstream changes in the transcription of multiple inflammatory and lipid metabolic genes would profoundly affect cardiac, hepatic, and systemic metabolism.45, 46, 47, 48, 49 Indeed, we detected abnormally high prostaglandin E2 levels and significant dysregulation of the LXR‐α and SREBP‐2 pathways in the liver of MMP‐2–deficient mice. Moreover, these mice exhibited hepatic immune cell infiltration, specifically, monocytes and macrophages, which are key cells for inflammation. We also detected elevated numbers of dendritic cells, T cells, B cells, and natural killer cells; however, the contribution of these cell types to the observed phenotype requires further investigations.
Importantly, treatment of mice with the pan‐sPLA2 inhibitor varespladib almost fully normalized the altered expression of the lipid metabolic pathways and inflammation in Mmp2 −/− mice. The beneficial effects of varespladib were not attributed to reduction in MCP‐3 levels but rather to inhibition of sPLA2 activity.
MMP‐2 serves as a metabolism modulatory signal and may exert multipronged anti‐inflammatory actions.2, 11, 50, 51 Consequently, one may expect that pharmacological MMP‐2 inhibition could affect metabolic and inflammatory pathways, perhaps by elevating cardiac sPLA2, as we demonstrated recently for doxycycline.12 Currently, doxycycline is the only MMP inhibitor approved by the US Food and Drug Administration for clinical use. The therapeutic efficacy of doxycycline‐based formulations are currently being explored in pathologies associated with extracellular matrix destruction and inflammation such as periodontitis, arthritis, Marfan syndrome, atherosclerosis, and arterial aneurysm.52, 53 Our findings may support better understanding of the therapeutic principles of MMP inhibitors.
Our results indicate that cardiac sPLA2 is a unique enzyme predominantly expressed in the heart and secreted to plasma in MMP‐2 deficiency, a condition that can be genetic or pharmacologically induced.12 The chemical identity of this sPLA2 with myocardial secretion that defines a novel heart–liver axis, remains elusive. Our data, however, excluded PLA2G1B, PLA2G2A/2D/2E/2F, PLA2G5, and PLA2G10 as major components of either cardiac or plasma sPLA2 in Mmp2 −/− mice. Our qRT‐PCR, immunological, and chemical inhibitor data gathered to date would suggest that cardiac sPLA2 may not be a classical sPLA2 or may belong to an atypical or even unknown PLA2 class.42, 54, 55 Proteomic studies are ongoing in our laboratories to address this still open question.
In summary, our data identify a novel endocrine function of the heart to modulate lipid metabolic pathways and inflammation in the liver. The key component of this heart–liver axis is secretion of cardiac sPLA2, a unique enzyme the release of which from cardiomyocytes is enhanced by chemokines that are substrates of MMP‐2–mediated proteolysis, such as MCP‐3. We propose that the MMP‐2/cardiac sPLA2 system enables the heart to signal the liver to satisfy the energy needs. Our findings may support understanding of the development of metabolic, inflammatory, and cardiac disturbances associated with MMP‐2 deficiency in patients4, 6, 8, 9 and may provide a rationale for the development of future therapies.
Sources of Funding
This study was supported by operating grants from the Canadian Institutes of Health Research (CIHR) and Natural Sciences and Engineering Research Council of Canada (to Fernandez‐Patron). Cheong is supported by CIHR operating grants and Global Research Network grant (GRN‐2013S1A2A2035348). HPLC analysis of lipids was performed at the Faculty of Medicine and Dentistry Lipid Analysis Core that receives partial funding from the Women and Children Health Research Institute.
Disclosures
None.
Supporting information
Figure S1. Quantitative reverse transcription–polymerase chain reaction analysis of Srebf2 and Hmgcr in various tissues from WT and Mmp2 −/− mice. n=4 per genotype. *P<0.05 vs WT. WT indicates wild type.
Figure S2. A, Quantitative analysis of mRNA levels for genes involved in glucose metabolism (Figure 2A and 2C). n=4 mice per genotype. *P<0.05 vs WT. B, Glucose tolerance test. n=4 mice per genotype. No difference between genotypes. C, Insulin tolerance test. *P<0.05 vs WT. D, Quantitative analysis of metabolites. Pools of 4 per genotype. No difference was observed between genotypes. WT indicates wild type.
Figure S3. Phospholipase A2 activity of individual WT and Mmp2 −/− hearts and pooled plasma samples determined using the in vitro [3H]‐oleic acid–radiolabeled Escherichia coli membrane assay. n=4 WT and n=5 Mmp2 −/−. WT indicates wild type.
Figure S4. Time‐resolved fluorescence immunoassay of mouse sPLA2 isoforms. The analysis with highly specific antibodies against mouse sPLA2 isoforms excludes PLA2G1B, PLA2G2A, PLA2G2D, PLA2G2E, PLA2G2F, PLA2G5 and PLA2G10 as major components of cardiac or plasma sPLA2 in matrix metalloproteinase 2 deficiency. sPLA2 indicates secreted phospholipase A2.
Figure S5. The inhibition of systemic sPLA2 by varespladib lowered cardiac as well as hepatic PGE2 levels. Data are related to our earlier study. The PGE2 levels of pools of 4 mice per genotype were analyzed in duplicate. *P≤0.05 vs wild type (−). † P≤0.05 vs Mmp2 −/− (−). PGE2 indicates prostaglandin E2.
Figure S6. Phenotype induced by HPLC fractions F6 and F7 from WT donors in recipient WT mice. A, Injection of the HPLC fractions F6 and F7 had no impact on plasma or cardiac sPLA2 of WT recipient mice. B, Lack of effect of the HPLC fractions F6 and F7 from WT donors on the hepatic gene expression profile of recipient WT mice. Activity of plasma and cardiac sPLA2 and gene expression profiles in recipient WT mice after 5 consecutive injection‐days of vehicle (control sterile PBS, 10 mmol/L CaCl2) or HPLC‐isolated fractions F6 and F7 from WT donors. *P≤0.05 vs WT plus vehicle. n=4 mice per treatment. HPLC indicates high‐performance liquid chromatography; sPLA2, secreted phospholipase A2; WT, wild type.
Figure S7. Effect of feeding on cardiac sPLA2 activity. Neither overnight fasting alone nor overnight fasting followed by refeeding with a high‐carbohydrate diet for 5 hours altered systemic sPLA2 activity in WT or Mmp2 −/−mice. Pools of 4 per genotype. *P<0.05 vs WT. sPLA2 indicates secreted phospholipase A2; WT, wild type.
Figure S8. Effect of circadian rhythm on cardiac sPLA2 activity. A, Comparison of diurnal and nocturnal sPLA2 activity for WT and Mmp2 −/− hearts. n=4 mice per genotype. *P≤0.05 vs WT (day). B, Quantitative reverse transcription–polymerase chain reaction analysis for a panel of individual mouse sPLA2 isoforms at day (11:30 am±0.5 hour) and night (9:30 pm±0.5 hour). n=3 for WT and n=4 for Mmp2 −/−. *P≤0.05 vs day. sPLA2 indicates secreted phospholipase A2; WT, wild type.
Acknowledgments
Author Contributions: Hernandez‐Anzaldo: Conducted vast majority of experiments, conducted statistical analysis. Berry: Conducted phospholipase A2 (PLA2) and hepatic gene determinations and contributed to data analysis. Brglez, Lambeau: Characterized cardiac and plasma PLA2 inhibition profiles, time‐resolved fluoroimmunoassay measurements and contributed to data analysis. Leung: Measured cardiac secreted PLA2 distribution in ventricles and atria. Yun, Lee, Cheong: Determined and analyzed immune cell infiltration. Kassiri: Provided the MMP‐2 deficient mice and contributed to data analysis. Filep, Cheong, Kassiri, Lambeau and Lehner: Provided critical conceptual input and proof‐read the manuscript. Fernandez‐Patron: Directed the research, provided most of the funding and wrote the manuscript.
(J Am Heart Assoc. 2015;4:e002553 doi: 10.1161/JAHA.115.002553)
Accompanying Figures S1 through S8 are available at http://jaha.ahajournals.org/content/4/11/e002553/suppl/DC1
References
- 1. Berry E, Bosonea AM, Wang X, Fernandez‐Patron C. Insights into the activity, differential expression, mutual regulation, and functions of matrix metalloproteinases and a disintegrin and metalloproteinases in hypertension and cardiac disease. J Vasc Res. 2013;50:52–68. [DOI] [PubMed] [Google Scholar]
- 2. McQuibban GA, Gong JH, Tam EM, McCulloch CA, Clark‐Lewis I, Overall CM. Inflammation dampened by gelatinase a cleavage of monocyte chemoattractant protein‐3. Science. 2000;289:1202–1206. [DOI] [PubMed] [Google Scholar]
- 3. Westermann D, Savvatis K, Lindner D, Zietsch C, Becher PM, Hammer E, Heimesaat MM, Bereswill S, Volker U, Escher F, Riad A, Plendl J, Klingel K, Poller W, Schultheiss HP, Tschope C. Reduced degradation of the chemokine MCP‐3 by matrix metalloproteinase‐2 exacerbates myocardial inflammation in experimental viral cardiomyopathy. Circulation. 2011;124:2082–2093. [DOI] [PubMed] [Google Scholar]
- 4. Tuysuz B, Mosig R, Altun G, Sancak S, Glucksman MJ, Martignetti JA. A novel matrix metalloproteinase 2 (MMP2) terminal hemopexin domain mutation in a family with multicentric osteolysis with nodulosis and arthritis with cardiac defects. Eur J Hum Genet. 2009;17:565–572. [DOI] [PMC free article] [PubMed] [Google Scholar]
- 5. Mosig RA, Dowling O, DiFeo A, Ramirez MC, Parker IC, Abe E, Diouri J, Aqeel AA, Wylie JD, Oblander SA, Madri J, Bianco P, Apte SS, Zaidi M, Doty SB, Majeska RJ, Schaffler MB, Martignetti JA. Loss of MMP‐2 disrupts skeletal and craniofacial development and results in decreased bone mineralization, joint erosion and defects in osteoblast and osteoclast growth. Hum Mol Genet. 2007;16:1113–1123. [DOI] [PMC free article] [PubMed] [Google Scholar]
- 6. Martignetti JA, Aqeel AA, Sewairi WA, Boumah CE, Kambouris M, Mayouf SA, Sheth KV, Eid WA, Dowling O, Harris J, Glucksman MJ, Bahabri S, Meyer BF, Desnick RJ. Mutation of the matrix metalloproteinase 2 gene (MMP2) causes a multicentric osteolysis and arthritis syndrome. Nat Genet. 2001;28:261–265. [DOI] [PubMed] [Google Scholar]
- 7. Castberg FC, Kjaergaard S, Mosig RA, Lobl M, Martignetti C, Martignetti JA, Myrup C, Zak M. Multicentric osteolysis with nodulosis and arthropathy (MONA) with cardiac malformation, mimicking polyarticular juvenile idiopathic arthritis: case report and literature review. Eur J Pediatr. 2013;172:1657–1663. [DOI] [PubMed] [Google Scholar]
- 8. Han DH, Kim SK, Kang S, Choe BK, Kim KS, Chung JH. Matrix metallopeptidase 2 gene polymorphism is associated with obesity in Korean population. Korean J Physiol Pharmacol. 2008;12:125–129. [DOI] [PMC free article] [PubMed] [Google Scholar]
- 9. Morgan AR, Han DY, Thompson JM, Mitchell EA, Ferguson LR. Analysis of MMP2 promoter polymorphisms in childhood obesity. BMC Res Notes. 2011;4:253. [DOI] [PMC free article] [PubMed] [Google Scholar]
- 10. Van Hul M, Bauters D, Himmelreich U, Kindt N, Noppen B, Vanhove M, Lijnen HR. Effect of gelatinase inhibition on adipogenesis and adipose tissue development. Clin Exp Pharmacol Physiol. 2012;39:49–56. [DOI] [PubMed] [Google Scholar]
- 11. Van Hul M, Lijnen HR. A functional role of gelatinase A in the development of nutritionally induced obesity in mice. J Thromb Haemost. 2008;6:1198–1206. [DOI] [PubMed] [Google Scholar]
- 12. Berry E, Hernandez‐Anzaldo S, Ghomashchi F, Lehner R, Murakami M, Gelb MH, Kassiri Z, Wang X, Fernandez‐Patron C. Matrix metalloproteinase‐2 negatively regulates cardiac secreted phospholipase A2 to modulate inflammation and fever. J Am Heart Assoc. 2015;4:e001868 doi: 10.1161/JAHA.115.001868. [DOI] [PMC free article] [PubMed] [Google Scholar]
- 13. Wang X, Berry E, Hernandez‐Anzaldo S, Takawale A, Kassiri Z, Fernandez‐Patron C. Matrix metalloproteinase‐2 mediates a mechanism of metabolic cardioprotection consisting of negative regulation of the sterol regulatory element‐binding protein‐2/3‐hydroxy‐3‐methylglutaryl‐CoA reductase pathway in the heart. Hypertension. 2015;65:882–888. [DOI] [PubMed] [Google Scholar]
- 14. Engelking LJ, Kuriyama H, Hammer RE, Horton JD, Brown MS, Goldstein JL, Liang G. Overexpression of Insig‐1 in the livers of transgenic mice inhibits SREBP processing and reduces insulin‐stimulated lipogenesis. J Clin Invest. 2004;113:1168–1175. [DOI] [PMC free article] [PubMed] [Google Scholar]
- 15. O'Connell TD, Rodrigo MC, Simpson PC. Isolation and culture of adult mouse cardiac myocytes. Methods Mol Biol. 2007;357:271–296. [DOI] [PubMed] [Google Scholar]
- 16. Rouault M, Bollinger JG, Lazdunski M, Gelb MH, Lambeau G. Novel mammalian group XII secreted phospholipase A2 lacking enzymatic activity. Biochemistry. 2003;42:11494–11503. [DOI] [PubMed] [Google Scholar]
- 17. Eerola LI, Surrel F, Nevalainen TJ, Gelb MH, Lambeau G, Laine VJ. Analysis of expression of secreted phospholipases A2 in mouse tissues at protein and mRNA levels. Biochim Biophys Acta. 2006;1761:745–756. [DOI] [PubMed] [Google Scholar]
- 18. Nevalainen TJ, Eerola LI, Rintala E, Laine VJ, Lambeau G, Gelb MH. Time‐resolved fluoroimmunoassays of the complete set of secreted phospholipases A2 in human serum. Biochim Biophys Acta. 2005;1733:210–223. [DOI] [PubMed] [Google Scholar]
- 19. Singer AG, Ghomashchi F, Le Calvez C, Bollinger J, Bezzine S, Rouault M, Sadilek M, Nguyen E, Lazdunski M, Lambeau G, Gelb MH. Interfacial kinetic and binding properties of the complete set of human and mouse groups I, II, V, X, and XII secreted phospholipases A2 . J Biol Chem. 2002;277:48535–48549. [DOI] [PubMed] [Google Scholar]
- 20. Folch J, Lees M, Sloane Stanley GH. A simple method for the isolation and purification of total lipides from animal tissues. J Biol Chem. 1957;226:497–509. [PubMed] [Google Scholar]
- 21. Graeve M, Janssen D. Improved separation and quantification of neutral and polar lipid classes by HPLC‐ELSD using a monolithic silica phase: application to exceptional marine lipids. J Chromatogr B Analyt Technol Biomed Life Sci. 2009;877:1815–1819. [DOI] [PubMed] [Google Scholar]
- 22. Choi JH, Cheong C, Dandamudi DB, Park CG, Rodriguez A, Mehandru S, Velinzon K, Jung IH, Yoo JY, Oh GT, Steinman RM. Flt3 signaling‐dependent dendritic cells protect against atherosclerosis. Immunity. 2011;35:819–831. [DOI] [PubMed] [Google Scholar]
- 23. Kalaany NY, Gauthier KC, Zavacki AM, Mammen PP, Kitazume T, Peterson JA, Horton JD, Garry DJ, Bianco AC, Mangelsdorf DJ. LXRs regulate the balance between fat storage and oxidation. Cell Metab. 2005;1:231–244. [DOI] [PubMed] [Google Scholar]
- 24. Hishikawa D, Shindou H, Kobayashi S, Nakanishi H, Taguchi R, Shimizu T. Discovery of a lysophospholipid acyltransferase family essential for membrane asymmetry and diversity. Proc Natl Acad Sci USA. 2008;105:2830–2835. [DOI] [PMC free article] [PubMed] [Google Scholar]
- 25. Rong X, Albert CJ, Hong C, Duerr MA, Chamberlain BT, Tarling EJ, Ito A, Gao J, Wang B, Edwards PA, Jung ME, Ford DA, Tontonoz P. LXRs regulate ER stress and inflammation through dynamic modulation of membrane phospholipid composition. Cell Metab. 2013;18:685–697. [DOI] [PMC free article] [PubMed] [Google Scholar]
- 26. Horton JD, Cohen JC, Hobbs HH. PCSK9: a convertase that coordinates LDL catabolism. J Lipid Res. 2009;50(suppl):S172–S177. [DOI] [PMC free article] [PubMed] [Google Scholar]
- 27. Kjaer A, Knigge U, Madsen EL, Soe‐Jensen P, Bach FW, Warberg J. Insulin/hypoglycemia‐induced adrenocorticotropin and beta‐endorphin release: involvement of hypothalamic histaminergic neurons. Endocrinology. 1993;132:2213–2220. [DOI] [PubMed] [Google Scholar]
- 28. Peet DJ, Turley SD, Ma W, Janowski BA, Lobaccaro JM, Hammer RE, Mangelsdorf DJ. Cholesterol and bile acid metabolism are impaired in mice lacking the nuclear oxysterol receptor LXR alpha. Cell. 1998;93:693–704. [DOI] [PubMed] [Google Scholar]
- 29. Brown MS, Goldstein JL. Cholesterol feedback: from Schoenheimer's bottle to Scap's MELADL. J Lipid Res. 2009;50(Suppl):S15–S27. [DOI] [PMC free article] [PubMed] [Google Scholar]
- 30. Oslund RC, Cermak N, Gelb MH. Highly specific and broadly potent inhibitors of mammalian secreted phospholipases A2 . J Med Chem. 2008;51:4708–4714. [DOI] [PMC free article] [PubMed] [Google Scholar]
- 31. Beck S, Lambeau G, Scholz‐Pedretti K, Gelb MH, Janssen MJ, Edwards SH, Wilton DC, Pfeilschifter J, Kaszkin M. Potentiation of tumor necrosis factor alpha‐induced secreted phospholipase A2 (sPLA2)‐IIA expression in mesangial cells by an autocrine loop involving sPLA2 and peroxisome proliferator‐activated receptor alpha activation. J Biol Chem. 2003;278:29799–29812. [DOI] [PubMed] [Google Scholar]
- 32. Ekbote AV, Danda S, Zankl A, Mandal K, Maguire T, Ungerer K. Patient with mutation in the matrix metalloproteinase 2 (MMP2) gene—a case report and review of the literature. J Clin Res Pediatr Endocrinol. 2014;6:40–46. [DOI] [PMC free article] [PubMed] [Google Scholar]
- 33. Braunwald E, Harrison DC, Chidsey CA. The heart as an endocrine organ. Am J Med. 1964;36:1–4. [DOI] [PubMed] [Google Scholar]
- 34. Loewi O. The chemical transmission of nerve action. 1936. Available at: http://www.nobelprize.org/nobel_prizes/medicine/laureates/1936/loewi-lecture.html. Accessed June 19, 2015.
- 35. Ogawa T, de Bold AJ. The heart as an endocrine organ. Endocr Connect. 2014;3:R31–R44. [DOI] [PMC free article] [PubMed] [Google Scholar]
- 36. Rashed HM, Nair BG, Patel TB. Regulation of hepatic glycolysis and gluconeogenesis by atrial natriuretic peptide. Arch Biochem Biophys. 1992;298:640–645. [DOI] [PubMed] [Google Scholar]
- 37. Sengenes C, Berlan M, De Glisezinski I, Lafontan M, Galitzky J. Natriuretic peptides: a new lipolytic pathway in human adipocytes. FASEB J. 2000;14:1345–1351. [PubMed] [Google Scholar]
- 38. Bordicchia M, Liu D, Amri EZ, Ailhaud G, Dessi‐Fulgheri P, Zhang C, Takahashi N, Sarzani R, Collins S. Cardiac natriuretic peptides act via p38 MAPK to induce the brown fat thermogenic program in mouse and human adipocytes. J Clin Invest. 2012;122:1022–1036. [DOI] [PMC free article] [PubMed] [Google Scholar]
- 39. Baskin KK, Grueter CE, Kusminski CM, Holland WL, Bookout AL, Satapati S, Kong YM, Burgess SC, Malloy CR, Scherer PE, Newgard CB, Bassel‐Duby R, Olson EN. MED13‐dependent signaling from the heart confers leanness by enhancing metabolism in adipose tissue and liver. EMBO Mol Med. 2014;6:1610–1621. [DOI] [PMC free article] [PubMed] [Google Scholar]
- 40. Grueter CE, van Rooij E, Johnson BA, DeLeon SM, Sutherland LB, Qi X, Gautron L, Elmquist JK, Bassel‐Duby R, Olson EN. A cardiac microRNA governs systemic energy homeostasis by regulation of MED13. Cell. 2012;149:671–683. [DOI] [PMC free article] [PubMed] [Google Scholar]
- 41. Magida JA, Leinwand LA. Metabolic crosstalk between the heart and liver impacts familial hypertrophic cardiomyopathy. EMBO Mol Med. 2014;6:482–495. [DOI] [PMC free article] [PubMed] [Google Scholar]
- 42. Lambeau G, Gelb MH. Biochemistry and physiology of mammalian secreted phospholipases A2 . Annu Rev Biochem. 2008;77:495–520. [DOI] [PubMed] [Google Scholar]
- 43. Murakami M, Sato H, Miki Y, Yamamoto K, Taketomi Y. A new era of secreted phospholipase A2 (sPLA2). J Lipid Res. 2015;56:1248–1261. [DOI] [PMC free article] [PubMed] [Google Scholar]
- 44. Sato H, Taketomi Y, Ushida A, Isogai Y, Kojima T, Hirabayashi T, Miki Y, Yamamoto K, Nishito Y, Kobayashi T, Ikeda K, Taguchi R, Hara S, Ida S, Miyamoto Y, Watanabe M, Baba H, Miyata K, Oike Y, Gelb MH, Murakami M. The adipocyte‐inducible secreted phospholipases PLA2G5 and PLA2G2E play distinct roles in obesity. Cell Metab. 2014;20:119–132. [DOI] [PMC free article] [PubMed] [Google Scholar]
- 45. Ou J, Tu H, Shan B, Luk A, DeBose‐Boyd RA, Bashmakov Y, Goldstein JL, Brown MS. Unsaturated fatty acids inhibit transcription of the sterol regulatory element‐binding protein‐1c (SREBP‐1c) gene by antagonizing ligand‐dependent activation of the LXR. Proc Natl Acad Sci USA. 2001;98:6027–6032. [DOI] [PMC free article] [PubMed] [Google Scholar]
- 46. Jump DB, Tripathy S, Depner CM. Fatty acid‐regulated transcription factors in the liver. Annu Rev Nutr. 2013;33:249–269. [DOI] [PMC free article] [PubMed] [Google Scholar]
- 47. Liu S, Brown JD, Stanya KJ, Homan E, Leidl M, Inouye K, Bhargava P, Gangl MR, Dai L, Hatano B, Hotamisligil GS, Saghatelian A, Plutzky J, Lee CH. A diurnal serum lipid integrates hepatic lipogenesis and peripheral fatty acid use. Nature. 2013;502:550–554. [DOI] [PMC free article] [PubMed] [Google Scholar]
- 48. Semenkovich CF. Fatty acid metabolism and vascular disease. Trends Cardiovasc Med. 2004;14:72–76. [DOI] [PubMed] [Google Scholar]
- 49. Leone TC, Weinheimer CJ, Kelly DP. A critical role for the peroxisome proliferator‐activated receptor alpha (PPARalpha) in the cellular fasting response: the PPARalpha‐null mouse as a model of fatty acid oxidation disorders. Proc Natl Acad Sci USA. 1999;96:7473–7478. [DOI] [PMC free article] [PubMed] [Google Scholar]
- 50. Greenlee KJ, Werb Z, Kheradmand F. Matrix metalloproteinases in lung: multiple, multifarious, and multifaceted. Physiol Rev. 2007;87:69–98. [DOI] [PMC free article] [PubMed] [Google Scholar]
- 51. Corry DB, Rishi K, Kanellis J, Kiss A, Song Lz LZ, Xu J, Feng L, Werb Z, Kheradmand F. Decreased allergic lung inflammatory cell egression and increased susceptibility to asphyxiation in MMP2‐deficiency. Nat Immunol. 2002;3:347–353. [DOI] [PMC free article] [PubMed] [Google Scholar]
- 52. Chung AW, Yang HH, Radomski MW, van Breemen C. Long‐term doxycycline is more effective than atenolol to prevent thoracic aortic aneurysm in Marfan syndrome through the inhibition of matrix metalloproteinase‐2 and ‐9. Circ Res. 2008;102:e73–e85. [DOI] [PubMed] [Google Scholar]
- 53. Gu Y, Lee HM, Sorsa T, Salminen A, Ryan ME, Slepian MJ, Golub LM. Non‐antibacterial tetracyclines modulate mediators of periodontitis and atherosclerotic cardiovascular disease: a mechanistic link between local and systemic inflammation. Pharmacol Res. 2011;64:573–579. [DOI] [PubMed] [Google Scholar]
- 54. Murakami M, Taketomi Y, Miki Y, Sato H, Hirabayashi T, Yamamoto K. Recent progress in phospholipase A(2) research: from cells to animals to humans. Prog Lipid Res. 2011;50:152–192. [DOI] [PubMed] [Google Scholar]
- 55. Dennis EA, Cao J, Hsu YH, Magrioti V, Kokotos G. Phospholipase A2 enzymes: physical structure, biological function, disease implication, chemical inhibition, and therapeutic intervention. Chem Rev. 2011;111:6130–6185. [DOI] [PMC free article] [PubMed] [Google Scholar]
Associated Data
This section collects any data citations, data availability statements, or supplementary materials included in this article.
Supplementary Materials
Figure S1. Quantitative reverse transcription–polymerase chain reaction analysis of Srebf2 and Hmgcr in various tissues from WT and Mmp2 −/− mice. n=4 per genotype. *P<0.05 vs WT. WT indicates wild type.
Figure S2. A, Quantitative analysis of mRNA levels for genes involved in glucose metabolism (Figure 2A and 2C). n=4 mice per genotype. *P<0.05 vs WT. B, Glucose tolerance test. n=4 mice per genotype. No difference between genotypes. C, Insulin tolerance test. *P<0.05 vs WT. D, Quantitative analysis of metabolites. Pools of 4 per genotype. No difference was observed between genotypes. WT indicates wild type.
Figure S3. Phospholipase A2 activity of individual WT and Mmp2 −/− hearts and pooled plasma samples determined using the in vitro [3H]‐oleic acid–radiolabeled Escherichia coli membrane assay. n=4 WT and n=5 Mmp2 −/−. WT indicates wild type.
Figure S4. Time‐resolved fluorescence immunoassay of mouse sPLA2 isoforms. The analysis with highly specific antibodies against mouse sPLA2 isoforms excludes PLA2G1B, PLA2G2A, PLA2G2D, PLA2G2E, PLA2G2F, PLA2G5 and PLA2G10 as major components of cardiac or plasma sPLA2 in matrix metalloproteinase 2 deficiency. sPLA2 indicates secreted phospholipase A2.
Figure S5. The inhibition of systemic sPLA2 by varespladib lowered cardiac as well as hepatic PGE2 levels. Data are related to our earlier study. The PGE2 levels of pools of 4 mice per genotype were analyzed in duplicate. *P≤0.05 vs wild type (−). † P≤0.05 vs Mmp2 −/− (−). PGE2 indicates prostaglandin E2.
Figure S6. Phenotype induced by HPLC fractions F6 and F7 from WT donors in recipient WT mice. A, Injection of the HPLC fractions F6 and F7 had no impact on plasma or cardiac sPLA2 of WT recipient mice. B, Lack of effect of the HPLC fractions F6 and F7 from WT donors on the hepatic gene expression profile of recipient WT mice. Activity of plasma and cardiac sPLA2 and gene expression profiles in recipient WT mice after 5 consecutive injection‐days of vehicle (control sterile PBS, 10 mmol/L CaCl2) or HPLC‐isolated fractions F6 and F7 from WT donors. *P≤0.05 vs WT plus vehicle. n=4 mice per treatment. HPLC indicates high‐performance liquid chromatography; sPLA2, secreted phospholipase A2; WT, wild type.
Figure S7. Effect of feeding on cardiac sPLA2 activity. Neither overnight fasting alone nor overnight fasting followed by refeeding with a high‐carbohydrate diet for 5 hours altered systemic sPLA2 activity in WT or Mmp2 −/−mice. Pools of 4 per genotype. *P<0.05 vs WT. sPLA2 indicates secreted phospholipase A2; WT, wild type.
Figure S8. Effect of circadian rhythm on cardiac sPLA2 activity. A, Comparison of diurnal and nocturnal sPLA2 activity for WT and Mmp2 −/− hearts. n=4 mice per genotype. *P≤0.05 vs WT (day). B, Quantitative reverse transcription–polymerase chain reaction analysis for a panel of individual mouse sPLA2 isoforms at day (11:30 am±0.5 hour) and night (9:30 pm±0.5 hour). n=3 for WT and n=4 for Mmp2 −/−. *P≤0.05 vs day. sPLA2 indicates secreted phospholipase A2; WT, wild type.


