

Abstract
Background
Middle‐aged adults with ideal blood pressure, cholesterol, and glucose levels exhibit substantially lower cardiovascular mortality than those with unfavorable levels. Four healthy lifestyle components—optimal body weight, diet, physical activity, and not smoking—are recommended for cardiovascular health (CVH). This study quantified associations between combinations of healthy lifestyle components measured in young adulthood and loss of the ideal CVH profile into middle age.
Methods and Results
Analyses included 2164 young adults in the Coronary Artery Risk Development in Young Adults study with the ideal CVH profile (defined as untreated blood pressure <120/80 mm Hg, total cholesterol <200 mg/dL, fasting blood glucose <100 mg/dL, and absence of cardiovascular disease) at baseline. Cox proportional hazards regression models estimated hazard ratios for loss of the ideal CVH profile over 25 years according to 4 individual and 16 combinations of optimal healthy lifestyle components measured in young adulthood: body mass index, physical activity, nonsmoking status, and diet quality. Models were adjusted for age, sex, race, education, study center, and baseline blood pressure, cholesterol, and glucose. Eighty percent (n=1737) of participants lost the ideal CVH profile by middle age; loss was greatest for young adults with no optimal healthy lifestyle components at baseline. Relative to young adults with no optimal healthy lifestyle components, those with all 4 were less likely to lose the ideal CVH profile (hazard ratio 0.59, 95% CI 0.44–0.80). Combinations that included optimal body mass index and nonsmoking status were each associated with lower risk.
Conclusions
Optimal body mass index and not smoking in young adulthood were protective against loss of the ideal CVH profile through middle age. Importance of diet and physical activity may be included through their effects on healthy weight.
Keywords: cardiovascular disease, cardiovascular health, health behaviors, young adults
Introduction
Adults who reach middle age with ideal blood pressure, cholesterol, and blood glucose levels (ie, the ideal cardiovascular health [CVH] profile) and without cardiovascular disease (CVD) enjoy exceedingly long life spans in good health1, 2, 3, 4, 5, 6, 7, 8, 9; however, very few US adults retain the ideal CVH profile as they age.10 The American Heart Association (AHA) identified 4 lifestyle components—optimal body mass index (BMI), diet and physical activity patterns, and nonsmoking status—as important components of CVH.11 Studies have confirmed that persons who exhibit greater numbers of these healthy lifestyle components (HLCs) in adolescence12 and young adulthood13, 14, 15 are more likely to reach later adulthood with lower blood pressure, cholesterol, and blood glucose levels and favorable intermediate markers of CVD. Data are lacking on the benefit of the co‐occurrence of specific combinations of HLCs in a subpopulation of young adults with physiological CVH at baseline. The objectives of this study were to quantify associations of (1) optimal classifications of BMI, diet, physical activity, and smoking status individually and (2) combinations of these 4 HLCs, as measured in early young adulthood, with loss of the ideal CVH profile into middle age.
Methods
Study Sample
The Coronary Artery Risk Development in Young Adults (CARDIA) study is a population‐based longitudinal cohort begun in 1985–1986 with 5115 young adults aged 18 to 30 years from 4 sites across the United States (Birmingham AL; Chicago IL; Minneapolis MN; and Oakland CA).16 Participants were selected to include approximately equal distribution by sex, self‐identified race (black and white), education (high school graduate or beyond), and age (18–24 or 25–30 years). Participants were reexamined 2, 5, 7, 10, 15, 20, and 25 years beyond initial recruitment, with retention of 91%, 86%, 81%, 79%, 74%, 72%, and 72%, respectively, of the original participants at those years. For the current analyses, participants who were pregnant (n=7, 0.1% of cohort), who did not meet criteria for the ideal CVH profile at baseline (n=2134, 41.7% of cohort), who were lost to follow‐up (n=109, 2.1% of cohort), and who were missing HLC measurements at baseline (n=701, 13.7% of cohort) were excluded, for a final sample of 2164 participants (42.3% of the original cohort). The original CARDIA study was approved by the institutional review board at each of the 4 sites, and subjects gave consent to participate.
Definition and Assessment of the Ideal CVH Profile
The ideal CVH profile was defined according to AHA metrics11: untreated blood pressure <120/80 mm Hg, untreated total cholesterol <200 mg/dL, untreated fasting blood glucose <100 mg/dL, and absence of diabetes or CVD (heart failure, stroke, or myocardial infarction). Blood pressure was measured at each examination after 5 minutes of rest in the seated position using a random zero sphygmomanometer; the averages of the second and third systolic and fifth phase diastolic recordings were used.17 After a 12‐hour fast, total cholesterol and glucose were measured at each examination using standard methods.17 Participants self‐reported medication use and clinical history of heart failure, stroke, or myocardial infarction; clinical events were validated through medical records, and medications were verified by visual inspection from year 15 onward. We defined the outcome of loss of the ideal CVH profile as no longer meeting ≥1 of these criteria at a given follow‐up examination.
Definition and Assessment of Optimal HLCs and Demographic Covariates
BMI was calculated as the weight in kilograms divided by the square of the height in meters from height and weight measured with participants wearing light clothing and no shoes. Optimal BMI was defined as <25. We included BMI as a lifestyle component even though it reflects both lifestyle and genetic factors; it is considered a “behavioral” factor along with physical activity, diet, and smoking in the AHA definition of ideal CVH. Physical activity was measured with the CARDIA Physical Activity History questionnaire, which assesses 13 categories of varying intensity over the past 12 months calculated into weighted exercise units and has been shown to have excellent validity and reliability.18, 19 Optimal physical activity was defined and examined in 2 ways: (1) as ≥300 exercise units, which corresponds most closely to the AHA goal of ≥150 minutes of moderate to vigorous activity per week,20 and (2) as being in the top quartile of reported exercise units for the overall sample because ≈25% of US adults meet the AHA definition when activity is measured by accelerometer.21 Dietary intake over the previous 28 days was assessed with the CARDIA dietary history interview,22 shown to have reasonable reliability and validity in white participants but less favorable psychometric properties in black participants.23 Data collected were used to calculate the Alternate Healthy Eating Index (AHEI) score, which was developed based on foods and nutrients associated with lower risk of CVD and other chronic diseases in the literature,24 and the AHA Healthy Diet Score.11 Optimal diet was defined and examined in 2 ways: (1) as scoring in the top tertile on the AHEI score due to the known association of the AHEI with reduced all‐cause and cardiovascular mortality25 and (2) by meeting ≥2 components of the AHA Healthy Diet Score. We were unable to use the AHA goal of ≥4 components for optimal diet due to the low number of participants (n=95) meeting this goal. Cigarette smoking status was based on self‐report. Optimal smoking status was defined as never smoking or having quit >12 months earlier.11 Age, sex, race, and highest educational attainment were self‐reported via questionnaire. All HLCs and demographic covariates were assessed in early young adulthood at study baseline.
Statistical Analysis
We assessed the associations between the 4 optimal HLCs and selected demographic characteristics with chi‐square tests and between the 4 HLCs and baseline blood pressure, cholesterol, and glucose levels using simple linear regression. We used the log‐rank test and Kaplan–Meier plots to compare preservation of the ideal CVH profile according to each individual HLC measured in early young adulthood. Cox proportional hazards regression models were used to estimate hazard ratios for loss of the ideal CVH profile over 25 years of follow‐up based on optimal versus nonoptimal individual HLCs and then according to the 16 possible combinations of HLCs. Participants lost to follow‐up (5% of this subsample) were censored at the time of their last study examination. Models were adjusted for baseline assessments of age, sex, race, education, study center, diastolic blood pressure, total cholesterol, and fasting glucose at the baseline examination. Models were created for the entire sample and then for men and women and for black and white participants. Finally, we determined the excess proportion of the ideal CVH profile loss events that occurred in each HLC combination stratum by taking the difference between observed and expected numbers of events over 25 years of follow‐up and dividing it by the observed number of events during the same time period, using all 4 HLCs at study baseline as references.
Sensitivity Analyses
We performed a number of sensitivity analyses. We analyzed results including participants previously excluded due to elevated blood pressure values at the baseline examination who met criteria for the ideal CVH profile based on their blood pressure at year 2 (n=405). These analyses were performed to account for participants with elevated blood pressures at the initial examination due to discomfort with the study examination process. Next, we analyzed results using optimal diet, defined as meeting ≥2 AHA dietary components, and optimal physical activity, defined as being in the top quartile for exercise units for the overall CARDIA sample. We then stratified results by age at enrollment to assess for possible differences between lifestyle in late adolescence (age 18–24 years) and early young adulthood (age 25–30 years). Finally, we created 5 multiple imputation data sets to prevent reducing the generalizability by discarding participants with incomplete data (n=701). Each imputed data set was analyzed separately, and results were combined using Rubin's rules.26
Results
Baseline characteristics of the 2164 participants included in the primary analysis are displayed in Table 1. Women had slightly lower blood pressure and glucose levels than men, and black participants had slightly higher systolic blood pressures and lower glucose levels than white participants (P<0.001 for all comparisons in unadjusted analyses). Overall, 73% of the total sample had optimal BMI, 67% had optimal smoking status, 59% reported optimal physical activity levels, and 35% had an optimal diet score at study enrollment. Optimal BMI was associated with optimal physical activity (P=0.001) and optimal diet patterns (P=0.002) at baseline. White female participants were the most likely and black female participants the least likely to have optimal BMI; black male participants were the most likely and black female participants the least likely to have optimal physical activity levels. The proportion of participants with optimal smoking status and dietary patterns did not differ significantly among the 4 race–sex groups.
Table 1.
Baseline Demographic Characteristics, Clinical Cardiovascular Risk Factors, and Percentage With Each of the 4 HLCs for the 4 Sex–Race Groups in CARDIA, 1985–1986
| Overall (N=2164) | Black Male (n=329) | White Male (n=485) | Black Female (n=610) | White Female (n=740) | P Value | |
|---|---|---|---|---|---|---|
| Age, y | 24.8±3.6 | 23.7±3.8 | 25.0±3.5 | 24.4±3.8 | 25.4±3.4 | <0.001 |
| Education, y | 14.0±2.2 | 13.0±1.9 | 14.6±2.9 | 13.2±1.7 | 14.7±2.2 | <0.001 |
| SBP, mm Hg | 105.9±7.6 | 109.7±6.7 | 108.6±6.9 | 105.1±7.4 | 103.3±7.4 | <0.001 |
| DBP, mm Hg | 65.7±7.7 | 66.9±8.2 | 67.1±7.1 | 64.7±8.5 | 65.1±6.9 | <0.001 |
| TC, mg/dL | 162.7±21.5 | 160.6±23.3 | 160.9±21.4 | 163.7±21.5 | 164.0±20.6 | 0.015 |
| Glu, mg/dL | 80.4±7.4 | 81.2±7.5 | 82.8±7.1 | 78.3±7.5 | 80.3±6.8 | <0.001 |
| HLC, % | ||||||
| Optimal BMI | 73.0 | 72.0 | 77.9 | 60.3 | 80.5 | <0.001 |
| Optimal smoking | 66.6 | 60.5 | 67.6 | 66.9 | 68.4 | 0.077 |
| Optimal PA | 58.9 | 74.2 | 71.8 | 37.9 | 61.0 | <0.001 |
| Optimal diet | 34.6 | 35.0 | 32.4 | 33.4 | 36.8 | 0.427 |
We assessed the associations among age, education, and baseline clinical characteristics and sex–race groups with simple linear regression and among the 4 optimal HLCs and sex–race groups with chi‐square tests. BMI indicates body mass index; CARDIA, Coronary Artery Risk Development in Young Adults; DBP, diastolic blood pressure; Glu, glucose; HLC, healthy lifestyle component; PA, physical activity; SBP, systolic blood pressure; TC, total cholesterol.
Individual HLCs and the Ideal CVH Profile
The majority of participants (n=1737, 80.3%) lost the ideal CVH profile (ie, developed ≥1 unfavorable clinical risk factor or CVD) by the end of the 25‐year follow‐up. Median time to loss of the ideal CVH profile was 10 years (range 1–26 years). The most common reason was loss of ideal blood pressure (54.4% of participants). Young adults with optimal BMI (Figure 1A) and young adults with optimal smoking status (Figure 1B) had a lower probability of losing the ideal CVH profile as they reached middle age compared with young adults who were overweight/obese and young adult smokers. No differences in loss of the ideal CVH profile was observed according to physical activity or diet classification assessed in early young adulthood (Figure 1C and 1D).
Figure 1.
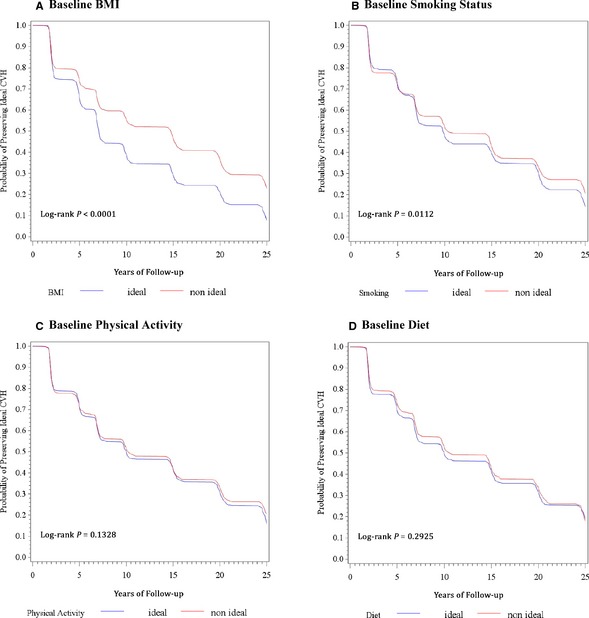
Kaplan–Meier curves of the probability of preserving the ideal CVH factor profile from early young adulthood to middle age (aged 43–55 years) by presence or absence of 4 healthy lifestyle components assessed in early young adulthood (aged 18–30 years). BMI indicates body mass index; CVH, cardiovascular health; HLF, healthy lifestyle factor; PA, physical activity; SMOK, smoking status.
In analyses adjusted for demographic factors, for the other HLCs, and for blood pressure, cholesterol, and glucose levels in early young adulthood, optimal BMI was associated with a 28% lower risk of loss of the ideal CVH profile through middle age (hazard ratio comparing optimal and nonoptimal BMI: 0.72 [95% CI 0.64–0.80], P<0.001). Optimal smoking status in early young adulthood was associated with a 16% lower risk of losing the ideal CVH profile relative to having nonoptimal smoking status (hazard ratio 0.84 [95% CI 0.75–0.94], P=0.001). Optimal physical activity or diet status was not associated with loss of the ideal CVH profile over time.
Combinations of HLCs and Ideal CVH Status
The most commonly occurring combination of HLCs in early young adults was optimal BMI, smoking status, and physical activity (n=375, 17.3%), followed by optimal BMI and smoking status (n=302, 14.0%) and having all 4 HLCs (n=271, 12.5%) (Figure 2). Only 3.2% (n=70) of the cohort had no HLC at baseline, but most of these participants (n=64, 91%) lost the ideal CVH profile by the end of the 25‐year follow‐up. Relative to young adults with no HLCs, those with all 4 HLCs were less likely to lose the ideal CVH profile (hazard ratio 0.59 [95% CI 0.44–0.80], P=0.0006). Any combination with optimal BMI and smoking status was similarly protective compared with having no HLCs (Figure 2).
Figure 2.
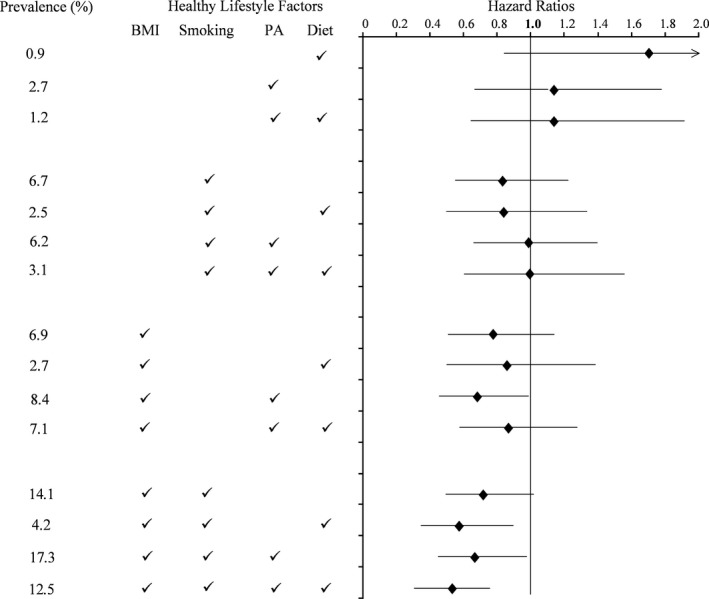
Hazards ratios (95% CI) for loss of the ideal cardiovascular health profile over 25 years of follow‐up according to combinations of optimal healthy lifestyle components present in young adulthood at age 18 to 30 years. Hazard ratios are adjusted for age, sex, race, education, study center, diastolic blood pressure, total cholesterol, and fasting glucose at time of enrollment. Referent group is those without any healthy lifestyle components at baseline. BMI indicates body mass index; PA, physical activity.
When analyses were restricted to the 1579 participants with optimal BMI, participants with optimal smoking status, diet, and physical activity had a lower likelihood of losing the ideal CVH profile compared with those with optimal BMI only (hazard ratio 0.75 [95% CI 0.59–0.96], P=0.048) (Table 2). When analyses were restricted to participants with optimal physical activity only, optimal diet only, or optimal smoking status only, similar benefits were seen, with increasing numbers of the other HLCs compared with these referent groups.
Table 2.
HR (95% CI)a for Loss of the Ideal Cardiovascular Health Profile Through Middle Age According to Combinations of Diet, PA, and Smoking in Participants With and Without Optimal BMI in Young Adulthood
| n | Optimal BMI (n=1579) | HR (95% CI) | n | Nonoptimal BMI (n=585) | HR (95% CI) |
|---|---|---|---|---|---|
| 149 | Ref: no other optimal HLC | 1.0 | 70 | Ref: no optimal HLC | 1.0 |
| 58 | +Optimal diet | 1.15 (0.81 – 1.62) | 20 | +Optimal diet | 1.80 b (1.05 – 3.03) |
| 181 | +Optimal PA | 0.86 (0.67 – 1.11) | 58 | +Optimal PA | 1.12 (0.72 – 1.76) |
| 152 | +Optimal PA, optimal diet | 1.12 (0.86 – 1.45) | 35 | +Optimal PA, optimal diet | 1.12 (0.72 – 1.76) |
| 302 | +Optimal smoking | 0.91 (0.72 – 1.14) | 146 | +Optimal smoking | 0.80 (0.59 – 1.10) |
| 91 | +Optimal smoking, diet | 0.77 (0.57 – 1.05) | 54 | +Optimal smoking, diet | 0.84 (0.57 – 1.25) |
| 374 | +Optimal smoking, PA | 0.89 (0.71 – 1.13) | 135 | +Optimal smoking, PA | 0.92 (0.70 – 1.36) |
| 272 | +Optimal smoking, PA, diet | 0.75 b (0.59 – 0.96) | 67 | +Optimal smoking, PA, diet | 1.04 (0.72 – 1.52) |
+ indicates participants with the HLC; BMI, body mass index; HR, hazard ratios; HLC, healthy lifestyle component; PA, physical activity; Ref, referent.
Adjusted for age, sex, race, education, study center, diastolic blood pressure, total cholesterol, and fasting glucose at time of enrollment.
Parameter estimate from analysis of maximum likelihood estimates significantly differs from that of the referent group at P<0.05.
Finally, we calculated the event rate for loss of the ideal CVH profile per 1000 person‐years of follow‐up for each of the 16 combinations and the excess events attributed to each combination relative to the referent group of having all 4 HLCs in early young adulthood (Figure 3). Participants who did not have optimal BMI, smoking, and physical activity status in early young adulthood had the highest proportion of excess loss of the ideal CVH profile and event rates over time.
Figure 3.
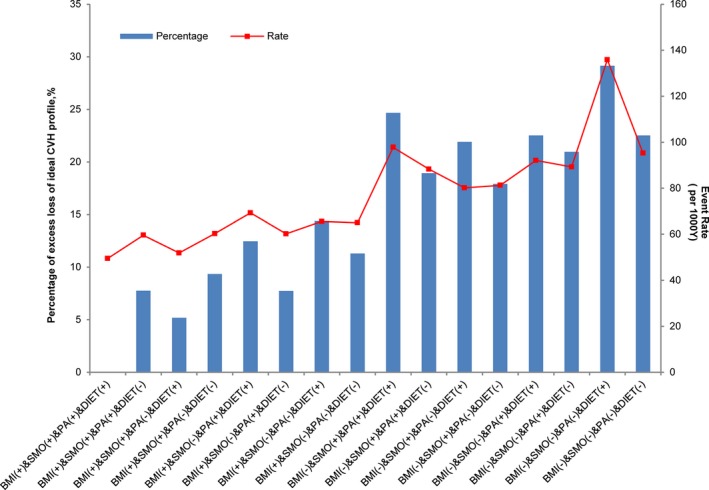
Percentage of excess loss of the ideal cardiovascular health profile and event rate for each combination of HLCs (+ indicates participants with the HLC, − indicates participants without the HLC) compared with having all 4 optimal HLCs at baseline. The referent group is those with all 4 HLCs. BMI indicates body mass index; CVH, cardiovascular health; HLC, healthy lifestyle component; PA, physical activity; SMO, smoking status.
Sex‐ and race‐stratified analysis yielded similar results compared with the pooled analyses (Table 3). Combinations including optimal BMI and optimal smoking status in early young adulthood were associated with reduced risk for loss of the ideal CVH profile in both sexes and both races, although results reached statistical significance only for black participants and for women. Sensitivity analyses including those who met criteria for the ideal CVH profile based on year 2 blood pressures and including those missing data on HLCs at baseline also had results similar to the main analytical sample (data not shown). In each of these analyses, a slightly higher percentage of participants lost the ideal CVH profile over time, but the combination of having all 4 HLCs at baseline was beneficial compared with having no HLC at baseline. Reporting physical activity levels in the top quartile for the population was associated with reduced risk of loss of the ideal CVH profile compared with those in the bottom 3 quartiles (log rank P=0.035). Classification of optimal diet using the AHA guidelines and restriction of optimal physical activity to those reporting only the top quartile of physical activity units did not substantially change results for the analysis of combinations of HLCs. Results were similar for participants aged 18 to 24 versus 25 to 30 years at enrollment.
Table 3.
HRs (95% CI)a for Loss of the Ideal Cardiovascular Health Profile Through Middle Age According to Combinations of BMI, Smoking, PA, and Diet in Black Males, White Males, Black Females, and White Females
| HLC | Black (n=939) | White (n=1225) | Female (n=1350) | Male (n=814) |
|---|---|---|---|---|
| Ref: No HLCs | n HR (95% CI) | |||
| Optimal diet | 15 | 5 | 19 | 1 |
| 1.5 (0.8 – 2.9) | 2.2 (0.8 – 5.8) | 1.6 (0.9 – 2.8) | 18.5 (1.3 – 262.8) | |
| Optimal PA | 22 | 36 | 25 | 33 |
| 1.2 (0.7 – 2.1) | 1.2 (0.7 – 2.1) | 1.1 (0.7 – 1.9) | 1.0 (0.6 – 2.0) | |
| Optimal PA, optimal diet | 23 | 12 | 26 | 9 |
| 0.9 (0.5 – 1.6) | 1.3 (0.6 – 2.7) | 1.2 (0.7 – 2.1) | 0.9 (0.4 – 2.2) | |
| Optimal smoking | 100 | 46 | 119 | 27 |
| 0.7 (0.5 – 1.1) | 1.0 (0.6 – 1.6) | 0.9 (0.6 – 1.3) | 0.7 (0.4 – 1.3) | |
| Optimal smoking, optimal diet | 36 | 18 | 40 | 14 |
| 0.6 (0.4 – 1.0) | 1.4 (0.7 – 2.6) | 0.9 (0.6 – 1.3) | 0.7 (0.3 – 1.6) | |
| Optimal smoking, optimal PA | 63 | 72 | 63 | 72 |
| 0.9 (0.6 – 1.4) | 1.1 (0.7 – 1.7) | 0.9 (0.6 – 1.3) | 1.0 (0.6 – 1.8) | |
| Optimal smoking, optimal PA, Optimal diet | 34 | 33 | 39 | 28 |
| 0.8 (0.5 – 1.3) | 1.4 (0.8 – 2.4) | 1.1 (0.7 – 1.6) | 0.9 (0.5 – 1.8) | |
| Optimal BMI | 60 | 89 | 99 | 50 |
| 0.6 (0.4 – 0.9)b | 0.8 (0.5 – 1.3) | 0.7 (0.5 – 1.0) | 0.9 (0.5 – 1.8) | |
| Optimal BMI, optimal diet | 35 | 23 | 43 | 15 |
| 0.7 (0.4 – 1.2) | 1.2 (0.7 – 2.3) | 0.9 (0.6 – 1.4) | 0.8 (0.4 – 1.7) | |
| Optimal BMI, optimal PA | 70 | 111 | 91 | 90 |
| 0.6 (0.4 – 0.9)b | 0.8 (0.5 – 1.3) | 0.8 (0.5 – 1.1) | 0.5 (0.3 – 0.9)b | |
| Optimal BMI, optimal PA, optimal diet | 66 | 86 | 78 | 74 |
| 0.8 (0.5 – 1.2) | 1.1 (0.7 – 1.7) | 0.8 (0.6 – 1.2) | 0.9 (0.5 – 1.6) | |
| Optimal BMI, optimal smoking | 138 | 164 | 228 | 74 |
| 0.7 (0.5 – 0.9)b | 0.8 (0.5 – 1.3) | 0.7 (0.5 – 0.9)b | 0.7 (0.4 – 1.3) | |
| Optimal BMI, optimal smoking, optimal diet | 39 | 52 | 65 | 26 |
| 0.6 (0.3 – 0.9)b | 0.7 (0.4 – 1.2) | 0.6 (0.4 – 0.9)b | 0.5 (0.2 – 1.0) | |
| Optimal BMI, optimal smoking, optimal PA | 126 | 248 | 194 | 180 |
| 0.6 (0.4 – 0.9)b | 0.8 (0.5 – 1.3) | 0.7 (0.5 – 0.9)b | 0.7 (0.4 – 1.2) | |
| Optimal BMI, optimal smoking, optimal PA, optimal diet | 71 | 201 | 166 | 106 |
| 0.5 (0.3 – 0.8)b | 0.7 (0.5 – 1.1) | 0.6 (0.4 – 0.9)b | 0.5 (0.3 – 0.9)b | |
BMI indicates body mass index; HLC, healthy lifestyle component; HR, hazard ratio; PA, physical activity.
Adjusted for age, education, study center, diastolic blood pressure, total cholesterol, and fasting glucose at time of enrollment.
Parameter estimate from analysis of maximum likelihood estimates significantly differs from that of the referent group at P<0.05.
Discussion
Young adults in the CARDIA cohort who had optimal BMI and who were nonsmokers at the time of study enrollment (aged 18–30 years) were less likely to lose the ideal CVH profile as they aged over 25 years of follow‐up. Optimal BMI and nonsmoking status were beneficial both alone and in combination with other lifestyle components known to promote maintenance of CVH. Relative to having no HLCs in early young adulthood, having all 4 HLCs was associated with a lower risk of developing abnormal blood pressure, cholesterol, glucose levels, or CVD. These findings were similar for all men and women and for black and white participants and were robust with adjustment for demographic factors and baseline levels of the components of ideal CVH.
These findings add to the literature supporting the importance of healthy lifestyles for maintenance of CVH13 and reduction or delay of atherosclerosis,15 CVD events,27, 28, 29 and mortality.30, 31, 32 By assessing each HLC alone and in combination, our findings suggest that young adult BMI and smoking status may convey the strongest benefit for CVH. Nevertheless, because the literature clearly supports the importance of diet and physical activity for preserving healthy weight,33 and because diet and physical activity were correlated with BMI at baseline, it may have been difficult to detect the additional benefit of diet and physical activity when assessed concurrently with BMI. Indeed, BMI is not itself a lifestyle behavior but rather a reflection of both lifestyle and genetic factors, and the other HLCs provided additional protection against the loss of CVH in those with an optimal BMI. This suggests that to maintain CVH, it is best to adhere to all aspects of a healthy lifestyle.
Notably, the majority of young adults with all 4 HLCs at baseline lost the ideal CVH profile by middle age. This finding likely reflects the development of unhealthy lifestyle components over time. Spring et al recently reported that young adults in CARDIA who developed ≥1 unhealthy behavior during study follow‐up had higher odds of developing coronary artery calcium and increased carotid intima media thickness by middle age.15 In contrast, the 25% of young adults who adopted healthy lifestyle changes as they aged had lower risk of developing subclinical atherosclerosis. Consequently, although efforts to achieve a healthy weight and to abstain from smoking in early young adulthood are important for health maintenance, improvement in and acquisition of additional HLCs with age also has beneficial effects.
These results should be interpreted in light of the limitations of our study. First, 28% of the original study participants did not complete the full 25‐year follow‐up; incomplete follow‐up was more common among those with fewer HLCs at baseline. Because these participants were probably more likely to lose the ideal CVH profile over time, this likely caused underrepresentation of the magnitude of the difference between HLC groups. Second, not all combinations were equally prevalent, and the study may have been underpowered to detect differences for some of the less prevalent combinations, especially in the sex‐ and race‐stratified analyses. Third, diet, physical activity, and smoking were self‐reported, and the variability in subjective measures of lifestyle components18, 23 may have contributed to the weak associations between physical activity and diet and the ideal CVH profile. More accurate measurements of these components, such as those captured by accelerometer data or urinary metabolites, may have yielded different results. Furthermore, the diet scores that we used were not fully inclusive of all dietary factors predictive of CVD; however, adherence to these dietary patterns, high in fruits and vegetables and low in red meat, likely have healthy levels of other nutrients important for CVD risk, such as sodium. Fourth, HLCs were assessed at only a single time in early young adulthood, but CVH and related lifestyle factors are dynamic in nature, and many persons changed their lifestyle over time in the CARDIA study, as noted by Spring and colleagues. Finally, the composite of ideal blood pressure, cholesterol, and glucose is itself only a proxy for healthy aging and longevity. Further follow‐up is needed to know which combinations of HLCs measured in early young adulthood predict lower cardiovascular mortality later in life.
Conclusion
Because behavior patterns become increasingly difficult to change as people age, reaching early young adulthood with the constellation of lifestyle components most protective of CVH is essential for healthy longevity. The importance of having healthy BMI and abstaining from tobacco use in early adulthood is foundational for current and future CVD prevention strategies and research linking health behaviors in younger cohorts with later life CVH. We speculate that preserving a healthy weight throughout childhood and adolescence, promoted by adhering to a healthy diet and recommended levels of physical activity, may strongly facilitate the maintenance of CVH into middle age.
Sources of Funding
The Coronary Artery Risk Development in Young Adults Study (CARDIA) is conducted and supported by the National Heart, Lung, and Blood Institute (NHLBI) in collaboration with the University of Alabama at Birmingham (HHSN268201300025C & HHSN268201300026C), Northwestern University (HHSN268201300027C), University of Minnesota (HHSN268201300028C), Kaiser Foundation Research Institute (HHSN268201300029C), and Johns Hopkins University School of Medicine (HHSN268200900041C). CARDIA is also partially supported by the Intramural Research Program of the National Institute on Aging (NIA) and an intra‐agency agreement between NIA and NHLBI (AG0005). This manuscript has been reviewed by CARDIA for scientific content.
Disclosures
None.
(J Am Heart Assoc. 2015;4:e002048 doi: 10.1161/JAHA.115.002048)
References
- 1. Stamler J, Stamler R, Stamler R, Neaton JD, Wentworth D, Daviglus ML, Garside D, Dyer AR, Liu K, Greenland P, Neaton JD, Wentworth D, Daviglus ML, Garside D, Dyer AR, Liu K, Greenland P. Low risk‐factor profile and long‐term cardiovascular and noncardiovascular mortality and life expectancy: findings for 5 large cohorts of young adult and middle‐aged men and women. JAMA. 1999;282:2012–2018. [DOI] [PubMed] [Google Scholar]
- 2. Lloyd‐Jones DM, Leip EP, Larson MG, D'Agostino RB, Beiser A, Wilson PW, Wolf PA, Levy D. Prediction of lifetime risk for cardiovascular disease by risk factor burden at 50 years of age. Circulation. 2006;113:791–798. [DOI] [PubMed] [Google Scholar]
- 3. Berry JD, Dyer A, Cai X, Garside DB, Ning H, Thomas A, Greenland P, Van Horn L, Tracy RP, Lloyd‐Jones DM. Lifetime risks of cardiovascular disease. N Engl J Med. 2012;366:321–329. [DOI] [PMC free article] [PubMed] [Google Scholar]
- 4. Yang Q, Cogswell ME, Flanders WD, Hong Y, Zhang Z, Loustalot F, Gillespie C, Merritt R, Hu FB. Trends in cardiovascular health metrics and associations with all‐cause and CVD mortality among US adults. JAMA. 2012;307:1273–1283. [DOI] [PMC free article] [PubMed] [Google Scholar]
- 5. Daviglus ML, Stamler J, Pirzada A, Yan LL, Garside DB, Liu K, Wang R, Dyer AR, Lloyd‐Jones DM, Greenland P. Favorable cardiovascular risk profile in young women and long‐term risk of cardiovascular and all‐cause mortality. JAMA. 2004;292:1588–1592. [DOI] [PubMed] [Google Scholar]
- 6. Lloyd‐Jones DM, Dyer AR, Wang R, Daviglus ML, Greenland P. Risk factor burden in middle age and lifetime risks for cardiovascular and non‐cardiovascular death (Chicago Heart Association Detection Project in Industry). Am J Cardiol. 2007;99:535–540. [DOI] [PMC free article] [PubMed] [Google Scholar]
- 7. Artero EG, España‐Romero V, Lee DC, Sui X, Church TS, Lavie CJ, Blair SN. Ideal cardiovascular health and mortality: aerobics center longitudinal study. Mayo Clin Proc. 2012;87:944–952. [DOI] [PMC free article] [PubMed] [Google Scholar]
- 8. Dong C, Rundek T, Wright CB, Anwar Z, Elkind MS, Sacco RL. Ideal cardiovascular health predicts lower risks of myocardial infarction, stroke, and vascular death across whites, blacks, and Hispanics: the northern Manhattan study. Circulation. 2012;125:2975–2984. [DOI] [PMC free article] [PubMed] [Google Scholar]
- 9. Ford ES, Greenlund KJ, Hong Y. Ideal cardiovascular health and mortality from all causes and diseases of the circulatory system among adults in the United States. Circulation. 2012;125:987–995. [DOI] [PMC free article] [PubMed] [Google Scholar]
- 10. Mozaffarian D, Benjamin EJ, Go AS, Arnett DK, Blaha MJ, Cushman M, de Ferranti S, Després JP, Fullerton HJ, Howard VJ, Huffman MD, Judd SE, Kissela BM, Lackland DT, Lichtman JH, Lisabeth LD, Liu S, Mackey RH, Matchar DB, McGuire DK, Mohler ER III, Moy CS, Muntner P, Mussolino ME, Nasir K, Neumar RW, Nichol G, Palaniappan L, Pandey DK, Reeves MJ, Rodriguez CJ, Sorlie PD, Stein J, Towfighi A, Turan TN, Virani SS, Willey JZ, Woo D, Yeh RW, Turner MB; American Heart Association Statistics Committee and Stroke Statistics Subcommittee . Heart disease and stroke statistics‐2015 update: a report from the American Heart Association. Circulation. 2015;131:e29–e322. [DOI] [PubMed] [Google Scholar]
- 11. Lloyd‐Jones DM, Hong Y, Labarthe D, Mozaffarian D, Appel LJ, Van Horn L, Greenlund K, Daniels S, Nichol G, Tomaselli GF, Arnett DK, Fonarow GC, Ho PM, Lauer MS, Masoudi FA, Robertson RM, Roger V, Schwamm LH, Sorlie P, Yancy CW, Rosamond WD; American Heart Association Strategic Planning Task Force and Statistics Committee . Defining and setting national goals for cardiovascular health promotion and disease reduction: the American Heart Association's strategic Impact Goal through 2020 and beyond. Circulation. 2010;121:586–613. [DOI] [PubMed] [Google Scholar]
- 12. Laitinen TT, Pahkala K, Magnussen CG, Viikari JS, Oikonen M, Taittonen L, Mikkilä V, Jokinen E, Hutri‐Kähönen N, Laitinen T, Kähönen M, Lehtimäki T, Raitakari OT, Juonala M. Ideal cardiovascular health in childhood and cardiometabolic outcomes in adulthood: the Cardiovascular Risk in Young Finns Study. Circulation. 2012;125:1971–1978. [DOI] [PubMed] [Google Scholar]
- 13. Liu K, Daviglus ML, Loria CM, Colangelo LA, Spring B, Moller AC, Lloyd‐Jones DM. Healthy lifestyle through young adulthood and the presence of low cardiovascular disease risk profile in middle age: the Coronary Artery Risk Development in (Young) Adults (CARDIA) study. Circulation. 2012;125:996–1004. [DOI] [PMC free article] [PubMed] [Google Scholar]
- 14. Gall SL, Jamrozik K, Blizzard L, Dwyer T, Venn A. Healthy lifestyles and cardiovascular risk profiles in young Australian adults: the Childhood Determinants of Adult Health Study. Eur J Cardiovasc Prev Rehabil. 2009;16:684–689. [DOI] [PubMed] [Google Scholar]
- 15. Spring B, Moller AC, Colangelo LA, Siddique J, Roehrig M, Daviglus ML, Polak JF, Reis JP, Sidney S, Liu K. Healthy lifestyle change and subclinical atherosclerosis in young adults: coronary Artery Risk Development in Young Adults (CARDIA) Study. Circulation. 2014;130:10–17. [DOI] [PMC free article] [PubMed] [Google Scholar]
- 16. Friedman GD, Cutter GR, Donahue RP, Hughes GH, Hulley SB, Jacobs DR Jr, Liu K, Savage PJ. CARDIA: study design, recruitment, and some characteristics of the examined subjects. J Clin Epidemiol. 1988;41:1105–1116. [DOI] [PubMed] [Google Scholar]
- 17. Burke GL, Dyer AR, Friedman GD, Hilner JE, Hughes GH, Hulley SB, Jacobs DR Jr, Liu K, Manolio TA. Cardiovascular risk factors in young adults. The CARDIA baseline monograph. Control Clin Trials. 1991;12:1S–77S. [DOI] [PubMed] [Google Scholar]
- 18. Jacobs DR, Hahn LR, Haskell WL, Pirie P, Sidney S. Validity and reliability of short physical activity history: CARDIA and the Minnesota Health Program. J Cardiopulm Rehabil. 1989;9:448–459. [DOI] [PMC free article] [PubMed] [Google Scholar]
- 19. Sidney S, Jacobs DR Jr, Haskell WL, Armstrong MA, Dimicco A, Oberman A, Savage PJ, Slattery ML, Sternfeld B, Van Horn L. Comparison of two methods of assessing physical activity in the Coronary Artery Risk Development in Young Adults (CARDIA) Study. Am J Epidemiol. 1991;133:1231–1245. [DOI] [PubMed] [Google Scholar]
- 20. Gabriel KP, Sidney S, Jacobs DR Jr, Quesenberry CP Jr, Reis JP, Jiang SF, Sternfeld B. Convergent validity of a brief self‐reported physical activity questionnaire. Med Sci Sports Exerc. 2014;46:1570–1577. [DOI] [PMC free article] [PubMed] [Google Scholar]
- 21. Tudor‐Locke C, Leonardi C, Johnson WD, Katzmarzyk PT, Church TS. Accelerometer steps/day translation of moderate‐to‐vigorous activity. Prev Med. 2011;53:31–33. [DOI] [PubMed] [Google Scholar]
- 22. McDonald A, Van Horn L, Slattery M, Hilner J, Bragg C, Caan B, Jacobs D Jr, Liu K, Hubert H, Gernhofer N, Betz E, Havlik D. The CARDIA dietary history: development, implementation, and evaluation. J Am Diet Assoc. 1991;91:1104–1112. [PubMed] [Google Scholar]
- 23. Liu K, Slattery M, Jacobs D Jr, Cutter G, McDonald A, Van Horn L, Hilner JE, Caan B, Bragg C, Dyer A. A study of the reliability and comparative validity of the CARDIA dietary history. Ethn Dis. 1994;4:15–27. [PubMed] [Google Scholar]
- 24. McCullough ML, Feskanich D, Stampfer MJ, Giovannucci EL, Rimm EB, Hu FB, Spiegelman D, Hunter DJ, Colditz GA, Willett WC. Diet quality and major chronic disease risk in men and women: moving toward improved dietary guidance. Am J Clin Nutr. 2002;76:1261–1271. [DOI] [PubMed] [Google Scholar]
- 25. Akbaraly TN, Ferrie JE, Berr C, Brunner EJ, Head J, Marmot MG, Singh‐Manoux A, Ritchie K, Shipley MJ, Kivimaki M. Alternative Healthy Eating Index and mortality over 18 y of follow‐up: results from the Whitehall II cohort. Am J Clin Nutr. 2011;94:247–253. [DOI] [PMC free article] [PubMed] [Google Scholar]
- 26. Rubin DB. Inference and missing data. Biometrika. 1976;63:581–592. [Google Scholar]
- 27. Stampfer MJ, Hu FB, Manson JE, Rimm EB, Willett WC. Primary prevention of coronary heart disease in women through diet and lifestyle. N Engl J Med. 2000;343:16–22. [DOI] [PubMed] [Google Scholar]
- 28. Chiuve SE, Rexrode KM, Spiegelman D, Logroscino G, Manson JE, Rimm EB. Primary prevention of stroke by healthy lifestyle. Circulation. 2008;118:947–954. [DOI] [PMC free article] [PubMed] [Google Scholar]
- 29. Chiuve SE, Fung TT, Rexrode KM, Spiegelman D, Manson JE, Stampfer MJ, Albert CM. Adherence to a low‐risk, healthy lifestyle and risk of sudden cardiac death among women. JAMA. 2011;306:62–69. [DOI] [PMC free article] [PubMed] [Google Scholar]
- 30. van Dam RM, Li T, Spiegelman D, Franco OH, Hu FB. Combined impact of lifestyle factors on mortality: prospective cohort study in US women. BMJ. 2008;337:a1440. [DOI] [PMC free article] [PubMed] [Google Scholar]
- 31. Nechuta SJ, Shu XO, Li HL, Yang G, Xiang YB, Cai H, Chow WH, Ji B, Zhang X, Wen W, Gao YT, Zheng W. Combined impact of lifestyle‐related factors on total and cause‐specific mortality among Chinese women: prospective cohort study. PLoS Med. 2010;7(9):e1000339. [DOI] [PMC free article] [PubMed] [Google Scholar]
- 32. Mitchell JA, Bornstein DB, Sui X, Hooker SP, Church TS, Lee CD, Lee DC, Blair SN. The impact of combined health factors on cardiovascular disease mortality. Am Heart J. 2010;160:102–108. [DOI] [PMC free article] [PubMed] [Google Scholar]
- 33. Ramage S, Farmer A, Apps Eccles K, McCargar L. Healthy strategies for successful weight loss and weight maintenance: a systematic review. Appl Physiol Nutr Metab. 2014;39:1–20. [DOI] [PubMed] [Google Scholar]