

Abstract
Background
Tumor necrosis factor–related apoptosis‐inducing ligand (TRAIL) has the ability to inhibit angiogenesis by inducing endothelial cell death, as well as being able to promote pro‐angiogenic activity in vitro. These seemingly opposite effects make its role in ischemic disease unclear. Using Trail −/− and wildtype mice, we sought to determine the role of TRAIL in angiogenesis and neovascularization following hindlimb ischemia.
Methods and Results
Reduced vascularization assessed by real‐time 3‐dimensional Vevo ultrasound imaging and CD31 staining was evident in Trail −/− mice after ischemia, and associated with reduced capillary formation and increased apoptosis. Notably, adenoviral TRAIL administration significantly improved limb perfusion, capillary density, and vascular smooth‐muscle cell content in both Trail −/− and wildtype mice. Fibroblast growth factor‐2, a potent angiogenic factor, increased TRAIL expression in human microvascular endothelial cell‐1, with fibroblast growth factor‐2‐mediated proliferation, migration, and tubule formation inhibited with TRAIL siRNA. Both fibroblast growth factor‐2 and TRAIL significantly increased NADPH oxidase 4 (NOX4) expression. TRAIL‐inducible angiogenic activity in vitro was inhibited with siRNAs targeting NOX4, and consistent with this, NOX4 mRNA was reduced in 3‐day ischemic hindlimbs of Trail −/− mice. Furthermore, TRAIL‐induced proliferation, migration, and tubule formation was blocked by scavenging H2O2, or by inhibiting nitric oxide synthase activity. Importantly, TRAIL‐inducible endothelial nitric oxide synthase phosphorylation at Ser‐1177 and intracellular human microvascular endothelial cell‐1 cell nitric oxide levels were NOX4 dependent.
Conclusions
This is the first report demonstrating that TRAIL can promote angiogenesis following hindlimb ischemia in vivo. The angiogenic effect of TRAIL on human microvascular endothelial cell‐1 cells is downstream of fibroblast growth factor‐2, involving NOX4 and nitric oxide signaling. These data have significant therapeutic implications, such that TRAIL may improve the angiogenic response to ischemia and increase perfusion recovery in patients with cardiovascular disease and diabetes.
Keywords: angiogenesis, endothelial cell, gene expression, ischemia
Introduction
Angiogenesis is the growth of new blood vessels from a pre‐existing vessel bed by endothelial cells (ECs), an essential physiological process for wound healing and restoration of blood flow after injury. Angiogenesis is regulated by many factors, including vascular endothelial growth factor (VEGF) and fibroblast growth factor‐1 and ‐2 (FGF‐1 and FGF‐2).1 A characteristic of many cardiovascular diseases (CVDs) and diabetes is a deficiency of oxygen and nutrients to tissues because of blocked or narrowed arteries. Both VEGF and FGFs significantly improve the angiogenic response to ischemia.1 In spite of many clinical advances, vascular occlusion and/or impairment of the microcirculation puts patients at constant risk of ischemia, and the consequent detrimental effects on quality‐of‐life and longevity. Thus, new strategies that stimulate angiogenesis‐regulating factors to promote healing and restore blood flow and oxygen to tissues after ischemic injury are needed. These strategies will be built on an understanding of the way in which angiogenesis and neovascularization are regulated in CVD.
Tumor necrosis factor (TNF)–related apoptosis‐inducing ligand (TRAIL) is a member of the TNF family of cytokines that plays important roles in the cell‐mediated immune response, inflammation, and cellular processes up to and including cell death.2, 3, 4, 5 TRAIL was identified almost 20 years ago through its high homology to TNF and Fas ligand, and has the ability to promote apoptosis of cancer and transformed cells, while having little‐to‐no cytotoxic activity on normal cells and tissues.6, 7 In humans, TRAIL signaling occurs upon binding and trimerization of its receptors, DR4 and DR5. TRAIL signaling in mice is similar, except only 1 murine TRAIL receptor has been identified at the protein level, mDR5, which has high sequence homology to DR4 and DR5. TRAIL/TRAIL‐receptors can also signal ERK1/2, mitogen‐activated protein kinase, c‐Jun N‐terminal kinase, and Akt—pathways that promote survival, proliferation, migration, and differentiation of normal cells.2, 4, 5
In CVD, TRAIL appears to be protective, such that circulating TRAIL levels are reduced in patients with coronary artery disease, acute coronary syndromes, myocardial infarction, and also in newly diagnosed type 2 diabetics.8, 9, 10, 11 The protective nature of TRAIL is further supported in rodent models of atherosclerosis,12, 13, 14 pulmonary hypertension,15 and diabetes.12 At physiological levels, TRAIL stimulates proliferation and survival of vascular smooth muscle cells (VSMCs) in vitro and in vivo,16, 17, 18 but the role of TRAIL in angiogenesis and EC function remains unclear. For example, while TRAIL can inhibit angiogenesis by inducing EC death,19, 20 it can also promote angiogenesis in the chick embryo chorioallantoic membrane model21 and EC proliferation, migration, and tubule formation in vitro.22 However, there is no direct evidence for the role of TRAIL in regulating angiogenesis in ischemic vascular diseases, and it is unknown if TRAIL plays a pro‐ or anti‐apoptotic role in this setting. Using an in vivo model of angiogenesis where ischemia‐induced neovascularization of the hindlimb was induced in Trail −/− and wildtype mice, we provide the first evidence to suggest that TRAIL is important for FGF‐2 and ischemia‐induced angiogenesis and EC function. Moreover, we describe a new pathway involving TRAIL‐dependent NADPH oxidase 4 (NOX4) and nitric oxide (NO) signaling in EC function relating to angiogenesis in vitro. The potential clinical implications of these findings will be discussed.
Methods
Mice
Trail −/− mice were originally sourced from AMGEN and provided by Mark Smyth from the Peter MacCallum Cancer Centre (Melbourne, Australia). Trail −/− mice were re‐derived at Australian BioResources (Moss Vale, NSW Australia; with backcrosses equivalent to n10‐16 in these experiments). Wildtype C57Bl6 inbred mice were purchased from Australian Resources Centre (ARC; Perth, Australia) and Australian Biological Resources (Moss Vale, NSW, Australia). Mice were monitored daily and used in specific pathogen‐free conditions with 12:12 hours light–dark cycles with free access to food and water. All experiments were approved by the Animal Care and Ethics Committee at The University of New South Wales (Sydney, Australia) or the Sydney Local Health District Animal Welfare Committee.
Hindlimb Ischemia
As previously described,23 female mice (8–12 weeks; 20–22 g) were anesthetized via inhalation of isoflurane, and the surgical site was shaved and cleaned with saline. The proximal and distal ends of the right femoral artery were ligated, and the artery and all side branches were dissected free along its entire length. The left hindlimb was used as a sham. Neovascularization of the right and left hindlimbs was evaluated by real time in vivo 3‐dimensional imaging using the Vevo Ultrasound (VisualSonics) and contrast agents (Vevo MicroMarker Non‐targeted contrast agent) at 28 days. Briefly, mice received a tail vein injection of contrast agent before being anesthetized and placed on a heating platform. Ultrasound gel was applied as a coupling interface between the mouse and ultrasound probe; blood flow measurements were obtained via pulse imaging. Mice were anesthetized using isoflurane and euthanized by cardiac exsanguination 3, 15, or 28 days after ischemic surgery. Arteriogenesis predominates close to the site of ligation (upper thigh muscle), whereas angiogenesis predominates in the ischemic distal bed (eg, gastrocnemius muscle). As such, the upper thigh and gastrocnemius muscles were isolated at euthanasia.
Immunohistochemistry
To assess tissue architecture, hematoxylin and eosin staining was performed in muscle tissue. Endothelial cell density was confirmed with CD31 immunostaining (1:50; Abcam) in the gastrocnemius muscle. Digital images were captured using an Olympus BX53 microscope. Vascular smooth muscle cell content in the upper thigh was determined with smooth muscle α‐actin (1:2000; Sigma‐Aldrich). Briefly, paraffin‐embedded sections were de‐waxed and subjected to antigen retrieval. Following incubation with the primary antibody, sections were mounted in fluorescent mounting medium and images were captured using a Zeiss Axio Imager Z2 microscope. All IgG controls were negative. At least 5 images (×20 magnification) were taken; CD31 and smooth muscle α‐actin–positive cells were counted/field of view, by an investigator blinded to treatment and genotype.
Adenoviral Delivery
Murine Ad5TRAIL has been previously described24; Ad5LacZ was used as a control. The Gene Transfer Vector Core at the University of Iowa performed the expansion, purification, titration, and quality control of each virus. Ad5TRAIL or Ad5LacZ (109 plaque‐forming units) was injected into 2 sites within the gastrocnemius muscle 2 days prior to ischemic surgery.
Laser Doppler
Hindlimb blood reperfusion was determined by laser Doppler perfusion imaging (moorLDI2‐IR, Moor Instruments). Imaging was performed prior to surgery, then postsurgery at indicated days.
Cell Death Detection ELISA
The Cell Death Detection ELISA (Roche) was used to detect nuclear fragmentation and the release of histones according to the manufacturer's protocol. Prior to use of the kit, intact nuclei from tissue were purified. Muscles were cut into small pieces (1 mm2) and incubated in 0.1 mol/L citric acid solution containing 0.5% Tween‐20 for 20 minutes at room temperature with moderate shaking. Samples were then centrifuged (>523 g; 10 minutes) and 20 μL of the supernatant was used in the ELISA, and normalized to mg tissue used. Cultured human microvascular endothelial cell‐1 (HMEC‐1) were also assayed in accordance with the manufacturers’ instructions; absorbance (405–490 nm) was measured and normalized to total cell counts.
Cell Culture, Plasmids, and Reagents
HMEC‐1 were obtained from the Centre for Disease Control (MTA M1224I) and cultured in MCDB 131 medium (Gibco) supplemented with 10% fetal bovine serum, hydrocortisone (500 μg/mL Sigma‐Aldrich), epidermal growth factor (0.01 μg/mL Gibco), l‐glutamine (2 mmol/L), and 5 U/mL penicillin/streptomycin. Cells were not used beyond passage 40. All cells were maintained at 37°C in a humidified atmosphere of 5% CO2. Unless indicated, 10 ng/mL recombinant human TRAIL (R&D Systems), 50 ng/mL human FGF‐2 (Sigma Aldrich), 1 μmol/L l‐NG‐nitroarginine methyl ester (l‐NAME; Sigma Aldrich), and 200 U/mL PEG‐catalase (Sigma Aldrich) were used in all experiments.
Proliferation Assays
Total cell counts were measured using a Coulter Counter or the Cell Countess (Invitrogen) where 2000 or 3000 cells/well were seeded onto a 96‐well plate. After 72 hours, the cells were serum‐arrested for 24 hours. Cells were then exposed to FGF‐2 or TRAIL for a further 72 hours with or without l‐NAME or PEG‐catalase added 1 hour prior to TRAIL or FGF‐2 treatment. For experiments involving siRNA, growth‐quiescent HMEC‐1 cells were transfected with 200 nmol/L pooled human TRAIL, NOX4 (Santa Cruz Biotechnology), or AllStar control siRNA (Qiagen) for 3 to 6 hours using FuGENE6 (Promega), prior to the addition of TRAIL or FGF2 for 72 hours. Experiments were performed with at least 3 to 4 replicates for each treatment per independent experiment. Unless indicated, each experiment was performed at least 3 times; the data from each independent experiment were averaged and combined.
In Vitro Migration Assays
HMEC‐1 cells were grown until a monolayer of cells was formed. Cells were serum‐arrested at confluence in serum‐free MCDB 131 medium for 24 hours. Growth‐quiescent HMEC‐1 cells were transfected with 200 nmol/L TRAIL, NOX4, or AllStar control siRNA (siC) for 3 to 6 hours using FuGENE6 (Promega), prior to scraping injury as previously described.25 The medium was replaced followed by the addition of TRAIL, FGF‐2, or l‐NAME and PEG‐catalase. Photographs of cells within the denuded area (×4 magnification) were captured 24 hours later using a Nikon Eclipse TE2000‐S microscope. Percentage of cellular regrowth in the denuded zone was determined using Adobe Photoshop Software (Adobe). Unless indicated, each experiment was performed at least 3 times. Data from each independent experiment were averaged and combined.
Tubule Assays
HMEC‐1 cells were grown in 6‐well plates. At 60% confluency, cells were serum‐arrested for 24 hours followed by transfection with 200 nmol/L TRAIL, NOX4, or control siRNA using FuGENE6. The following day, cells were trypsinized and 25 000 to 30 000 cells were seeded onto 100 μL Matrigel (BD Bioscience) in 96‐well flat‐bottom plates in serum‐free medium. At time of seeding, cells were treated with TRAIL, FGF‐2, l‐NAME, and/or PEG‐catalase. Photographs of tubules (×10 magnification) were taken 3 hours after plating using a Nikon Eclipse TE2000‐S microscope. The average length (μm) of at least 30 tubules was quantified26 using NIH Image J software. Unless indicated, each experiment was performed at least 3 times. Data from each independent experiment were averaged and combined.
Western Blotting
HMEC‐1 cells at 60% confluence in 6‐well plates were serum arrested for 24 hours. The cells were treated with TRAIL and/or FGF‐2 for indicated times. The following day, cells were lysed in 1X SDS Sample buffer (62.5 mmol/L Tris‐HCl, pH 6.8, 10% glycerol, 2% SDS, 50 mmol/L dithiothreitol, and 0.1% bromophenol blue). Lysates were boiled (5 minutes, 100°C), centrifuged (5 minutes, 13 523 g) and proteins separated using 7% Tris‐acetate NuPAGE gels (Invitrogen). Proteins were transferred onto nitrocellulose membrane using the iBlot Gel Transfer System (Invitrogen). Membranes were then incubated overnight at 4°C with rabbit polyclonal phospho‐endothelial nitric oxide synthase (eNOS) Ser(1177) (1:1000, Cell Signaling Technology), mouse monoclonal eNOS (1:1000, BD Biosciences), rabbit monoclonal NOX4 (1:1000, Abcam), and mouse monoclonal α‐tubulin (1:5000, Sigma‐Aldrich). Proteins were detected with horseradish peroxidase–conjugated secondary anti‐mouse or anti‐rabbit antibodies (Cell Signaling Technology) and visualized by chemiluminescence (Amersham, GE Healthcare Life Sciences). Densitometry was performed using the lane analysis tools from NIH ImageJ. Each experiment was performed at least 3 times. Densitometry from each independent experiment was averaged and combined.
Intracellular NO Detection by Confocal Microscopy
Intracellular NO levels were assessed as described.27 Briefly, HMEC‐1 cells in 8‐well chamber slides (NUNC Lab‐Tek, Thermo Fisher Scientific) and at 60% confluency were serum‐arrested for 24 hours. The cells were transfected with NOX4 or control siRNA using FuGENE6 for 24 hours. Cells were pre‐incubated with 2.5 μmol/L 4‐amino‐5‐methylamino‐2′,7′‐difluorofluorescein diacetate (DAF‐FM diacetate; Invitrogen) for 30 minutes at 37°C, followed by the addition of TRAIL for 15 minutes at 37°C. HMEC‐1 cells were fixed with 4% paraformaldehyde in PBS and imaged using a Zeiss LSM 510 Meta confocal microscope. Nuclei were stained with Hoechst stain (NucBlue® Live ReadyProbes™ Reagent, Invitrogen). DAF‐FM diacetate fluorescence was analyzed by measuring the black:white ratio using ImageJ software (NIH, Bethesda, MD) and normalized to nuclei count. Unless indicated, each experiment was performed at least 3 times. Data from each independent experiment were averaged and combined.
RNA Extraction, cDNA Synthesis, and Quantitative Polymerase Chain Reaction
Muscle was snap‐frozen in liquid nitrogen at time of euthanasia and stored at −80°C until further use. Tissues were homogenized and RNA extracted using the fibrous tissue RNeasy kit (Qiagen). For studies involving HMEC‐1 cells, at 60% confluence, cells were serum‐arrested for 24 hours followed by TRAIL or FGF‐2 treatment for an additional for 24 hours. Alternatively, serum‐arrested HMEC‐1 cells were transfected with TRAIL, NOX4, or control siRNA using FuGENE6 (Promega) for 3 to 6 hours, followed by the addition of TRAIL or FGF‐2. Total RNA was extracted with TRI reagent as previously described.16 cDNA was generated using iSCRIPT (Bio‐Rad). Real‐time quantitative polymerase chain reaction was performed using the Rotor‐Gene 6000 (Corbett Research) or CFX96 (Biorad) and SensiFAST™ SYBR Kit (Bioline) in quadruplicate. Relative changes in gene expression between groups were determined using the 2−∆∆cT method. Values were normalized to GAPDH or 18S, as indicated. Sequences for human primers are as follows: GAPDH (forward 5′‐ GAAGGCTGGGGCTCATTT‐3 and reverse 5′‐CAGGAGGCATTGCTGATGAT‐3′), TRAIL (forward 5′‐ACCAACGAGCTGAAGCAGAT‐3′ and reverse 5′‐CAAGTGCAAGTTGCTCAGGA‐3′), FGF‐2 (forward 5′‐CAAAGCAGGAGGATCGCTTG‐3′ and reverse 5′‐ GGCTCACTGAACCTTGACC‐3′), and NOX4 (forward 5′‐ TGACGTTGCATCTTTCAGGAG‐3′ and reverse 5′‐AGCTGGTTCGGTTAAGACTGAT‐3′). NOX1 (forward 5′‐TTGTTTGGTTAGGGCTGAATGT‐3′ and reverse 5′‐GCCAATGTTGACCCAAGGATTTT‐3′); NOX2 (forward 5′‐AGGGTCAAGAACAGGCTAAGGA‐3′ and reverse 5′‐TTCTCCACCTCCAACCCTCTTT‐3′). DR4 (forward 5′‐ CCAACAAGACCTAGCTCCCCAGC‐3′ and reverse 5′‐AAGACTACGGCTGCAACTGTGACTCC‐3′) and DR5 (forward 5′‐GTCCTGCTG CAGGTCGTACC‐3′ and reverse 5′‐GATGTCACTCCAGGGCGTAC‐3′). Sequences for murine primers are as follows: TRAIL (forward 5′‐GAAGGCTGGGGCTCATTT‐3′ and reverse 5′‐ CAGGAGGCATTGCTGATGAT‐3′), FGF‐2 (forward 5′‐GTCACGGAAATACTCCAGTTGG‐3′ and reverse 5′‐CCCGTTTTGGATCCGAGTT‐3′), NOX4 (forward 5′‐CCCAAGTTCCAAGCTCATTTCC‐3′ and reverse 5′‐TGGGACAGGTTTGTTGCTCCT‐3′), mDR5 (forward 5′‐GCAGAGAGGGTATTGACTACACC‐3′ and reverse 5′‐GCATCGGGTTTCTACGACTTT‐3′), VEGF‐A (forward 5′‐TTACTGCTGTACCTCCACC‐3′ and reverse 5′‐ACAGGACGGCTTGAAGATG‐3′) and 18S (forward 5′‐ CGGCTACCACATCCAAGGAA‐3′ and reverse 5′‐ GCTGGAATTACCGCGGCT‐3′). Unless indicated, each experiment was performed at least 3 times. Data from each independent experiment were averaged and combined.
Statistics
GraphPad Prism version 5.0 or 6.0 (GraphPad Software, San Diego, CA) was used to analyze data with results expressed as mean±SEM. Statistical comparisons were performed where appropriate, using a Student t test, Mann–Whitney U‐test, or ANOVA (1‐ or 2‐way with Bonferroni's correction); P<0.05 was considered significant.
Results
TRAIL Is Required for Angiogenesis and Arteriogenesis Following Hindlimb Ischemia In Vivo
To investigate the role of TRAIL in ischemia‐induced angiogenesis, we used a mouse model of hindlimb ischemia involving the unilateral ligation and removal of the femoral artery.23 Functionally, Trail −/− mice exhibited impaired recovery of limb movement and demonstrated increased limb necrosis (Figure 1A, top panel). Consistent with this, significant inhibition of vascularization in Trail −/− mice compared to wildtype 28 days after induction of ischemia was observed (Figure 1A, bottom panel), as revealed using contrast agents and 3‐dimensional Vevo ultrasound imaging. In addition, ischemic hindlimb of these mice displayed elevated cellular apoptosis (Figure 1B). CD31 staining of the gastrocnemius muscle from ischemic hindlimb 3 days after surgery revealed an ≈30% reduction in capillary density in Trail −/− mice compared to wildtype (Figure 1C). By day 28, Trail −/− mice displayed a further reduction in capillary density, ≈70% (Figure 1D). The arteriogenic response, or the VSMC‐driven maturation of vessels, was also impaired after ischemia. Similarly, smooth muscle α‐actin staining in muscle demonstrated reduced VSMC content (Figure 1E). Surprisingly, there was significant reduction in limb perfusion in Trail −/− versus wildtype mice, even prior to ischemic surgery (969.1±94.21 versus 661.3±94.68; P<0.05); this coincided with reduced smooth muscle α‐actin staining (3.73±0.58 versus 1.80±0.39; P<0.05), without affecting capillary density (1.06±0.45 versus 0.36±0.18; P=0.15).
Figure 1.
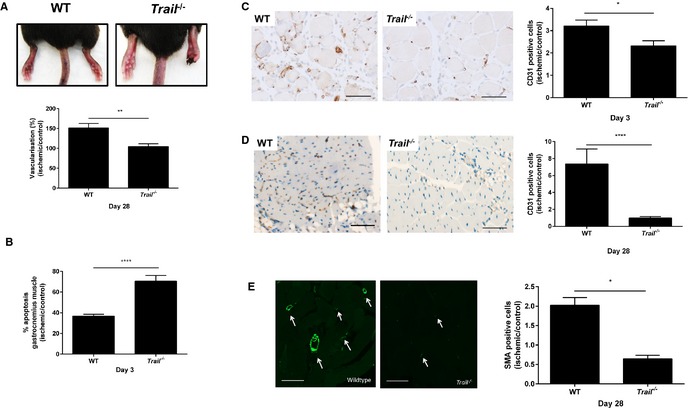
Trail−/− mice have reduced vascularity following hindlimb ischemia. A, WT and Trail −/− mice hindlimb after hindlimb ischemia. Top panel, representative images showing necrotic toes of Trail −/− mice at 14 days. Bottom panel, vascularization of the ischemic and nonischemic hindlimbs were evaluated by real‐time in vivo 3‐dimensional Vevo ultrasound imaging using contrast agents (Vevo MicroMarker) at 28 days (WT, n=5; Trail −/−, n=5). B, Apoptosis was assessed using the Cell Death Detection ELISA from muscle tissue 3 days after hindlimb ischemia was induced; % apoptosis in ischemic muscle over control muscle (WT, n=3; Trail −/−, n=3). CD31 staining in gastrocnemius muscle at (C) 3 days (WT, n=5; Trail −/−, n=4) and (D) 28 days postischemia (WT, n=5; Trail −/−, n=5). E, SMA staining at 28 days postischemia. Left panel shows staining from ischemic leg. Right panel shows quantification (WT, n=5; Trail −/−, n=4). Data were normalized to the nonischemic control leg. Magnification bars=50 μm. Results are mean±SEM; Mann–Whitney U‐test; *P<0.05, **P<0.01, and ****P<0.0001. SMA indicates smooth muscle α‐actin; WT, wildtype.
The importance of TRAIL in preventing the observed pathology was demonstrated when TRAIL expression was restored in Trail −/− mice. TRAIL adenoviral delivery24, 28 increased TRAIL expression in muscle (Figure 2A and 2B), and significantly improved limb perfusion in both genotypes compared to mice that received the LacZ control adenovirus (Figure 2C and 2D). This was not only associated with significantly increased capillary density (Figure 2E), but also VSMC content (Figure 2F). Ischemia and TRAIL delivery also augmented mDR5 expression in wildtype mice (Figure 3A and 3B), with only DR4 mRNA increased with TRAIL treatment in HMEC‐1 cells in vitro (Figure 3C and 3D). In contrast, ischemia and TRAIL‐inducible mDR5 expression was impaired with TRAIL‐deficiency (Figure 3A and 3B). These findings confirm that TRAIL via death receptor signaling not only promotes arteriogenesis, but is also a crucial pro‐angiogenic factor in ischemic vascular disease in vivo.
Figure 2.

Trail−/− mice have reduced vascularity following hindlimb ischemia, which is rescued by TRAIL. A, TRAIL mRNA expression of the gastrocnemius muscle after LacZ or TRAIL adenoviral delivery in Trail −/− (LacZ, n=5; TRAIL, n=5) and (B) WT (LacZ, n=6; TRAIL, n=6) mice. mRNA expression was normalized to 18S. C, LDPI showing improved limb perfusion in Trail −/− mice administered TRAIL adenovirus vs LacZ at 15 days (left panel). Right panel shows quantification (LacZ, n=5; TRAIL, n=5). D, Laser Doppler showing improved limb perfusion in WT mice administered TRAIL adenovirus vs LacZ at 28 days (left panel). Right panel shows quantification (LacZ, n=6; TRAIL, n=6). Capillary density (E) and (F) VSMC content is elevated with TRAIL administration in Trail −/− (LacZ, n=4; TRAIL, n=4) and WT (LacZ, n=4; TRAIL, n=6) mice. Data were normalized to the nonischemic control leg. Results are mean±SEM; Mann–Whitney U‐test; *P<0.05, **P<0.01, and ****P<0.0001. LDPI indicates Laser Doppler Perfusion Index; SMA, smooth muscle α‐actin; TRAIL, tumor necrosis factor–related apoptosis‐inducing ligand; VSMC, vascular smooth muscle cell; WT, wildtype.
Figure 3.
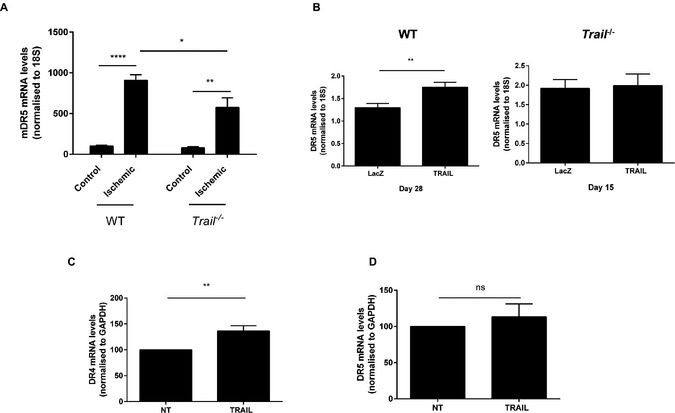
TRAIL‐delivery stimulates TRAIL receptor expression. A, mDR5 expression of the gastrocnemius muscle in WT; (control, n=4; ischemic, n=4) and Trail −/− (control, n=4; ischemic, n=4) 3 days after hindlimb ischemia; control vs ischemic leg. Expression was normalized to 18S. B, mDR5 expression is induced with adenoviral TRAIL in ischemic hindlimb of WT mice (right panel; LacZ, n=6; TRAIL, n=6), which is not apparent in Trail −/− mice (left panel; LacZ, n=4; TRAIL, n=5). Data were normalized to the nonischemic leg. C, DR4 but not (D) DR5 expression is increased with 24 hours TRAIL (10 ng/mL) treatment in HMEC‐1 cells (n=4/treatment). Expression was normalized to GAPDH. Results are mean±SEM; 2‐way ANOVA with Bonferroni comparisons, t test, or Mann–Whitney U‐test *P<0.05, **P<0.01 and ****P<0.0001. HMEC‐1 indicates human microvascular endothelial cell‐1; ns, not significant; NT, no treatment; TRAIL, tumor necrosis factor‐related apoptosis‐inducing ligand; WT, wildtype.
The Pro‐Angiogenic Effects of FGF‐2 in ECs are TRAIL‐Dependent
In our previous studies, TRAIL‐inducible VSMC proliferation and intimal thickening was dependent on FGF‐2, with FGF‐2 directly regulating transcription and expression of TRAIL in these cells.17 TRAIL itself can also augment FGF‐2 expression in VSMCs, suggesting an auto‐regulatory loop.17 Treatment of ECs with FGF‐2 resulted in significantly increased TRAIL mRNA expression (Figure 4A), consistent with our findings in VSMCs.17 Unlike VSMCs,17 exposure of ECs to TRAIL (10 ng/mL) did not influence FGF‐2 expression (Figure 4B). We next assessed the importance of TRAIL in FGF‐2‐induced EC functions. FGF‐2‐induced proliferation, migration, and tubule formation was blocked with TRAIL siRNA (Figure 4C through 4E), with TRAIL siRNA inhibiting TRAIL mRNA by almost 40% under basal conditions (Figure 4F). Consistent with these, FGF‐2 expression from ischemic gastrocnemius muscle of Trail −/− mice was reduced (Figure 5A) and increased following TRAIL adenoviral delivery (Figure 5B and 5C). In contrast, we found VEGF expression to be unaltered between Trail −/− and wildtype ischemic hindlimb (Figure 5D), nor was it induced with TRAIL adenoviral delivery (not shown), suggesting that TRAIL is not required for VEGFs effects in angiogenesis, and our observations are specifically related to FGF‐2 in this setting.
Figure 4.
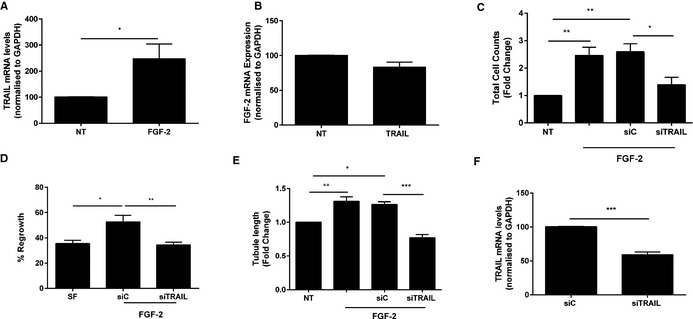
The proangiogenic effects of FGF‐2 are TRAIL dependent. A, FGF‐2 increases TRAIL mRNA expression in ECs. HMEC‐1 cells were serum starved followed by FGF‐2 (50 ng/mL) treatment for 24 hours prior to RNA extraction and real‐time PCR. B, FGF‐2 mRNA expression in ECs was unchanged. HMEC‐1 cells were serum starved followed by TRAIL (10 ng/mL) treatment for 24 hours prior to RNA extraction and real‐time PCR. TRAIL siRNA inhibits (C) FGF‐2‐inducible proliferation and (D) migration of ECs. Serum‐arrested HMEC‐1 cells were transfected with 200 nmol/L TRAIL siRNA or AllStar control siRNA (siC) for 3 to 6 hours prior to FGF‐2 treatment. Total cell counts were assessed 72 hours later and migration assessed 24 hours later. E, TRAIL siRNA blocks tubule formation inducible by FGF‐2. Growth quiescent HMEC‐1 cells were transfected with siC or siTRAIL (200 nmol/L) overnight. Cells were then seeded into growth factor reduced Matrigel in serum‐free media. Cells were treated with FGF‐2. Tubule formation was photographed and tubule length quantified. F, TRAIL siRNA inhibits TRAIL mRNA expression; mRNA was normalized to GAPDH. Data represent the combined results of at least 3 independent experiments. Results are expressed as mean±SEM; t test or 1‐way ANOVA with Bonferroni comparison; *P<0.05, **P<0.01 and ***P<0.001. ECs indicates endothelial cells; FGF‐2, fibroblast growth factor‐2; HMEC‐1, human microvascular endothelial cell‐1; NT, no treatment; PCR, polymerase chain reaction; TRAIL, tumor necrosis factor–related apoptosis‐inducing ligand.
Figure 5.
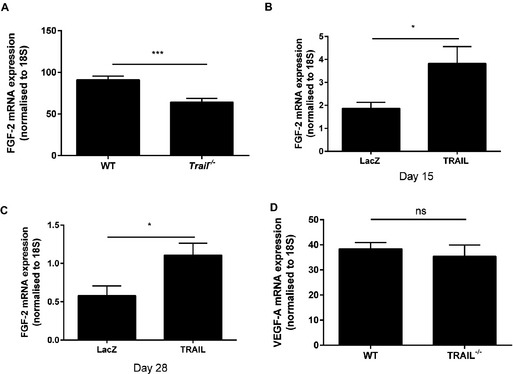
TRAIL controls FGF‐2 expression in vivo. A, Three days ischemic Trail −/− (n=4) hindlimbs express less FGF‐2 mRNA compared to WT (n=4). B, FGF‐2 mRNA expression of the gastrocnemius muscle after LacZ or TRAIL adenoviral delivery in Trail −/− (LacZ, n=5; TRAIL, n=5) and (C) WT mice (LacZ, n=6; TRAIL, n=6) after hindlimb ischemia. D, Three days VEGF‐A expression after hindlimb ischemia (WT, n=4; Trail −/−, n=4). Results are a ratio of ischemic vs control gastrocnemius muscle. FGF‐2 or VEGF‐A was normalized to 18S. Results are expressed as mean±SEM; Mann–Whitney U‐test; *P<0.05 and ***P<0.001. FGF‐2 indicates fibroblast growth factor‐2; ns, not significant; TRAIL, tumor necrosis factor–related apoptosis‐inducing ligand; VEGF, vascular endothelial growth factor; WT, wildtype.
TRAIL‐Inducible EC Proliferation, Migration, and Tubule Formation Involves NOX4
NOX4 is 1 of 7 NADPH oxidase (NOX) enzymes capable of generating reactive oxygen species.29 While elevated reactive oxygen species has the ability to cause oxidative stress, trigger endothelial dysfunction, and initiate CVD,30 recent studies indicate that NOX4 can exert protective actions on cardiovascular function.31, 32 We first wanted to confirm that recombinant TRAIL itself could promote EC functions relating to angiogenesis, and identify the extent of NOX4 involvement. Recombinant human TRAIL treatment significantly increased EC proliferation over a concentration range of 10 to 400 ng/mL (Figure 6A and 6C), without inducing cell death (Figure 6B). TRAIL at 10 ng/mL not only stimulated migration of cells into the denuded zone 24 hours after scratch injury (Figure 6D), but also promoted EC tubule formation (Figure 6E). Importantly, TRAIL‐induced EC proliferation, migration, and tubule formation was attenuated with NOX4 siRNA (Figure 6C through 6E), with NOX4 siRNA inhibiting basal NOX4 mRNA by almost 40% (siC versus siNOX4; 100±1.07 versus 65.35±6.15; P<0.001), and inhibiting TRAIL‐inducible NOX4 protein back to baseline (Figure 6F). Notably, NOX4 expression was significantly reduced in the hindlimb of ischemic Trail −/− mice (Figure 7A). TRAIL also augmented NOX4 mRNA and protein expression in HMEC‐1 after 24 hours (Figure 7B and 7C), with no change in NOX1 (Figure 7D) or NOX2 (Figure 7E) mRNA. Consistent with our finding, FGF‐2 augmented NOX4 expression (Figure 8A), with FGF‐2‐inducible proliferation, migration, and tubule formation inhibited with siNOX4 treatment (Figure 8B through 8D). Together, these data suggest a critical role for TRAIL (and FGF‐2) in NOX4‐mediated EC function.
Figure 6.
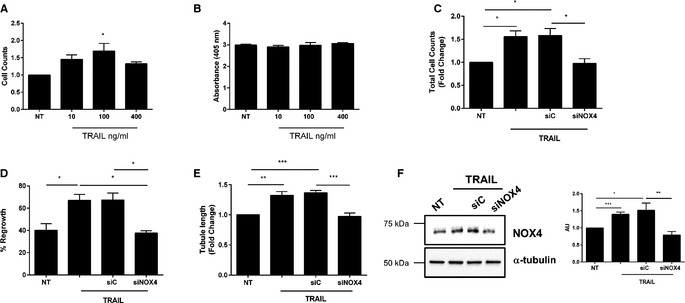
TRAIL‐inducible proliferation, migration, and tubule formation involves NOX4. A, TRAIL stimulates EC proliferation at indicated doses. Proliferation was assessed at 72 hours. B, TRAIL does not affect EC death. HMEC‐1 cells were serum‐starved for 24 hours followed by TRAIL treatment. Apoptosis was assessed at 72 hours using a Cell Death Detection ELISA. C, siNOX4 inhibits TRAIL‐inducible proliferation and (D) migration. Growth‐quiescent HMEC‐1 cells were transfected with 200 nmol/L AllStar control (siC) and siNOX4 siRNA for 3 to 6 hours prior to the addition of TRAIL (10 ng/mL). Cell counts were measured 72 hours later and migration was assessed 24 hours later. E, siNOX4 blocks TRAIL‐inducible tubule formation. Growth quiescent HMEC‐1 cells were transfected with siC or siNOX4 (200 nmol/L) overnight. Cells were then seeded into growth factor reduced Matrigel in serum‐free media, and treated with 10 ng/mL TRAIL. Tubule formation was photographed and quantified 3 hours later. F, siNOX4 inhibits TRAIL‐inducible NOX4 protein expression at 24 hours. Western blotting for NOX4 protein expression following siRNA and 10 ng/mL TRAIL treatment. The intensity of NOX4 expression compared to α‐tubulin was determined by densitometry (AU). Tubule data represent the combined results of 4 independent experiments. All other data represent the combined results of 3 independent experiments. Results are expressed as mean±SEM; t test or 1‐way ANOVA with Bonferroni comparison; *P<0.05, **P<0.01 and ***P<0.001. AU indicates arbitrary units; EC, endothelial cell; HMEC‐1, human microvascular endothelial cell‐1; NOX4, NADPH oxidase 4; NT, no treatment; TRAIL, tumor necrosis factor–related apoptosis‐inducing ligand.
Figure 7.
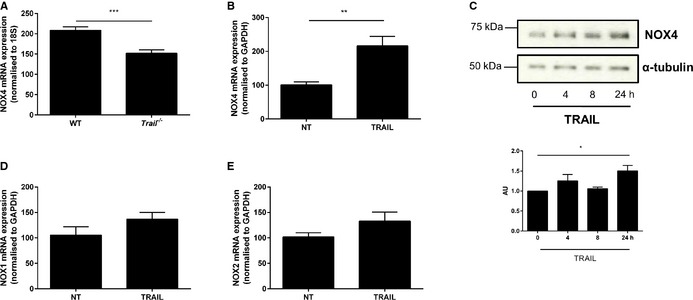
TRAIL increases NOX4 expression. A, Three days ischemic Trail −/− hindlimbs express less NOX4 mRNA compared to WT. Results are expressed as a ratio of ischemic vs control gastrocnemius muscles 3 days after hindlimb ischemia. NOX4 expression was normalized to 18S (WT, n=4; Trail −/−, n=4). B, NOX4 mRNA expression is increased with TRAIL treatment. Serum arrested HMEC‐1 cells were treated with 10 ng/mL TRAIL for 24 hours followed by qPCR. TRAIL expression was normalized to GAPDH. C, Western blotting demonstrating that TRAIL (10 ng/mL) increases NOX4 protein expression over time in HMEC‐1 cells. The loading control is represented by α‐tubulin. The intensity of NOX4 expression compared to α‐tubulin was determined by densitometry (AU). D, NOX1 and (E) NOX2 mRNA expression is unchanged with 10 ng/mL TRAIL treatment. Expression was normalized to GAPDH. Unless stated, the data represent the combined results of at least 3 independent experiments. Results are expressed as mean±SEM; Mann–Whitney U‐test, t test, or 1‐way ANOVA with Bonferroni comparison; *P<0.05, **P<0.01, and ***P<0.001. AU indicates arbitrary units; HMEC‐1, human microvascular endothelial cell‐1; NOX4, NADPH oxidase 4; NT, no treatment; qPCR, quantitative polymerase chain reaction; TRAIL, tumor necrosis factor–related apoptosis‐inducing ligand; WT, wildtype.
Figure 8.
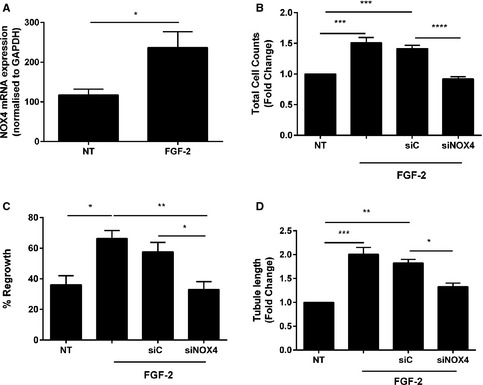
FGF‐2‐inducible proliferation, migration, and tubule formation involves NOX4. A, FGF‐2 increases NOX4 mRNA expression in ECs. HMEC‐1 cells were serum starved followed by 50 ng/mL FGF‐2 for 24 hours prior to RNA extraction and real‐time PCR. siNOX4 blocks FGF‐2‐inducible (B) proliferation and (C) migration. Growth‐quiescent HMEC‐1 cells were transfected with 200 nmol/L AllStar control (siC) and siNOX4 siRNAs for 3 to 6 hours prior to the addition of FGF‐2 (50 ng/mL). Cells counts were measured 72 hours later and migration assessed 24 hours later. D, siNOX4 blocks FGF‐2‐inducible tubule formation. Growth‐quiescent HMEC‐1 cells were transfected with siC or siNOX4 (200 nmol/L) overnight. Cells were then seeded in 100 μL of growth factor reduced Matrigel and treated with 50 ng/mL FGF‐2. Tubule formation was photographed and quantified 3 hours later. Data represent the combined results of at least 3 independent experiments. Results are expressed as mean±SEM; 1‐way ANOVA with Bonferroni comparison; *P<0.05, **P<0.01, ***P<0.001, and ****P<0.0001. ECs indicates endothelial cells; FGF‐2, fibroblast growth factor‐2; HMEC‐1, human microvascular endothelial cell‐1; NOX4, NADPH oxidase 4; NT, no treatment; PCR, polymerase chain reaction.
TRAIL regulates EC angiogenesis in vitro via H2O2 and NO
The protective actions of NOX4 in CVD are, in part, due to its ability to generate H2O2, since H2O2 can also stimulate cellular proliferation in low doses.33 We next used PEG‐catalase, a cell‐permeable scavenger of H2O2, to determine whether the effects we were observing also involved H2O2. While treatment of ECs with PEG‐catalase alone had no effect on ECs (data not shown), PEG‐catalase blocked TRAIL‐inducible EC proliferation and migration (Figure 9A and 9B). TRAIL‐induced tubule formation was also inhibited with PEG‐catalase treatment (Figure 9C). Similar findings were observed with FGF‐2 (Figure 9D through 9F). Thus, TRAIL regulates EC proliferation, migration, and tubule formation, in part, by modulating H2O2.
Figure 9.

TRAIL and FGF‐2‐inducible proliferation, migration, and tubule formation involves H2O2 and NO. A, TRAIL‐inducible proliferation and (B) migration involves H2O2 and NO. Growth quiescent HMEC‐1 cells were treated with PEG‐Catalase (PEG‐Cat; 200 U/mL) and l‐NAME (1 mmol/L) for 1 hour prior to 10 ng/mL TRAIL treatment. Cell counts were assessed 72 hours later and migration assessed 24 hours later. C, TRAIL‐inducible tubule formation involves H2O2 and NO. Serum‐starved HMEC‐1 cells were seeded in growth factor reduced Matrigel. Cells were treated with TRAIL (10 ng/mL) and PEG‐Cat (200 U/mL) or l‐NAME (1 mmol/L). Tubule formation was photographed and quantified 3 hours later. FGF‐2‐inducible (D) proliferation, (E) migration, and (F) tubule formation involves H2O2 and NO. Treatment with FGF‐2 was identical to above except that 50 ng/mL FGF‐2 was used. Data represent the combined results of at least 3 independent experiments. Results are expressed as mean±SEM; 1‐way ANOVA; *P<0.05, **P<0.01 and ***P<0.001. FGF‐2 indicates fibroblast growth factor‐2; HMEC‐1, human microvascular endothelial cell‐1; l‐NAME, l‐NG‐nitroarginine methyl ester; NO, nitric oxide; NT, no treatment; TRAIL, tumor necrosis factor–related apoptosis‐inducing ligand.
Downstream of NOX4 and H2O2 signaling is eNOS phosphorylation and NO production, such that NOX4 itself can stimulate eNOS phosphorylation under certain conditions.32 The NO pathway is essential for EC survival and proliferation27 and interestingly, both FGF‐2 and TRAIL stimulate NO.22, 34 Importantly, l‐NAME, a competitive eNOS inhibitor, significantly reduced TRAIL‐induced proliferation, migration, and tubule formation (Figure 9A through 9C), with l‐NAME alone having no effect on EC function (data not shown). Similar findings were observed in response to FGF‐2 (Figure 9D through 9F). Not only did 10 ng/mL TRAIL increase eNOS phosphorylation at Ser‐1177 as early as 2 minutes (Figure 10A), but TRAIL also stimulated intracellular NO levels over a concentration range of 10 to 400 ng/mL (Figure 10B). To confirm that the NO pathway was playing a role in TRAIL‐mediated effects, TRAIL‐inducible NOX4 mRNA expression was inhibited by l‐NAME (Figure 11A). Furthermore, siRNA targeting NOX4, blocked TRAIL‐induced eNOS Ser‐1177 phosphorylation (Figure 11B) and intracellular NO production (Figure 11C). Together, these results confirm that TRAIL regulates EC functions relating to angiogenesis in vitro by modulating H2O2, eNOS phosphorylation at Ser‐1177, and NO production via NOX4.
Figure 10.
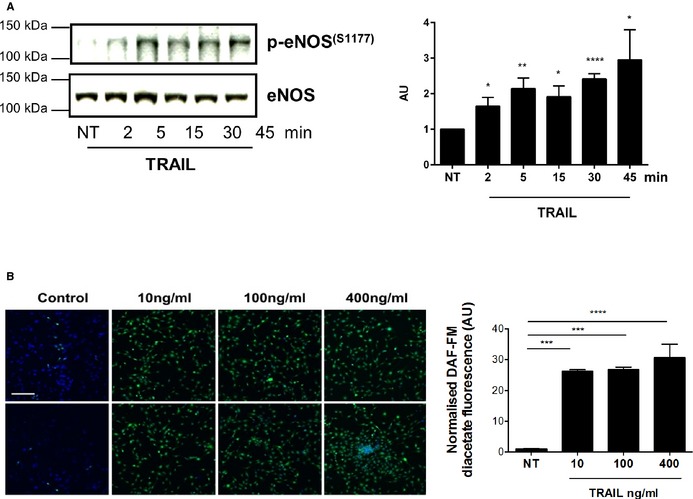
TRAIL's effects on eNOS and intracellular NO. A, 10 ng/mL TRAIL increases eNOS phosphorylation at Ser‐1177 as early as 2 minutes after treatment of serum‐arrested HMEC‐1 cells. Total eNOS levels show loading. The intensity of eNOS phosphorylation at Ser‐1177 compared to total eNOS was determined by densitometry (AU). B, TRAIL at indicated concentrations stimulate intracellular NO. DAF‐FM fluorescence in green measuring intracellular NO levels; top and bottom panel represent duplicates. Nuclei were stained with Hoechst (blue). Magnification bar=100 μm. Right panel, represents the quantification. Control or NT. Western blotting data represent the combined results of at least 3 independent experiments. Intracellular NO data represent the combined results of 2 independent experiments. Results are expressed as mean±SEM; 1‐way ANOVA; *P<0.05, **P<0.01, ***P<0.001, ****P<0.0001. AU indicates arbitrary units; DAF‐FM, 4‐amino‐5‐methylamino‐2′,7′‐difluorofluorescein diacetate; HMEC‐1, human microvascular endothelial cell‐1; NO, nitric oxide; e‐NOS, endothelial nitric oxide synthase; NT, no treatment; TRAIL, tumor necrosis factor–related apoptosis‐inducing ligand.
Figure 11.
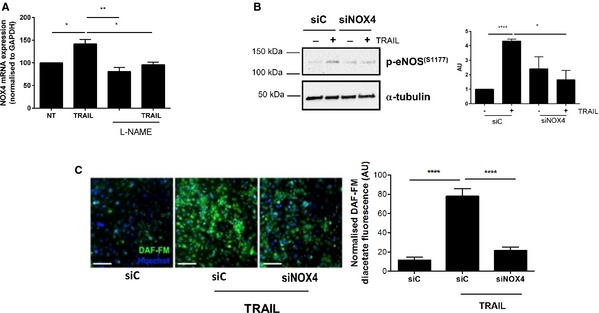
siNOX4 blocks TRAIL‐inducible NO signaling. A, TRAIL‐inducible (10 ng/mL) NOX4 mRNA expression is inhibited with l‐NAME. B, TRAIL‐induced eNOS phosphorylation Ser‐1177 at 15 minutes is blocked with siNOX4 (200 nmol/L). Western blotting for p‐eNOS (S1177) and α‐tubulin showing unbiased loading. The intensity of eNOS phosphorylation at Ser‐1177 compared to α‐tubulin was determined by densitometry (AU) (C) Left panel, TRAIL‐inducible (10 ng/mL) intracellular NO is inhibited by siNOX4 compared to the control siC. DAF‐FM fluorescence in green measuring NO levels; nuclei were stained with Hoechst (blue). Right panel, quantification of intracellular NO by HMEC‐1 cells as described in the Methods section. Magnification bar=100 μm. Data represent the combined results of at least 3 independent experiments. Results are expressed as mean±SEM; 1‐way ANOVA with Bonferroni comparison; *P<0.05, **P<0.01, and ****P<0.0001. AU indicates arbitrary units; DAF‐FM, 4‐amino‐5‐methylamino‐2′,7′‐difluorofluorescein diacetate; e‐NOS, endothelial nitric oxide synthase; HMEC‐1, human microvascular endothelial cell‐1; l‐NAME, l‐NG‐nitroarginine methyl ester; NO, nitric oxide; NOX4, NADPH oxidase 4; NT, no treatment; TRAIL, tumor necrosis factor–related apoptosis‐inducing ligand.
Discussion
Angiogenesis is the growth of capillary networks consisting of EC tubes, driven by hypoxia. Assessment of EC proliferation, migration, and tubule formation is widely used as a model of angiogenesis in vitro. Arteriogenesis, on the other hand, is the maturation and stabilization of the newly formed blood vessels by remodeling of VSMCs. In vitro, arteriogenesis is characterized by differentiation, proliferation, and migration of VSMCs and by remodeling of the extracellular matrix.
The data demonstrate for the first time that TRAIL promotes angiogenesis and arteriogenesis, thereby improving perfusion in ischemic disease in vivo. First, TRAIL deficiency resulted in reduced EC capillary density in the hindlimb ischemia‐induced neovascularization model—an established model of vascular angiogenesis. Importantly, adenoviral‐mediated delivery of TRAIL not only rescued limb perfusion by increasing EC density, but also by augmenting VSMC content following ischemia. Second, we identified TRAIL to be a downstream regulator of the angiogenic function of FGF‐2 in HMEC‐1 cells, such that FGF‐2‐induced EC proliferation, migration, and tubule formation was inhibited with siRNA technology targeting TRAIL. Third, we show that TRAIL‐inducible EC effects relating to angiogenesis in vitro involve NOX4. This is the first report linking TRAIL to NOX4 signaling, and as such, TRAIL‐induced EC proliferation, migration, and tubule formation are dependent on H2O2 and eNOS‐derived NO signals (Figure 12A). Thus, TRAIL plays an adaptive and protective role following ischemia‐induced injury in the vessel wall.
Figure 12.

Schematic for blood vessel formation inducible by TRAIL. A, FGF‐2 and TRAIL‐inducible EC function relating to angiogenesis involves NOX4 and NO signaling. B, TRAIL delivery stimulates blood vessel formation by modulating both EC and VSMC function to promote angiogenesis and arteriogenesis. EC indicates endothelial cell; e‐NOS, endothelial nitric oxide synthase; FGF‐2, fibroblast growth factor‐2; NO, nitric oxide; NOX4, NADPH oxidase 4; TRAIL, tumor necrosis factor–related apoptosis‐inducing ligand; VSMC, vascular smooth muscle cell.
Following ischemia, both angiogenesis and arteriogenesis occur simultaneously, and are important in generating functional collateral networks necessary for effective blood perfusion. While blood perfusion was reduced at baseline in Trail −/− mice, coinciding with reduced VSMC content in the muscle, there was no difference in EC density between genotype; a significant reduction in EC density was only observed following ischemic injury. These data imply that the inherent changes to blood perfusion at baseline with TRAIL deficiency involve impaired arteriogenesis rather than angiogenesis. In contrast to the observed basal effects, here we report TRAIL as a new player in facilitating a pro‐angiogenic response in vivo following ischemic injury. Importantly, Trail −/− mice displayed necrotic toes and markedly impaired angiogenesis after hindlimb ischemia, with TRAIL gene delivery significantly improving blood perfusion via increased capillary and VSMC content.
The effect of TRAIL on VSMC phenotype has been extensively examined. We have shown that TRAIL can promote VSMC proliferation, migration, and differentiation in vitro and in vivo.12, 14, 16, 17, 18 Importantly, FGF‐2 increases TRAIL expression and TRAIL itself can regulate FGF‐2 expression in cultured VSMCs. In support of this, FGF‐2 expression, VSMC proliferation, and intimal thickening were reduced in Trail −/− mice in response to perivascular arterial cuff placement.17 While TRAIL did not alter FGF‐2 expression in HMEC‐1 cells in the current work, FGF‐2 mRNA was significantly reduced in ischemic tissue from Trail −/− mice, and significantly induced following TRAIL adenoviral delivery in ischemic hindlimb of both genotypes. Our findings intriguingly imply that FGF‐2 is both upstream and downstream of TRAIL in VSMCs, but only upstream of TRAIL signaling in ECs. In contrast, no change in VEGF expression was observed after ischemic injury, suggesting that VEGF's role in angiogenesis is unaffected by TRAIL deficiency and may involve different mechanisms. A model for the role of TRAIL in blood vessel formation is described in Figure 12B.
The data presented herein not only support our in vivo findings, but also suggest a new pathway for TRAIL‐mediated effects on EC proliferation, migration, and tubule formation. In contrast to the cytotoxic actions of TRAIL associated with excessive reactive oxygen species production, our data suggest that TRAIL has a protective, nonapoptotic effect in EC biology. NOX enzymes are one of the most important sources of reactive oxygen species in vascular cells, catalyzing the transfer of electrons from NADPH to O2 via their NOX subunit to generate O2 •− ions.30 Multiple isoforms of NOX have been identified (NOX1‐5), with NOX1, 2, and 4 predominantly expressed in ECs.30 Of note, TRAIL, DR4, and DR5 can activate NOX1, increase intracellular O2 •⁻, and induce apoptosis.35 TRAIL can also stimulate membrane raft clustering, co‐localizing with DR4 and triggering NOX gp91phox subunit aggregation36, implicating TRAIL in O2 •⁻ production via NOX2.36 In our hands, TRAIL did not alter the expression of NOX1 or 2, nor did we observe any detectable change in O2 •⁻ production by TRAIL in ECs (not shown). Instead, we show that TRAIL‐dependent EC proliferation, migration, and tubule formation involves NOX4. Our findings are consistent with other studies implicating NOX4, H2O2, and NO signaling in angiogenesis. For example, angiogenic activity was attenuated in NOX4‐deficient mice,31 while NOX4 overexpression promoted perfusion and recovery in response to hindlimb ischemia.32 EC‐specific catalase transgenic mice also exhibit significantly reduced intracellular H2O2, eNOS activation, limb perfusion, and capillary formation, with significantly increased tissue damage in response to hindlimb ischemia.37
The use of TRAIL as potential therapy to increase angiogenesis and neovascularization would be a major advantage in patients with CVD and diabetes. Unlike VEGF and FGFs, which can promote tumor angiogenesis and tumor growth,38, 39 TRAIL kills tumor cells (even at 10 ng/mL40), while leaving normal cells unaffected from its cytotoxic action. Furthermore, its in vivo efficacy, pharmacokinetics, and safety are already known,41 and a number of TRAIL receptor agonists are in clinical trials. Second, VEGF‐induced angiogenesis may need additional factors to help mature and stabilize collateral vessels necessary to improve blood perfusion during ischemia. Indeed, newly formed vessels induced by VEGF can appear primitive, disorganized, and lack stability.42 Delivery of angiogenic and arteriogenic factors simultaneously in animal models has resulted in synergistic angiogenesis with stable vasculature structures, eg, VEGF in combination with FGF‐2, or with platelet‐derived growth factor‐B.43 We have shown that TRAIL lies downstream of FGF‐2 and platelet‐derived growth factor‐B.16 While the mechanisms for TRAIL's actions in normal cells require further elucidation, our findings have significant therapeutic implications, such that TRAIL may improve the angiogenic response to ischemia and increase perfusion recovery in patients with cardiovascular disease and diabetes. Thus, TRAIL monotherapy may represent a simpler approach in promoting new and stable blood vessel networks in ischemic disease.
Sources of Funding
Di Bartolo is supported by a National Health and Medical Research Council of Australia Early Career Fellowship; Gentile is supported by a Heart Research Institute Marcus Blackmore Fellowship. Kavurma is supported by a Heart Foundation of Australia Career Development Award. This work was supported by a Heart Foundation of Australia Grant in Aid.
Disclosures
None.
Acknowledgments
We would like to thank Professor Paul Pilowsky for reading the manuscript and providing comments.
(J Am Heart Assoc. 2015;4:e002527 doi: 10.1161/JAHA.115.002527)
References
- 1. Emanueli C, Madeddu P. Angiogenesis gene therapy to rescue ischaemic tissues: achievements and future directions. B J Pharmacol. 2001;133:951–958. [DOI] [PMC free article] [PubMed] [Google Scholar]
- 2. Azahri NS, Kavurma MM. Transcriptional regulation of tumour necrosis factor‐related apoptosis‐inducing ligand. Cell Mol Life Sci. 2013;70:3617–3629. [DOI] [PMC free article] [PubMed] [Google Scholar]
- 3. Harith HH, Morris MJ, Kavurma MM. On the TRAIL of obesity and diabetes. Trends Endocrinol Metab. 2013;24:578–587. [DOI] [PubMed] [Google Scholar]
- 4. Kavurma MM, Bennett MR. Expression, regulation and function of trail in atherosclerosis. Biochem Pharmacol. 2008;75:1441–1450. [DOI] [PubMed] [Google Scholar]
- 5. Kavurma MM, Tan NY, Bennett MR. Death receptors and their ligands in atherosclerosis. Arterioscler Thromb Vasc Biol. 2008;28:1694–1702. [DOI] [PubMed] [Google Scholar]
- 6. Pitti RM, Marsters SA, Ruppert S, Donahue CJ, Moore A, Ashkenazi A. Induction of apoptosis by Apo‐2 ligand, a new member of the tumor necrosis factor cytokine family. J Biol Chem. 1996;271:12687–12690. [DOI] [PubMed] [Google Scholar]
- 7. Wiley SR, Schooley K, Smolak PJ, Din WS, Huang CP, Nicholl JK, Sutherland GR, Smith TD, Rauch C, Smith CA, Goodwin RG. Identification and characterization of a new member of the TNF family that induces apoptosis. Immunity. 1995;2:673–682. [DOI] [PubMed] [Google Scholar]
- 8. Bisgin A, Yalcin AD, Gorczynski RM. Circulating soluble tumor necrosis factor related apoptosis inducing‐ligand (TRAIL) is decreased in type‐2 newly diagnosed, non‐drug using diabetic patients. Diabetes Res Clin Pract. 2012;96:e84–e86. [DOI] [PubMed] [Google Scholar]
- 9. Michowitz Y, Goldstein E, Roth A, Afek A, Abashidze A, Ben Gal Y, Keren G, George J. The involvement of tumor necrosis factor‐related apoptosis‐inducing ligand (TRAIL) in atherosclerosis. J Am Coll Cardiol. 2005;45:1018–1024. [DOI] [PubMed] [Google Scholar]
- 10. Schoppet M, Sattler AM, Schaefer JR, Hofbauer LC. Osteoprotegerin (OPG) and tumor necrosis factor‐related apoptosis‐inducing ligand (TRAIL) levels in atherosclerosis. Atherosclerosis. 2006;184:446–447. [DOI] [PubMed] [Google Scholar]
- 11. Volpato S, Ferrucci L, Secchiero P, Corallini F, Zuliani G, Fellin R, Guralnik JM, Bandinelli S, Zauli G. Association of tumor necrosis factor‐related apoptosis‐inducing ligand with total and cardiovascular mortality in older adults. Atherosclerosis. 2011;215:452–458. [DOI] [PMC free article] [PubMed] [Google Scholar]
- 12. Di Bartolo BA, Chan J, Bennett MR, Cartland S, Bao S, Tuch BE, Kavurma MM. TNF‐related apoptosis‐inducing ligand (TRAIL) protects against diabetes and atherosclerosis in Apoe (−/−) mice. Diabetologia. 2011;54:3157–3167. [DOI] [PubMed] [Google Scholar]
- 13. Secchiero P, Candido R, Corallini F, Zacchigna S, Toffoli B, Rimondi E, Fabris B, Giacca M, Zauli G. Systemic tumor necrosis factor‐related apoptosis‐inducing ligand delivery shows antiatherosclerotic activity in apolipoprotein E‐null diabetic mice. Circulation. 2006;114:1522–1530. [DOI] [PubMed] [Google Scholar]
- 14. Di Bartolo BA, Cartland SP, Harith HH, Bobryshev YV, Schoppet M, Kavurma MM. TRAIL‐deficiency accelerates vascular calcification in atherosclerosis via modulation of RANKL. PLoS One. 2013;8:e74211. [DOI] [PMC free article] [PubMed] [Google Scholar]
- 15. Hameed AG, Arnold ND, Chamberlain J, Pickworth JA, Paiva C, Dawson S, Cross S, Long L, Zhao L, Morrell NW, Crossman DC, Newman CM, Kiely DG, Francis SE, Lawrie A. Inhibition of tumor necrosis factor‐related apoptosis‐inducing ligand (TRAIL) reverses experimental pulmonary hypertension. J Exp Med. 2012;209:1919–1935. [DOI] [PMC free article] [PubMed] [Google Scholar]
- 16. Azahri NS, Di Bartolo BA, Khachigian LM, Kavurma MM. Sp1, acetylated histone‐3 and p300 regulate TRAIL transcription: mechanisms for PDGF‐BB‐mediated VSMC proliferation and migration. J Cell Biol. 2012;13:2597–2606. [DOI] [PubMed] [Google Scholar]
- 17. Chan J, Prado‐Lourenco L, Khachigian LM, Bennett MR, Di Bartolo BA, Kavurma MM. TRAIL promotes VSMC proliferation and neointima formation in a FGF‐2‐, Sp1 phosphorylation‐, and NFkappaB‐dependent manner. Circ Res. 2010;106:1061–1071. [DOI] [PubMed] [Google Scholar]
- 18. Kavurma MM, Schoppet M, Bobryshev YV, Khachigian LM, Bennett MR. Trail stimulates proliferation of vascular smooth muscle cells via activation of NF‐kappa B and induction of insulin‐like growth factor‐1 receptor. J Biol Chem. 2008;283:7754–7762. [DOI] [PubMed] [Google Scholar]
- 19. Cantarella G, Risuglia N, Dell'eva R, Lempereur L, Albini A, Pennisi G, Scoto GM, Noonan DN, Bernardini R. TRAIL inhibits angiogenesis stimulated by VEGF expression in human glioblastoma cells. Br J Cancer. 2006;94:1428–1435. [DOI] [PMC free article] [PubMed] [Google Scholar]
- 20. Chen PL, Easton AS. Evidence that tumor necrosis factor‐related apoptosis inducing ligand (TRAIL) inhibits angiogenesis by inducing vascular endothelial cell apoptosis. Biochem Biophys Res Commun. 2010;391:936–941. [DOI] [PubMed] [Google Scholar]
- 21. Cantarella G, Di Benedetto G, Ribatti D, Saccani‐Jotti G, Bernardini R. Involvement of caspase 8 and c‐FLIPL in the proangiogenic effects of the tumour necrosis factor‐related apoptosis‐inducing ligand (TRAIL). FEBS J. 2014;281:1505–1513. [DOI] [PubMed] [Google Scholar]
- 22. Secchiero P, Gonelli A, Carnevale E, Corallini F, Rizzardi C, Zacchigna S, Melato M, Zauli G. Evidence for a proangiogenic activity of TNF‐related apoptosis‐inducing ligand. Neoplasia. 2004;6:364–373. [DOI] [PMC free article] [PubMed] [Google Scholar]
- 23. Couffinhal T, Silver M, Zheng LP, Kearney M, Witzenbichler B, Isner JM. Mouse model of angiogenesis. Am J Pathol. 1998;152:1667–1679. [PMC free article] [PubMed] [Google Scholar]
- 24. Griffith TS, Anderson RD, Davidson BL, Williams RD, Ratliff TL. Adenoviral‐mediated transfer of the TNF‐related apoptosis‐inducing ligand/Apo‐2 ligand gene induces tumor cell apoptosis. J Immunol. 2000;165:2886–2894. [DOI] [PubMed] [Google Scholar]
- 25. Kavurma MM, Khachigian LM. ERK, JNK and p38 MAP kinase regulate proliferation and migration of phenotypically‐distinct SMC subtypes. J Cell Biochem. 2003;89:289–300. [DOI] [PubMed] [Google Scholar]
- 26. Donovan D, Brown NJ, Bishop ET, Lewis CE. Comparison of three in vitro human ‘angiogenesis’ assays with capillaries formed in vivo. Angiogenesis. 2001;4:113–121. [DOI] [PubMed] [Google Scholar]
- 27. Gentile C, Muise‐Helmericks RC, Drake CJ. VEGF‐mediated phosphorylation of eNOS regulates angioblast and embryonic endothelial cell proliferation. Dev Biol. 2013;373:163–175. [DOI] [PMC free article] [PubMed] [Google Scholar]
- 28. Kemp TJ, Kim JS, Crist SA, Griffith TS. Induction of necrotic tumor cell death by TRAIL/Apo‐2L. Apoptosis. 2003;8:587–599. [DOI] [PubMed] [Google Scholar]
- 29. Jiang F, Zhang Y, Dusting GJ. NADPH oxidase‐mediated redox signaling: roles in cellular stress response, stress tolerance, and tissue repair. Pharmacol Rev. 2011;63:218–242. [DOI] [PubMed] [Google Scholar]
- 30. Thomas SR, Witting PK, Drummond GR. Redox control of endothelial function and dysfunction: molecular mechanisms and therapeutic opportunities. Antioxid Redox Signal. 2008;10:1713–1765. [DOI] [PubMed] [Google Scholar]
- 31. Schroder K, Zhang M, Benkhoff S, Mieth A, Pliquett R, Kosowski J, Kruse C, Luedike P, Michaelis UR, Weissmann N, Dimmeler S, Shah AM, Brandes RP. Nox4 is a protective reactive oxygen species generating vascular NADPH oxidase. Circ Res. 2012;110:1217–1225. [DOI] [PubMed] [Google Scholar]
- 32. Craige SM, Chen K, Pei Y, Li C, Huang X, Chen C, Shibata R, Sato K, Walsh K, Keaney JF Jr. NADPH oxidase 4 promotes endothelial angiogenesis through endothelial nitric oxide synthase activation. Circulation. 2011;124:731–740. [DOI] [PMC free article] [PubMed] [Google Scholar]
- 33. Cai H. Hydrogen peroxide regulation of endothelial function: origins, mechanisms, and consequences. Cardiovasc Res. 2005;68:26–36. [DOI] [PubMed] [Google Scholar]
- 34. Murphy PR, Limoges M, Dodd F, Boudreau RT, Too CK. Fibroblast growth factor‐2 stimulates endothelial nitric oxide synthase expression and inhibits apoptosis by a nitric oxide‐dependent pathway in Nb2 lymphoma cells. Endocrinology. 2001;142:81–88. [DOI] [PubMed] [Google Scholar]
- 35. Park KJ, Lee CH, Kim A, Jeong KJ, Kim CH, Kim YS. Death receptors 4 and 5 activate Nox1 NADPH oxidase through riboflavin kinase to induce reactive oxygen species‐mediated apoptotic cell death. J Biol Chem. 2012;287:3313–3325. [DOI] [PMC free article] [PubMed] [Google Scholar]
- 36. Li X, Han WQ, Boini KM, Xia M, Zhang Y, Li PL. TRAIL death receptor 4 signaling via lysosome fusion and membrane raft clustering in coronary arterial endothelial cells: evidence from ASM knockout mice. J Mol Med. 2013;91:25–36. [DOI] [PMC free article] [PubMed] [Google Scholar]
- 37. Urao N, Sudhahar V, Kim SJ, Chen GF, McKinney RD, Kojda G, Fukai T, Ushio‐Fukai M. Critical role of endothelial hydrogen peroxide in post‐ischemic neovascularization. PLoS One. 2013;8:e57618. [DOI] [PMC free article] [PubMed] [Google Scholar]
- 38. Hicklin DJ, Ellis LM. Role of the vascular endothelial growth factor pathway in tumor growth and angiogenesis. J Clin Oncol. 2005;23:1011–1027. [DOI] [PubMed] [Google Scholar]
- 39. Giavazzi R, Sennino B, Coltrini D, Garofalo A, Dossi R, Ronca R, Tosatti MP, Presta M. Distinct role of fibroblast growth factor‐2 and vascular endothelial growth factor on tumor growth and angiogenesis. Am J Pathol. 2003;162:1913–1926. [DOI] [PMC free article] [PubMed] [Google Scholar]
- 40. Lee SC, Cheong HJ, Kim SJ, Yoon J, Kim HJ, Kim KH, Kim SH, Kim HJ, Bae SB, Kim CK, Lee N, Lee KT, Park SK, Hong DS, Park HS, Won JH. Low‐dose combinations of LBH589 and TRAIL can overcome TRAIL‐resistance in colon cancer cell lines. Anticancer Res. 2011;31:3385–3394. [PubMed] [Google Scholar]
- 41. Kelley SK, Harris LA, Xie D, Deforge L, Totpal K, Bussiere J, Fox JA. Preclinical studies to predict the disposition of Apo2L/tumor necrosis factor‐related apoptosis‐inducing ligand in humans: characterization of in vivo efficacy, pharmacokinetics, and safety. J Pharmacol Exp Ther. 2001;299:31–38. [PubMed] [Google Scholar]
- 42. Cao R, Xue Y, Hedlund EM, Zhong Z, Tritsaris K, Tondelli B, Lucchini F, Zhu Z, Dissing S, Cao Y. VEGFR1‐mediated pericyte ablation links VEGF and PlGF to cancer‐associated retinopathy. Proc Natl Acad Sci USA. 2010;107:856–861. [DOI] [PMC free article] [PubMed] [Google Scholar]
- 43. Kano MR, Morishita Y, Iwata C, Iwasaka S, Watabe T, Ouchi Y, Miyazono K, Miyazawa K. VEGF‐A and FGF‐2 synergistically promote neoangiogenesis through enhancement of endogenous PDGF‐B‐PDGFRbeta signaling. J Cell Sci. 2005;118:3759–3768. [DOI] [PubMed] [Google Scholar]