Abstract
We aim to build models for peripheral arterial disease (PAD) risk prediction and seek to validate these models in 2 different surveys in the US general population.
Model building survey was based on the National Health and Nutrition Examination Surveys (NHANES, 1999–2002). Potential predicting variables included race, gender, age, smoking status, total cholesterol (TC), body mass index, high-density lipoprotein (HDL), ratio of TC to HDL, diabetes status, HbA1c, hypertension status, and pulse pressure. The PAD was diagnosed as ankle brachial index <0.9. We used multiple logistic regression method for the prediction model construction. The final predictive variables were chosen based on the likelihood ratio test. Model internal validation was done by the bootstrap method. The NHANES 2003–2004 survey was used for model external validation.
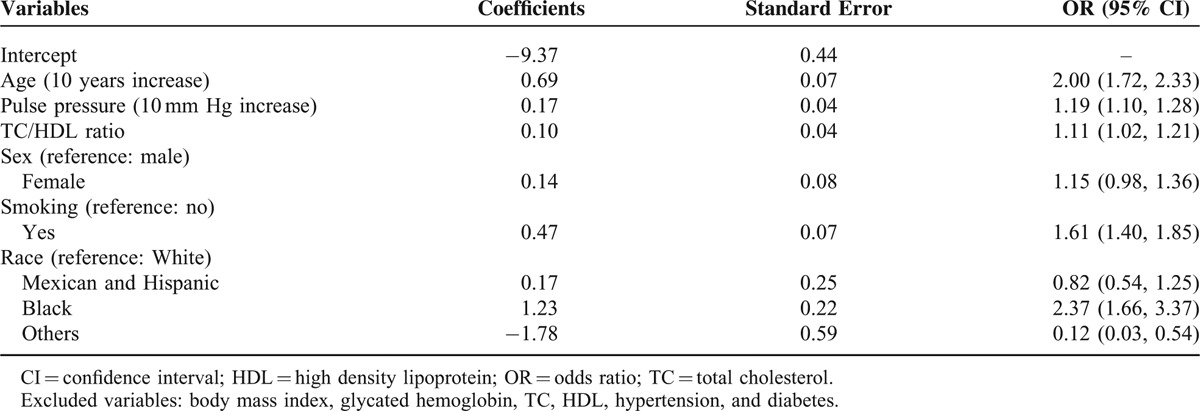
Age, race, sex, pulse pressure, the ratio of TC to HDL, and smoking status were selected in the final prediction model. The odds ratio (OR) and 95% confidence interval (CI) for age with 10 years increase was 2.00 (1.72, 2.33), whereas that of pulse pressure for 10 mm Hg increase was 1.19 (1.10, 1.28). The OR of PAD was 1.11 (95% CI: 1.02, 1.21) for 1 unit increase in the TC to HDL ratio and was 1.61 (95% CI: 1.40, 1.85) for people who were currently smoking compared with those who were not. The respective area under receiver operating characteristics (AUC) of the final model from the training survey and validation survey were 0.82 (0.82, 0.83) and 0.76 (0.72, 0.79) indicating good model calibrations.
Our model, to some extent, has a moderate usefulness for PAD risk prediction in the general US population.
INTRODUCTION
Peripheral arterial disease (PAD), an obstructive atherosclerotic disease in the lower extremities, was repeatedly found to be associated with cardiovascular diseases,1 stroke,2 mortality,3 or decreased quality of life4 in different populations. The prevalence of PAD has been of increasing concern around the world for the last decades. It was reported that a substantial proportion of people in the general population had PAD.5–7 According to a recent study, however, only around one-tenth of patients with PAD had clinical intermittent claudication symptoms and as high as 75% of these patients could be without symptomatic PAD.8 The National Institute for Health and Clinical Excellence (NICE) recommended that PAD patients should be provided with a detailed clinical examination that included assessing the most modifiable risk factors, such as smoking status, glycemic status, abnormal lipid, obesity, and physical activity.9 In practice, however, epidemiological studies about PAD are much fewer compared with those of other type of cardiovascular diseases. Thus, there is an urgent need for PAD surveillance, to investigate the etiology, and to develop possible preventive and treatment strategies.
To assess the prevalence of PAD, thorough examinations using ankle brachial index (ABI) or combing clinical symptoms are the typical methods for most of the present clinical research and epidemiological studies. However, because these methods are sometimes expensive, time-consuming, and resource and labor demanding, many epidemiological surveys do not have these equipment or measurements, which might be a hurdle to further examine the risk factors of PAD or its predictive performance for other clinical outcomes. Consequently, alternative cost-effective, reliable, and valid instruments for PAD prevalence surveillance at the national or regional level, such as scales or other routine examinations in epidemiological studies are on the agenda of the scientific community.
In the present study, we aimed to (1) develop models for PAD risk prediction using a combination of self-reported questions and routine metabolic biomarkers from National Health and Nutrition Examination Surveys (NHANES, 1999–2002); (2) to externally validate these models in NHANES (2003–2004).
METHODS
Study Population
As a nationally representative survey of the US population, NHANES was conducted by the National Center for Health Statistics of the Centers for Disease Control and Prevention. NHANES has been collecting data from personal interviews and physical examinations since 1999. The model training survey is based on 4 years of the continuous NHANES (1999–2002), and the model validation survey is based on NHANES (2003–2004).
All study participants in this study were examined at homes where detailed information on demographic characteristics, smoking and drinking status as well as other risk factors were collected. A physical examination at a mobile examination center was also offered to those who were able to participate. The ABI assessment and the lower extremity disease examination were limited to those who were 40 years and over. Participants who had a bilateral amputation or were obese (>400 pounds) were excluded from the examination. According to a predetermined operation protocol, trained health staff performed the ABI examination in a separate room at the mobile center. Written informed consent was obtained from all study participants. Ethical approval was waived because publicly available data was used. Details of study design were previously described elsewhere.6,10–12
PAD Ascertainment
The ABI value was calculated for each participant. With the participants in the supine position, trained health staff used an 8.1-MHz Doppler probe to perform the examination following a standard operation protocol. The ABI was calculated by dividing the ankle mean systolic blood pressure by brachial mean systolic blood pressure in the same side. The presence of PAD was defined as an ABI < 0.9 in either side.
Covariates
Pulse pressure was calculated as the systolic blood pressure minus the diastolic blood pressure. Hypertension was defined as SBP ≥ 140 mm Hg, DBP ≥ 90 mm Hg, or current medication for hypertension and diabetes mellitus was defined as HbA1c ≥ 6.5% or current medication for diabetes. The TC/HDL ratio was calculated by TC divided by HDL. Smoking status was coded as if participants smoked at least 100 cigarettes in life.
Statistical Analysis
All estimates were weighted, with the sample weights accounting for the unequal selection probability of the complex NHANES sampling and the oversampling of selected population subgroups. Basic characteristics of the 2 study samples were shown as mean (± standard deviation) and numbers (proportions). Multivariable logistic regression models were applied to develop the prediction models in the model training survey. We first searched the potential variables used in current risk prediction models from the published literature. Then we applied likelihood ratio tests to determine which variables being included in the models. For this model selection process, we first included all the potential variables in the models, and then sequentially removed those which were not significant according to the likelihood ratio test in the reduced models compared with the full model. The final model was listed below:
 |
Area under receiver operating characteristics curve (C-statistics), and goodness-of-fit test in a multiple logistic regression13 were used as the metrics to assess the model's performance including discrimination and calibration, respectively. This method has been used in other prediction models previously.14 We also performed bootstrap analysis to evaluate the internal model performance. Replication on 200 different samples drawn with replacement was performed for the bootstrap method. C-statistics from the original study minus optimism was used to calculate the optimisms-corrected C-statistics.15 The optimal cut-off value for predicted probabilities of PAD, distinguishing PAD cases from healthy participants, was chosen by Youden's index. We also validated the final model in another NHANES survey. All statistical analyses were performed using Stata/MP 13.0 and P < 0.05 was regarded as statistical significance.
RESULTS
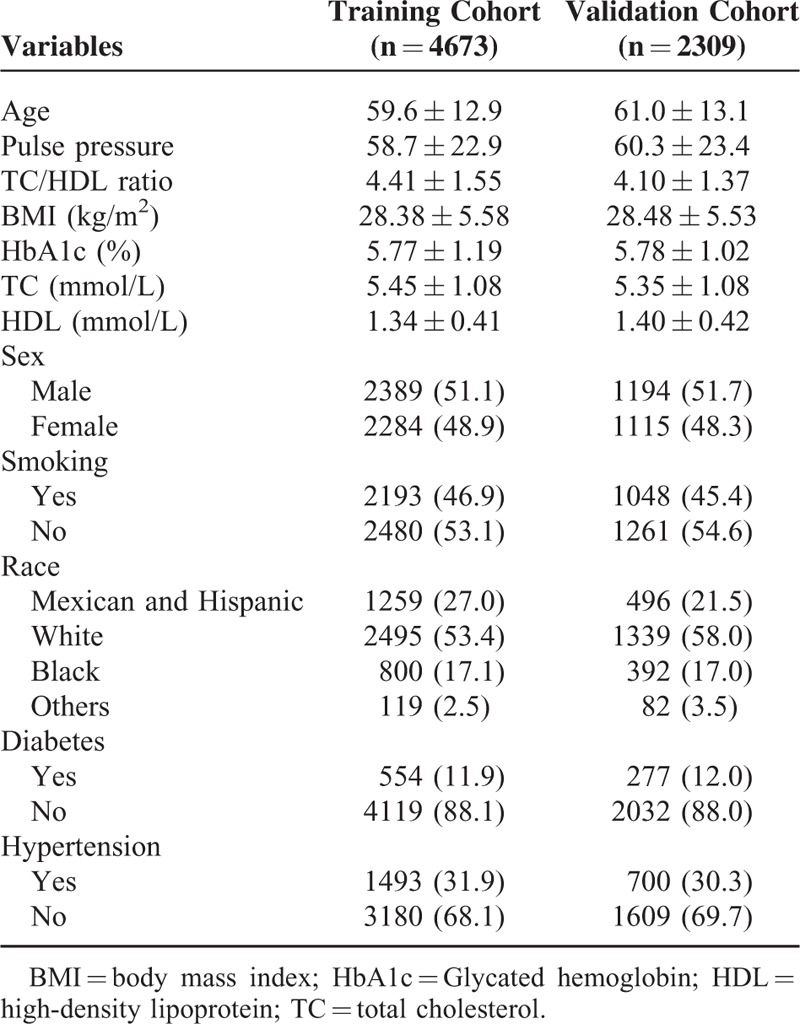
Basic characteristics of study participants are shown in Table 1. In model training survey, the average age was 59.6 years with men comprising 51.1% of the study population, whereas in the model validation survey, the average age was 61.0 years with men comprising 51.7%. The prevalence of PAD was 4.7% in the model training survey and 5.6% in model validation survey.
TABLE 1.
Basic Characteristics of Study Participants in Each Cohort

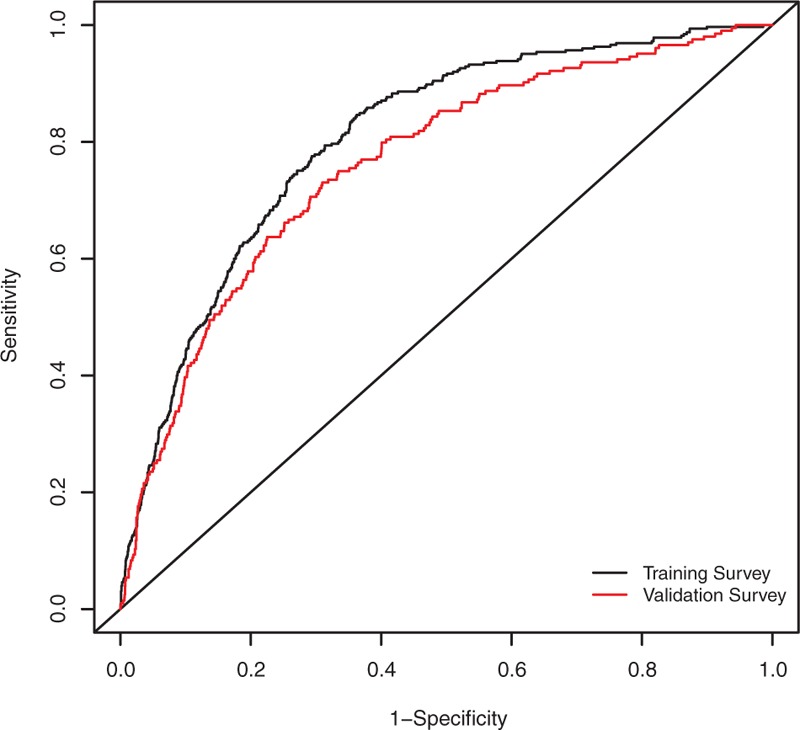
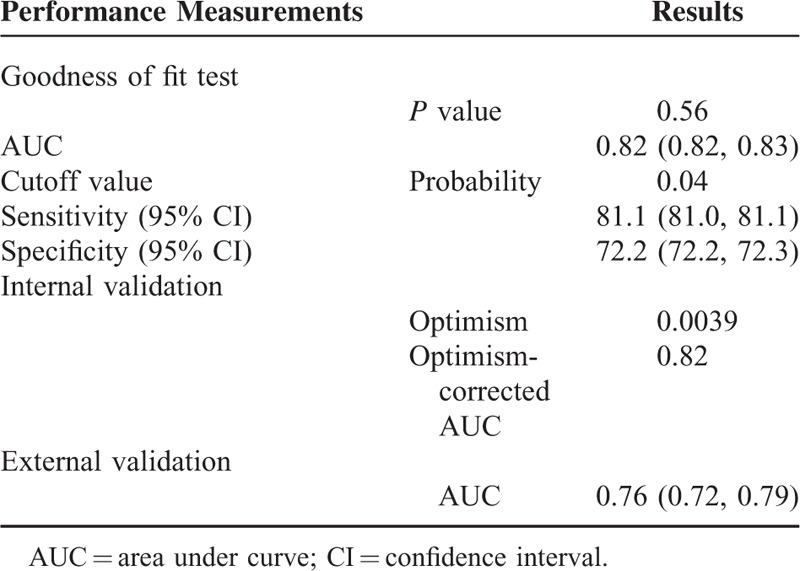
The final model included age, sex, race, pulse pressure, TC/HDL ratio, and smoking status as predicting variables (Table 2). Figure 1 presented the ROC curve for the training and validation surveys. The C-statistics and 95% confidence interval (CI) were 0.82(0.82, 0.83) in the training survey (Table 3). Optimism from Bootstrap internal validation was 0.0015 and optimism-corrected C-statisitcs was comparable to the previous uncorrected one. Hosmer–Lemeshow goodness of fit test revealed P value of 0.56 indicating very good model calibration in the training survey. In terms of model external validation, the C-statistics (95% CI) was 0.76 (0.72, 0.79) as shown in Table 3.
TABLE 2.
Model Coefficients Based on Training Cohort

FIGURE 1.

Model performance for peripheral arterial disease prediction in NHANES. The black line indicates model performance in model training survey, and the red line represents model performance in model validation survey. NHANES = National Health and Nutrition Examination Surveys.
TABLE 3.
Model Performance for Peripheral Arterial Disease

DISCUSSION
In the present study, we developed a risk prediction model for PAD in a training survey and externally validated it in another survey. We found that the models based on self-reported questionnaires and routine clinical metabolic biomarkers had a good discrimination capacity with C-statistics of 0.82 and 0.76 in the training and validation survey, respectively. These results were suggestive that the model performance was moderately good and it might be useful in PAD surveillance and epidemiological studies.
Until now, several groups have proposed PAD prevalence estimation algorithms, of which the predictors in the models varied among different studies.16–20 For example, the Netherland PREVALENT score16 model included age, smoking behavior, hypertension, coronary heart disease, and cerebrovascular disease (CVD) in the final models using stepwise logistic regression models. Likewise, the Spain REASON risk score included age, sex, smoking status, pulse pressure, and diabetes in the final model, which yielded AUC of 0.76 in both the training and validation samples.17 Later, the same group compared the performance of 2 prediction scores and found REASON had better performance in Spain populations.18 Another group developed a PAD score in a US survey21 and selected age, sex, race/ethnicity, smoking status, BMI, hypertension, heart failure, CVD, coronary artery disease, and diabetes in the final models with a moderate discrimination performance (C-statistics:0.61–0.64 in the training and validation samples).
An approach for predicting the risk of PAD in communities is multivariable modeling using self-reported questionnaires combining some routine examination measurements. In our study, we developed a model in the training survey considering several potential variables including age, sex, race, BMI, pulse pressure, fasting glucose, TC, HDL, TC/HDL ratio, smoking, diabetes, and hypertension. Most of the variables were regarded as risk factors of PAD. Consistent with previous research results, age, sex, smoking, and pulse pressure were selected in the final model. Nevertheless, we considered more possible variables to be selected for model development.
In addition to common lipid biomarkers (TC and HDL), we considered TC/HDL ratio as one of the candidate predicting variables because several studies had found a strong association between TC/HDL ratio and PAD independent of other conventional risk factors.22,23 In parallel with previous findings, TC/HDL showed a strong association with PAD and was superior to other lipid biomarkers,22 and it was selected in the final models via likelihood ratio test. Some more variables were also taken into account of model training in the present study. However, they did not show significant improvement for model performance and were not included in the final model. Previous studies have found there were different PAD risk among different sex and race groups,24,25 and smoking had a greater impact on developing PAD.26 Consistent with these findings, our final models also included these parameters. In addition to that, several studies had also found pulse pressure was predictive of PAD independent of traditional risk factors,7,27 we considered it as a potential predictive parameter that showed similar effect size in the final models compared with previous findings.
Our results demonstrated that the prevalence prediction model we developed might be a promising PAD surveillance instrument for the community-based population. In the first place, internal validation analysis was conducted to avoid over-fitting of the prediction models. Bootstrap methods were used to estimate the over-optimism, and the optimism-corrected C-statistics were still good. Next, external validation analysis was performed in a different population. Because the source populations of the training survey and validation survey might be similar, the model performed well in the validation sample. The results of the external validation analyses ascertained the performance of our prediction model.
We do acknowledge that our study has some limitations. The definition of PAD was solely based on ABI. Further information regarding intermittent claudication would definitely reduce information bias. Secondly, although the model we developed was validated in an external survey, the survey was based on similar participants in USA. Thus, additional community-based surveys used for validation might provide robust evidence for the model performance.
In conclusion, we developed a PAD risk prediction model based on self-reported questions, demographic characteristics, and routine metabolic biomarkers that moderately predicted the population PAD risk. This model was validated in an external sample in a different time period and showed a moderate discriminatory power. Our findings may be helpful to assess PAD surveillance and to track susceptible populations. In the future, the proposed model should be validated in other community-based surveys to evaluate their external performance.
Acknowledgement
The authors would like to thank all participants involved in NHANES surveys.
Footnotes
Abbreviations: ABI = ankle brachial index, BMI = body mass index, CI = confidence interval, DBP = diastolic blood pressure, HDL = high density lipoprotein, NHANES = National Health and Nutrition Examination Surveys, OR = odds ratio, PAD = peripheral arterial disease, SBP = systolic blood pressure, TC = total cholesterol.
The authors have no funding and conflicts of interest to disclose.
REFERENCES
- 1.Doobay AV, Anand SS. Sensitivity and specificity of the ankle-brachial index to predict future cardiovascular outcomes: a systematic review. Arterioscler Thromb Vasc Biol 2005; 25:1463–1469. [DOI] [PubMed] [Google Scholar]
- 2.Tsai AW, Folsom AR, Rosamond WD, et al. Ankle-brachial index and 7-year ischemic stroke incidence: the ARIC study. Stroke 2001; 32:1721–1724. [DOI] [PubMed] [Google Scholar]
- 3.Fowkes FG, Murray GD, Butcher I, et al. Ankle brachial index combined with Framingham Risk Score to predict cardiovascular events and mortality: a meta-analysis. JAMA 2008; 300:197–208. [DOI] [PMC free article] [PubMed] [Google Scholar]
- 4.Korhonen PE, Seppala T, Kautiainen H, et al. Ankle-brachial index and health-related quality of life. Eur J Prev Cardiol 2012; 19:901–907. [DOI] [PubMed] [Google Scholar]
- 5.Shammas NW. Epidemiology, classification, and modifiable risk factors of peripheral arterial disease. Vasc Health Risk Manag 2007; 3:229–234. [DOI] [PMC free article] [PubMed] [Google Scholar]
- 6.Gregg EW, Sorlie P, Paulose-Ram R, et al. Prevalence of lower-extremity disease in the US adult population ≥40 years of age with and without diabetes: 1999–2000 national health and nutrition examination survey. Diabetes Care 2004; 27:1591–1597. [DOI] [PubMed] [Google Scholar]
- 7.Zhan Y, Yu J, Chen R, et al. Prevalence of low ankle brachial index and its association with pulse pressure in an elderly Chinese population: a cross-sectional study. J Epidemiol 2012; 22:454–461. [DOI] [PMC free article] [PubMed] [Google Scholar]
- 8.Beckman JA, Jaff MR, Creager MA. The United States preventive services task force recommendation statement on screening for peripheral arterial disease: more harm than benefit? Circulation 2006; 114:861–866. [DOI] [PubMed] [Google Scholar]
- 9.Layden J, Michaels J, Bermingham S, et al. Diagnosis and management of lower limb peripheral arterial disease: summary of NICE guidance. BMJ 2012; 345:e4947. [DOI] [PubMed] [Google Scholar]
- 10.O’Hare AM, Glidden DV, Fox CS, et al. High prevalence of peripheral arterial disease in persons with renal insufficiency: results from the National Health and Nutrition Examination Survey 1999–2000. Circulation 2004; 109:320–323. [DOI] [PubMed] [Google Scholar]
- 11.Selvin E, Erlinger TP. Prevalence of and risk factors for peripheral arterial disease in the United States: results from the National Health and Nutrition Examination Survey, 1999–2000. Circulation 2004; 110:738–743. [DOI] [PubMed] [Google Scholar]
- 12.Shankar A, Teppala S, Sabanayagam C. Bisphenol A and peripheral arterial disease: results from the NHANES. Environ Health Perspect 2012; 120:1297–1300. [DOI] [PMC free article] [PubMed] [Google Scholar]
- 13.Archer KJ, Lemeshow S. Goodness-of-fit test for a logistic regression model fitted using survey sample data. Stata J 2006; 6:97–105. [Google Scholar]
- 14.Zhan Y, Holtfreter B, Meisel P, et al. Prediction of periodontal disease: modelling and validation in different general German populations. J Clin Periodontol 2014; 41:224–231. [DOI] [PubMed] [Google Scholar]
- 15.Steyerberg EW, Harrell FE, Jr, Borsboom GJ, et al. Internal validation of predictive models: efficiency of some procedures for logistic regression analysis. J Clin Epidemiol 2001; 54:774–781. [DOI] [PubMed] [Google Scholar]
- 16.Bendermacher BL, Teijink JA, Willigendael EM, et al. A clinical prediction model for the presence of peripheral arterial disease—the benefit of screening individuals before initiation of measurement of the ankle-brachial index: an observational study. Vasc Med 2007; 12:5–11. [DOI] [PubMed] [Google Scholar]
- 17.Ramos R, Baena-Diez JM, Quesada M, et al. Derivation and validation of REASON: a risk score identifying candidates to screen for peripheral arterial disease using ankle brachial index. Atherosclerosis 2011; 214:474–479. [DOI] [PubMed] [Google Scholar]
- 18.Grau M, Baena-Diez JM, Felix-Redondo FJ, et al. Estimating the risk of peripheral artery disease using different population strategies. Prev Med 2013; 57:328–333. [DOI] [PubMed] [Google Scholar]
- 19.Bendermacher BL, Teijink JA, Willigendael EM, et al. Symptomatic peripheral arterial disease: the value of a validated questionnaire and a clinical decision rule. Br J Gen Pract 2006; 56:932–937. [PMC free article] [PubMed] [Google Scholar]
- 20.Zhan Y, Zhuang J, Dong Y, et al. Predicting the prevalence of peripheral arterial diseases: modelling and validation in different cohorts. VASA 2016; 45:31–36. [DOI] [PubMed] [Google Scholar]
- 21.Duval S, Massaro JM, Jaff MR, et al. An evidence-based score to detect prevalent peripheral artery disease (PAD). Vasc Med 2012; 17:342–351. [DOI] [PubMed] [Google Scholar]
- 22.Zhan Y, Yu J, Ding R, et al. Triglyceride to high density lipoprotein cholesterol ratio, total cholesterol to high density lipoprotein cholesterol ratio and low ankle brachial index in an elderly population. Vasa 2014; 43:189–197. [DOI] [PubMed] [Google Scholar]
- 23.Pradhan AD, Shrivastava S, Cook NR, et al. Symptomatic peripheral arterial disease in women: nontraditional biomarkers of elevated risk. Circulation 2008; 117:823–831. [DOI] [PubMed] [Google Scholar]
- 24.Collins TC, Petersen NJ, Suarez-Almazor M, et al. Ethnicity and peripheral arterial disease. Mayo Clin Proc 2005; 80:48–54. [DOI] [PubMed] [Google Scholar]
- 25.Zhan Y, Dong Y, Tang Z, et al. Serum uric acid, gender, and low ankle brachial index in adults with high cardiovascular risk. Angiology 2015; 66:687–691. [DOI] [PubMed] [Google Scholar]
- 26.Lu L, Mackay DF, Pell JP. Meta-analysis of the association between cigarette smoking and peripheral arterial disease. Heart 2014; 100:414–423. [DOI] [PubMed] [Google Scholar]
- 27.Korhonen P, Kautiainen H, Aarnio P. Pulse pressure and subclinical peripheral artery disease. J Hum Hypertens 2014; 28:242–245. [DOI] [PubMed] [Google Scholar]


