

Abstract
Whole brain segmentation (with comprehensive cortical and subcortical labels) and cortical surface reconstruction are two essential techniques for investigating the human brain. The two tasks are typically conducted independently, however, which leads to spatial inconsistencies and hinders further integrated cortical analyses. To obtain self-consistent whole brain segmentations and surfaces, FreeSurfer segregates the subcortical and cortical segmentations before and after the cortical surface reconstruction. However, this “segmentation to surface to parcellation” strategy has shown limitations in various situations. In this work, we propose a novel “multi-atlas segmentation to surface” method called Multi-atlas CRUISE (MaCRUISE), which achieves self-consistent whole brain segmentations and cortical surfaces by combining multi-atlas segmentation with the cortical reconstruction method CRUISE. To our knowledge, this is the first work that achieves the reliability of state-of-the-art multi-atlas segmentation and labeling methods together with accurate and consistent cortical surface reconstruction. Compared with previous methods, MaCRUISE has three features: (1) MaCRUISE obtains 132 cortical/subcortical labels simultaneously from a single multi-atlas segmentation before reconstructing volume consistent surfaces; (2) Fuzzy tissue memberships are combined with multi-atlas segmentations to address partial volume effects; (3) MaCRUISE reconstructs topologically consistent cortical surfaces by using the sulci locations from multi-atlas segmentation. Two data sets, one consisting of five subjects with expertly traced landmarks and the other consisting of 100 volumes from elderly subjects are used for validation. Compared with CRUISE, MaCRUISE achieves self-consistent whole brain segmentation and cortical reconstruction without compromising on surface accuracy. MaCRUISE is comparably accurate to FreeSurfer while achieving greater robustness across an elderly population.
Keywords: Multi-atlas Segmentation, Magnetic Resonance Imaging, Cerebral Cortex, Cortical Reconstruction
1. Introduction
Accurate whole brain segmentation and cortical reconstruction for magnetic resonance imaging (MRI) play an essential role in clinical investigation and neurology research. Morphometric measurements, such as volume size, shape variation, cortical thickness, and surface area are obtained from these techniques. Typically, the whole brain segmentations that contain comprehensive cortical and subcortical labels are conducted by state-of-the-art multi-atlas segmentation methods [1-3] while the cortical surfaces are reconstructed by popular tools such as FreeSurfer [4] and CRUISE [5]. Since the steps are conducted independently, the volume segmentations and cortical surfaces may be inconsistent, which prevents integrated analyses. FreeSurfer is a very well-known method for whole brain segmentation and cortical reconstruction. FreeSurfer first automatically labels whole brain as gray matter (GM), white matter (WM), cerebrospinal fluid (CSF) and subcortical regions by combining the Markov random field (MRF) and probabilistic atlases into a Bayesian framework [6, 7]. Then, an outer (or pial) surface is reconstructed based on the GM/CSF boundaries while an inner surface is reconstructed based on the GM/WM interface [4]. Finally, the cortical GM regions are labeled based on a surface parcellation which forces the cortical segmentations to be consistent with the surfaces [8, 9]. However, since the latter steps strongly rely on the previous steps in this “segmentation to surface reconstruction to parcellation” strategy, the cortical parcellation fails when the surfaces are reconstructed incorrectly. As a result, a manual inspection and correction step is typically necessary.
In this paper, we propose a novel “multi-atlas segmentation to surface” method called Multi-atlas Cortical Reconstruction Using Implicit Surface Evolution (MaCRUISE) which simultaneously obtains 132 cortical/subcortical labels from a single multi-atlas segmentation and then achieves volume consistent and robust cortical surfaces based on the same segmentation. Specifically, MaCRUISE achieves robust and self-consistent whole brain segmentations and cortical surfaces by combining the state-of-the-art Non-local Spatial Staple (NLSS) multi-atlas framework [1] with the well validated surface reconstruction method CRUISE [5, 10]. Because of bias in the manual segmentation protocol and errors caused by the partial volume effect (PVE), direct NLSS surface reconstruction and independent application of CRUISE after NLSS do not yield a consistent segmentation and labeling. However, our new approach shows that incorporation of both NLSS and CRUISE together (as MaCRUISE) yields an accurate and consistent result. Figure 1 shows one example of NLSS multi-atlas segmentation and the inaccurate surfaces from directly combining NLSS with CRUISE (NLSS+CRUISE). In the right hand panel of Figure 1D, the inner and outer surfaces from NLSS+CRUISE (solid lines) are inaccurate; however, these are improved by the proposed MaCRUISE method (dashed lines).
Figure 1.
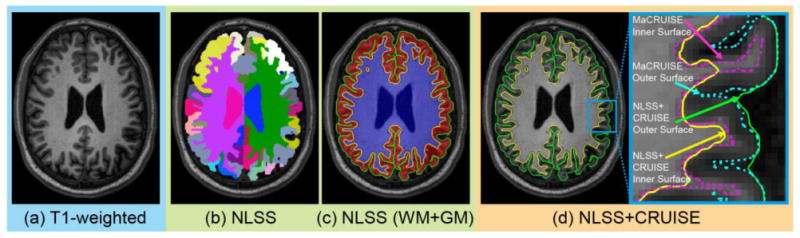
This figure shows an example of multi-atlas segmentation and the challenge of applying multi-atlas segmentation to cortical reconstruction. (a) T1-weighted volume. (b) NLSS multi-atlas segmentation. (c) GM (red) and WM (blue) segmentation by combining NLSS labels. (d) Cortical surfaces are reconstructed by applying NLSS WM and GM to CRUISE directly. The right hand panel of (d) shows the outer surface (green) and inner surface (yellow) from NLSS+CRUISE are inaccurate. The dashed surfaces indicate the improvements by using the MaCRUISE method.
2. Methods
MaCRUISE consists of five major steps as shown in Figure 2: (1) one of 133 labels is assigned to every voxel by state-of-the-art multi-atlas segmentation method; (2) The fuzzy membership of GM, WM, and CSF for each voxel are obtained by TOplogypreserving Anatomical Segmentation (TOADS) [11]; (3) The multi-atlas segmentations and the TOADS memberships are fused together to form new robust segmentations; (4) The volume consistent cortical surfaces are reconstructed based on the new segmentations and a new speed function [5]; (5) The consistency of segmentations and surfaces is further improved by label correction. The five steps are introduced sequentially in this section.
Figure 2.
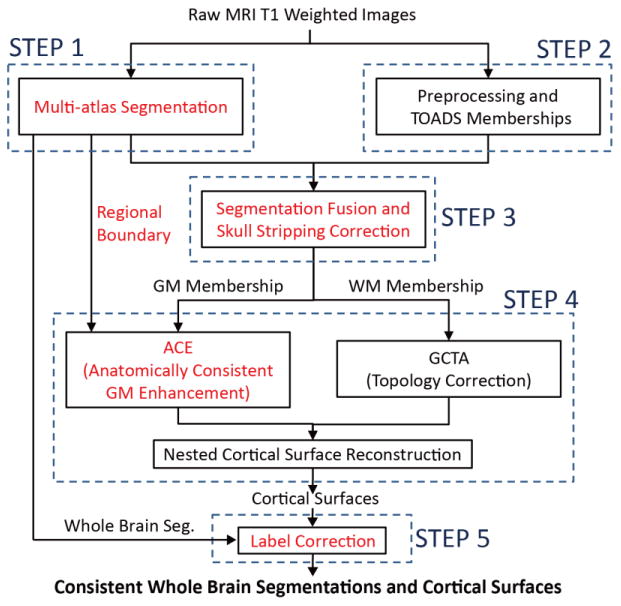
Block diagram of MaCRUISE. Black blocks indicate the steps in original CRUISE while red text indicates the additional steps in MaCRUISE. All steps in MaCRUISE are grouped to five main steps.
2.1 Multi-atlas Segmentation
In NLSS multi-atlas segmentation framework, each target image is first affinely registered [12] to the MNI305 atlas [13]. Then, atlases (manually labeled example images) are non-rigidly registered to the target image [14] and non-local weighted statistical fusion [1] is used to combine the labels from each atlas to the target image. After multi-atlas labeling, each voxel in the brain is assigned to one of the 133 labels (132 brain regions and 1 background) by the BrainCOLOR protocol [15]. Then, all cortical GM labels are combined into one GM segmentation MGM while all WM labels and several subcortical labels (nucleus accumbens, amygdala, lateral ventricle, pallidum, putamen, thalamus, and ventral diencephalon) are combined to another WM segmentation MWM. These subcortical labels in MWM are selected based on their spatial relationships to WM which is similar as the “Autofill” procedure in CRUISE [5]. Finally, MGM, MWM, and the remaining subcortical labels (hippocampus, amygdala, basal forebrain and inferior lateral ventricle) are grouped together to form a cerebrum segmentation MCerebrum.
2.2 Memberships from TOADS Segmentation
Since atlases are manually labeled based on the expert defined protocol in multi-atlas segmentation, objective bias occurs. To address the bias and PVE, fuzzy memberships are used by MaCRUISE. First, whole brain tissue volumes are extracted after preprocessing including field correction, skull-stripping and dura-stripping [10, 16]. Then, three memberships GM, WM, and CSF for each voxel i are obtained by a fuzzy segmentation. Finally, TOADS achieves robust memberships μt for the three classes ( , and ) by using topological and statistical atlases [11].
2.3 Combine Multi-atlas Segmentation with TOADS Memberships
In this step, the multi-atlas hard segmentations are combined with the TOADS memberships to obtain refined GM, WM and CSF memberships ( , and ) for each voxel. The combination consists of four stages.
-
Stage I assigns TOADS membership values within multi-atlas cerebrum segmentations.
(1) -
Stage II eliminates all the memberships outside the multi-atlas cerebrum segmentations.
(2) This step not only restricts outer boundaries of brain tissues by cleaning up the remaining dura and skull but also removes the cerebellum and brain stem by multi-atlas segmentations, improving the robustness of the cerebellum and brain stem removal obtained by TOADS.
-
Stage III fills in the WM using the multi-atlas WM segmentation, which serves as an approximation of the inner cortical volume.
(3) -
Stage IV corrects the inaccurate skull-stripping for the voxels whose are extremely small within .
(4)
2.4 Introduce Multi-atlas Cortical Regional Boundaries to Surface Reconstruction
To achieve volume consistent surfaces, we modify the speed function F(x) in the Anatomically Consistent Enhancement (ACE) step of CRUISE to a new form:
| (5) |
where uCSF(x) is the CSF fuzzy membership function and uboundary(x) is the multi-atlas segmentation boundary function for which uboundary(x) =1 when x is within one voxel distance from the cortical regional boundaries of the original multi-atlas segmentation; otherwise uboundary(x) = 0. This new speed function not only forces the reconstructed surfaces to be consistent with the multi-atlas segmentation but also detects more sulci that are not able to be detected by original ACE.
Then, WM topology correction is conducted by the Graph-based Topology Correction Algorithm (GTCA) [17, 18]. Finally, cortical surfaces are reconstructed by a nested cortical surface reconstruction algorithm that uses the Topology-preserving geometric deformable surface model (TGDM) (which is the same strategy used by CRUISE) [19].
2.5 Label Correction
A label correction step is conducted to refine the whole brain multi-atlas segmentations based on the cortical surfaces. We define the distance thresholds α and β to correct cortical labels to WM and background. The cortical labels are corrected to WM labels when their signed distance values to inner surface's zero level set are smaller than α. Meanwhile, the cortical labels are corrected to background label when their signed distance values to outer surface's zero level set are greater than β. The α parameter is empirically set to 0.5 mm while β is empirically set to 0.5 mm. This step further forces the segmentations to be consistent with the reconstructed cortical surfaces.
3. Results
3.1 Landmark Based Validation
A publically available dataset that consists of five healthy subjects (age range: 30-49) from the “Multi-Modal MRI Reproducibility Resource” are used in the first experiment [20]. For each subject, two raters (Rater A and B) placed 420 landmarks on both outer and inner surfaces [10]. Thus, a total of 2100 landmarks for each surface were used to evaluate the performance of NLSS+CRUISE, MaCRUISE compared with two benchmarks: CRUISE and FreeSurfer. Table 1 shows that the absolute surface errors (distance from surfaces to landmarks) of NLSS+CRUISE is much larger than FreeSurfer and CRUISE. However, the surface errors of MaCRUISE are comparable to those of both FreeSurfer and CRUISE. Table 2 statistically evaluates the differences in Table 1 by conducting paired t-tests and effect size analyses. From the p values, most differences are significant. However, since the paired t-tests are conducted on a large sample size, a small p-value might not yield a large effect. Thus, the effect size measurement based on Cohen's d value [21] is employed to evaluate the effectiveness of the differences. Comprehensively considering p values and d values, NLSS+CRUISE's surface errors are significantly larger than the FreeSurfer and CRUISE (outer surface) since its p values are smaller than 0.001 and its d values are “medium effect” or “large effect”. In contrast, even if statistically significant in the paired t-test, the differences between MaCRUISE and CRUISE are “trivial” (d<0.1). Meanwhile, the differences between MaCRUISE and FreeSurfer on inner surface errors are “small effect” since the d values are smaller than (0.2≤d<0.5). For the outer surface, the statistical results from two raters do not provide a consistent evidence to tell if MaCRUISE or FreeSurfer is better. To conclude, MaCRUISE achieves comparable performance to the two benchmarks.
Table 1.
Absolute surface errors on subjects with healthy anatomy (mean ± standard deviation in mm).
| FreeSurfer | CRUISE | NLSS+CRUISE | MaCRUISE | ||
|---|---|---|---|---|---|
| Optimal resolution* | 1×1×1mm3 | 0.8×0.8×0.8 mm3 | 0.8×0.8×0.8 mm3 | 0.8×0.8×0.8 mm3 | |
| Rater A | Outer Surface | 0.524 ± 0.372 | 0.486 ± 0.413 | 0.880 ± 0.755 | 0.518 ± 0.414 |
| Inner Surface | 0.460 ± 0.371 | 0.540 ± 0.429 | 0.799 ± 0.758 | 0.544 ± 0.431 | |
|
| |||||
| Rater B | Outer Surface | 0.434 ± 0.369 | 0.613 ± 0.546 | 1.050 ± 0.889 | 0.585 ± 0.464 |
| Inner Surface | 0.432 ± 0.362 | 0.542 ± 0.483 | 0.913 ± 0.961 | 0.544 ± 0.482 | |
We resampled the original images to either 1×1×1 mm3 or 0.8×0.8×0.8 mm3 prior to running the different methods. The best results and their corresponding resolutions are reported in this table.
Table 2.
Paired t-test and effect size analyses on absolute surface errors for 2100 landmarks.
| Rater A | Rater B | ||||
|---|---|---|---|---|---|
|
| |||||
| p value | Cohen's d* | p value | Cohen's d | ||
| NLSS+CRUISE vs. FreeSurfer | Outer Surface | <0.001 | 0.598 | <0.001 | 0.905 |
| Inner Surface | <0.001 | 0.567 | <0.001 | 0.662 | |
| NLSS+CRUISE vs. CRUISE | Outer Surface | <0.001 | 0.648 | <0.001 | 0.592 |
| Inner Surface | <0.001 | 0.419 | <0.001 | 0.488 | |
|
| |||||
| MaCRUISE vs.FreeSurfer | Outer Surface | 0.541 | 0.015 | <0.001 | 0.361 |
| Inner Surface | <0.001 | 0.209 | <0.001 | 0.262 | |
| MaCRUISE vs. CRUISE | Outer Surface | <0.001 | 0.078 | <0.001 | 0.055 |
| Inner Surface | <0.001 | 0.009 | 0.145 | 0.003 | |
Cohen's d score is defined as “trivial” (d<0.2),“small effect” (0.2≤d<0.5), “medium effect” (0.5≤d<0.8), “large effect” (d≥0.8). The bold d value numbers indicates the “medium” or “large” effect. Double underline indicates the significantly systematic superior methods (p<0.001 and d≥0.5), while the dotted underline means there are no systematic differences (p>0.05 or d<0.5) between methods. Underline indicates the significantly superior methods (p<0.001 and d≥0.5) from at least one rater on certain surface.
Figure 3A shows the reconstructed inner and outer surfaces from one subject in the first experiment. It shows that FreeSurfer reconstructs accurate surfaces and that NLSS+CRUISE has the worst performance. Meanwhile, we find that the MaCRUISE surfaces are more accurate than CRUISE in the red rectangles that are not reflected by landmark analyses. More importantly, Figure 3B demonstrates that MaCRUISE provides self-consistent whole brain segmentations and cortical surfaces after label correction.
Figure 3.
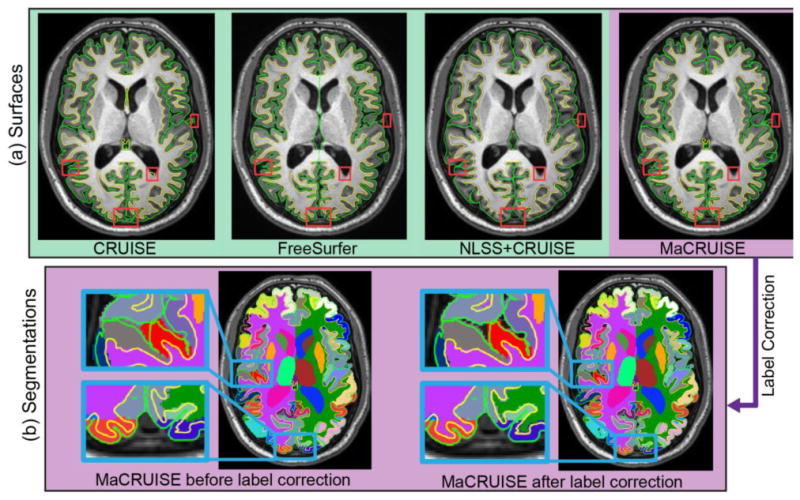
(a) This figure shows the inner and outer surfaces reconstructed by different methods. FreeSurfer reconstructs accurate cortical surfaces. The surfaces computed from NLSS+CRUISE are inaccurate. Regions marked by red rectangles show regions where MaCRUISE has better performance than CRUISE. (b) After label correction, MaCRUISE obtains self-consistent cortical surfaces and whole brain segmentations.
In summary, MaCRUISE obtained significant improvements on surface accuracy as compared to NLSS+CRUISE by addressing the bias in BrainCOLOR protocol and PVE. MaCRUISE achieves self-consistent whole brain segmentations and cortical surfaces that CRUISE does not. MaCRUISE also achieves comparable accurate cortical reconstruction in comparison to the FreeSurfer benchmark.
3.1 Whole Brain Analyses
A second experiment using 100 3D MPRAGE images from Baltimore Longitudinal Study of Aging (BLSA) study [22] was conducted to evaluate the robustness of MaCRUISE, CRUISE, and FreeSurfer. The number of global failures is used as a robustness metric.
First, we calculate the surface distances between MaCRUISE and the benchmarks (CRUISE and FreeSurfer) to evaluate their global performance. Notice that the surface regions that separate two hemispheres in FreeSurfer are excluded from the surface distance measurement since MaCRUISE and CRUISE do not have such surfaces. The histograms show the mean surface distances between MaCRUISE and benchmarks on 100 volumes (Figure 4A). Most of the mean surface distances are around or smaller than 0.5 mm, which shows that the performance of MaCRUISE is consistent with benchmarks in most cases. However, we do find three images (marked 1 to 3) that are located outside of two standard deviations. The huge surface distances indicate that failures are occurring in these images.
Figure 4.
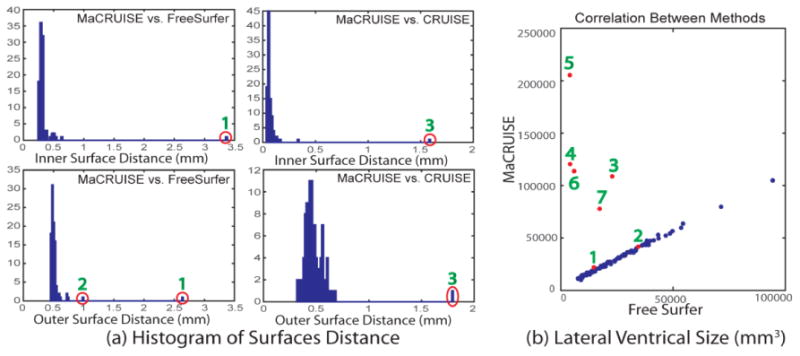
This figure compares the consistency between different methods. (a) Three failed cases (marked as 1 to 3) are detected by comparing surface distances between MaCRUISE and two benchmarks. (b) Five failed cases (marked as 3 to 7) are found by correlating the lateral ventricle volume size between MaCRUISE and FreeSurfer. Finally, seven unique failed volumes are detected by comprehensively using the previous two metrics. Visual assessment of all of the remaining 93 volumes did not find global failures.
Second, the segmentations of the lateral ventricles, where inaccuracies are often found, are used to find more failures. We plot the lateral ventricle size from MaCRUISE and FreeSurfer segmentations in a correlation form (Figure 4B). A strong linear correlation is found except in five outlier volumes (marked 3 to 7). We also marked three outliers (marked 1 to 3) from the surface distance analyses.
From the above approach, a total of seven failed volumes were automatically detected. The segmentations and surfaces of the failures are shown in Figure 5. We find that global failures (in the red rectangles) happen in all seven volumes for FreeSurfer and in one volume (volume 3) for CRUISE. Meanwhile, local failures (in the blue rectangles) are found around the lateral ventricles for CRUISE. In contrast, we do not find any global failures from MaCRUISE. For a complete analysis, we also visually checked the surfaces for the remaining 93 volumes and did not find global failures for either MaCRUISE or the benchmark algorithms.
Figure 5.
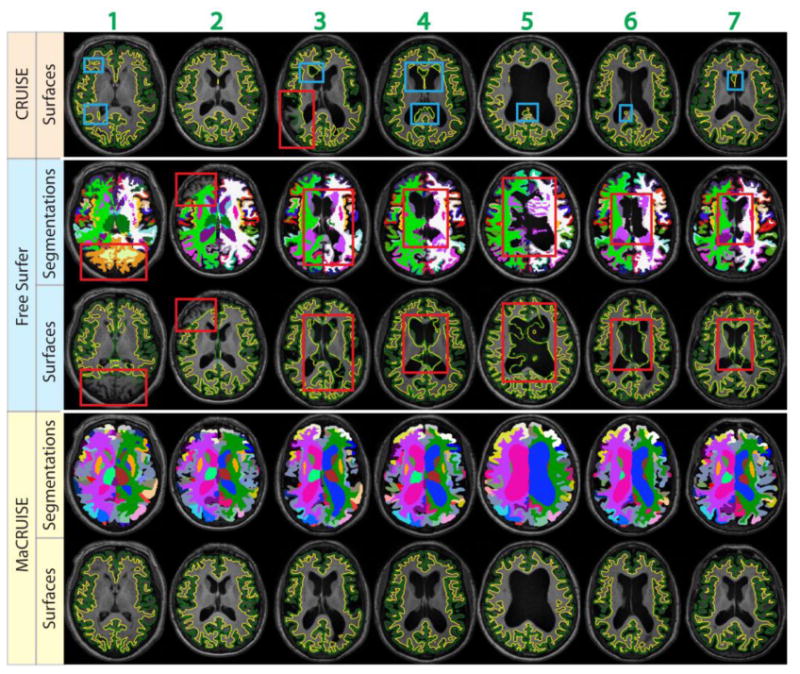
This figure shows the failures for seven problematic volumes. Both whole brain segmentations and cortical surfaces on axial slices are provided. The areas in red rectangles show the global failures while the areas in blue rectangles show the local failures. MaCRUISE did not exhibit such failures in any images.
In summary, the second experiment demonstrates that MaCRUISE obtains more robust surfaces than CRUISE while uniquely achieving self-consistent whole brain segmentation and cortical reconstruction. When both generating self-consistent whole brain segmentations and cortical surfaces, MaCRUISE is more robust than FreeSurfer benchmark as all seven global failures were from the latter method.
4. Conclusion
To conclude, MaCRUISE addresses the challenging issue of obtaining self-consistent whole brain segmentation and cortical surface reconstruction from a new “multi-atlas segmentation to surface” perspective. The proposed method uniquely achieves the reliability of multi-atlas methods, while finding topologically consistent and volumetric accurate cortical surfaces. The landmark based validation shows that MaCRUISE derives the self-consistent segmentations and surfaces without compromising on the surface accuracy. The whole brain validation demonstrates that MaCRUISE is the most robust method when compared with two benchmarks on 100 BLSA volumes.
Acknowledgments
This research was supported by NSF CAREER 1452485, NIH 5R21EY024036, NIH 1R21NS064534, NIH 2R01EB006136, NIH 1R03EB012461, NIH R01EB006193, NIH 5R01NS056307, 5R21NS082891, and also supported by the Intramural Research Program, National Institute on Aging, NIH and in part using the resources of the Advanced Computing Center for Research and Education (ACCRE) at Vanderbilt University, Nashville, TN. This project was supported in part by ViSE/VICTR VR3029 and the National Center for Research Resources, Grant UL1 RR024975-01, and is now at the National Center for Advancing Translational Sciences, Grant 2 UL1 TR000445-06. The content is solely the responsibility of the authors and does not necessarily represent the official views of the NIH or the NSF.
References
- 1.Asman AJ, Landman BA. Non-local statistical label fusion for multi-atlas segmentation. Med Image Anal. 2013;17(2):194–208. doi: 10.1016/j.media.2012.10.002. [DOI] [PMC free article] [PubMed] [Google Scholar]
- 2.Heckemann RA, Hajnal JV, Aljabar P, et al. Automatic anatomical brain MRI segmentation combining label propagation and decision fusion. Neuroimage. 2006;33(1):115–26. doi: 10.1016/j.neuroimage.2006.05.061. [DOI] [PubMed] [Google Scholar]
- 3.Warfield SK, Zou KH, Wells WM. Simultaneous truth and performance level estimation (STAPLE): an algorithm for the validation of image segmentation. IEEE Trans Med Imaging. 2004;23(7):903–21. doi: 10.1109/TMI.2004.828354. [DOI] [PMC free article] [PubMed] [Google Scholar]
- 4.Dale AM, Fischl B, Sereno MI. Cortical surface-based analysis. I. Segmentation and surface reconstruction. Neuroimage. 1999;9(2):179–94. doi: 10.1006/nimg.1998.0395. [DOI] [PubMed] [Google Scholar]
- 5.Han X, Pham DL, Tosun D, et al. CRUISE: cortical reconstruction using implicit surface evolution. Neuroimage. 2004;23(3):997–1012. doi: 10.1016/j.neuroimage.2004.06.043. [DOI] [PubMed] [Google Scholar]
- 6.Fischl B, Salat DH, Busa E, et al. Whole brain segmentation: automated labeling of neuroanatomical structures in the human brain. Neuron. 2002;33(3):341–55. doi: 10.1016/s0896-6273(02)00569-x. [DOI] [PubMed] [Google Scholar]
- 7.Fischl B, Salat DH, van der Kouwe AJ, et al. Sequence-independent segmentation of magnetic resonance images. Neuroimage. 2004;23(Suppl 1):S69–84. doi: 10.1016/j.neuroimage.2004.07.016. [DOI] [PubMed] [Google Scholar]
- 8.Fischl B, van der Kouwe A, Destrieux C, et al. Automatically parcellating the human cerebral cortex. Cereb Cortex. 2004;14(1):11–22. doi: 10.1093/cercor/bhg087. [DOI] [PubMed] [Google Scholar]
- 9.Desikan RS, Segonne F, Fischl B, et al. An automated labeling system for subdividing the human cerebral cortex on MRI scans into gyral based regions of interest. Neuroimage. 2006;31(3):968–80. doi: 10.1016/j.neuroimage.2006.01.021. [DOI] [PubMed] [Google Scholar]
- 10.Shiee N, Bazin PL, Cuzzocreo JL, et al. Reconstruction of the human cerebral cortex robust to white matter lesions: method and validation. Hum Brain Mapp. 2014;35(7):3385–401. doi: 10.1002/hbm.22409. [DOI] [PMC free article] [PubMed] [Google Scholar]
- 11.Bazin PL, Pham DL. Homeomorphic brain image segmentation with topological and statistical atlases. Med Image Anal. 2008;12(5):616–25. doi: 10.1016/j.media.2008.06.008. [DOI] [PMC free article] [PubMed] [Google Scholar]
- 12.Ourselin S, Roche A, Subsol G, et al. Reconstructing a 3D structure from serial histological sections. Image and Vision Computing. 2001;19(1-2):25–31. [Google Scholar]
- 13.Evans AC, Collins DL, Mills S, et al. 3D statistical neuroanatomical models from 305 MRI volumes. Nuclear Science Symposium and Medical Imaging Conference. 1993:1813–1817. [Google Scholar]
- 14.Avants BB, Epstein CL, Grossman M, et al. Symmetric diffeomorphic image registration with cross-correlation: evaluating automated labeling of elderly and neurodegenerative brain. Med Image Anal. 2008;12(1):26–41. doi: 10.1016/j.media.2007.06.004. [DOI] [PMC free article] [PubMed] [Google Scholar]
- 15.Klein A, Dal Canton T, Ghosh SS, et al. Open labels: online feedback for a public resource of manually labeled brain images. 16th Annual Meeting for the Organization of Human Brain Mapping. 2010 [Google Scholar]
- 16.Carass A, Cuzzocreo J, Wheeler MB, et al. Simple paradigm for extra-cerebral tissue removal: algorithm and analysis. Neuroimage. 2011;56(4):1982–92. doi: 10.1016/j.neuroimage.2011.03.045. [DOI] [PMC free article] [PubMed] [Google Scholar]
- 17.Han X, Xu C, Braga-Neto U, et al. Topology correction in brain cortex segmentation using a multiscale, graph-based algorithm. IEEE Trans Med Imaging. 2002;21(2):109–21. doi: 10.1109/42.993130. [DOI] [PubMed] [Google Scholar]
- 18.Han X, Braga-Neto U, Prince JL, et al. Graph-based topology correction for brain cortex segmentation. Proc IPMI. 2001:395–401. doi: 10.1109/42.993130. [DOI] [PubMed] [Google Scholar]
- 19.Han X, Xu CY, Prince JL. A topology preserving level set method for geometric deformable models. Ieee Transactions on Pattern Analysis and Machine Intelligence. 2003;25(6):755–768. [Google Scholar]
- 20.Landman BA, Huang AJ, Gifford A, et al. Multi-parametric neuroimaging reproducibility: a 3-T resource study. Neuroimage. 2011;54(4):2854–66. doi: 10.1016/j.neuroimage.2010.11.047. [DOI] [PMC free article] [PubMed] [Google Scholar]
- 21.Cohen J. Statistical power analysis for the behavioral sciences. Lawrence Erlbaum Associates, Inc; 1977. [Google Scholar]
- 22.Shock NW. Normal human aging: The Baltimore longitudinal study of aging. NIH Publication No 84-2450. 1984 [Google Scholar]