

Abstract
To develop new diagnostic and therapeutic tools to specifically target pancreatic tumors, it is necessary to identify cell-surface proteins that may serve as potential tumor-specific targets. In this study we used an azido-labeled bioorthogonal chemical reporter to metabolically label N-linked glycoproteins on the surface of pancreatic cancer cell lines to identify potential targets that may be exploited for detection and/or treatment of pancreatic cancer. Labeled glycoproteins were tagged with biotin using click chemistry, purified by streptavidin-coupled magnetic beads, separated by gel electrophoresis, and identified by liquid chromatography-tandem mass spectrometry (MS). MS/MS analysis of peptides from 3 cell lines revealed 954 unique proteins enriched in the azido sugar samples relative to control sugar samples. A comparison of the proteins identified in each sample indicated 20% of these proteins were present in 2 cell lines (193 of 954) and 17 of the proteins were found in all 3 cell lines. Five of the 17 proteins identified in all 3 cell lines have not been previously reported to be expressed in pancreatic cancer; thus indicating that novel cell-surface proteins can be revealed through glycoprotein profiling. Western analysis of one of these glycoproteins, ecto-5′-nucleotidase (NT5E), revealed it is expressed in 8 out of 8 pancreatic cancer cell lines examined. Further, immunohistochemical analysis of human pancreatic tissues indicates NT5E is significantly overexpressed in pancreatic tumors compared to normal pancreas. Thus, we have demonstrated that metabolic labeling with bioorthogonal chemical reporters can be used to selectively enrich and identify novel cell-surface glycoproteins expressed in pancreatic ductal adenocarcinomas.
Keywords: bioorthogonal labeling, biomarkers, click chemistry, cell-surface proteins, glycoproteins, pancreatic cancer, proteomic profiling
Abbreviations
- BCA
Bicinchoninic acid
- CD20
Cluster of Differentiation 20
- NT5E/CD73
Ecto-5′-nucleotidase
- GPI
Glycosylphosphatidylinositol
- ManNAc
N-acetyl-D-mannosamine
- ManNAz
N-azidoacetylmannosamine
- MS
Mass spectrometry
- NSAF
Normalized Spectral Abundance Factor
- PaC
Pancreatic cancer
- PBS
Phosphate-buffered saline
- PDAC
Pancreatic ductal adenocarcinoma
Introduction
Pancreatic cancer (PaC) is the fourth most common cause of cancer-related deaths in the United States,1 and is projected to be the second leading cause of cancer-related death by 2030.2 Detection is normally observed only in late stages of the disease; thus, prognosis of patients upon diagnosis is extremely poor. Currently, the treatment for metastatic pancreatic cancer is with gemcitabine and nab-paclitaxel (median survival 8.5 months) and FOLFIRINOX (median survival 11.1 months).3-4 Due to the overall poor clinical performance of these treatments, it is clear that novel treatment strategies are needed for pancreatic cancer.
For decades, medical treatment for cancer has been focused on systemic intravenous cytotoxic chemotherapy. These drugs target rapidly dividing cancer cells as well as cells of certain normal tissues like hair and the lining of the gastrointestinal tract, which leads to undesirable side effects. Although traditional cytotoxic chemotherapy remains the treatment of choice for many malignancies, including pancreatic cancer, a shift toward targeted cancer therapy has become more prevalent.5 These targeted therapies are now used for the treatment of many types of cancer, including breast cancer and lymphoma. Some of the molecular targets of these therapies may be present in normal tissues, but they are often mutated or overexpressed in tumors.5 Among the earliest targeted therapies were antibodies directed against cluster of differentiation 20 (CD20), a cell-surface marker that is present on lymphoma and leukemia cells. Thus, an engineered chimeric monoclonal antibody, rituximab (Rituxan), is now used for the treatment of non-Hodgkin's lymphoma.5 Similarly, approximately 20% of breast cancers carry an excessive number of HER2 receptors on their cell surfaces, and breast cancers with this characteristic tend to be among the most aggressive types. Targeting this cell-surface receptor with a monoclonal antibody, trastuzumab (Herceptin), has thus proven to be a clinically useful adjuvant treatment of HER2-positive breast cancer. Currently, our knowledge of the cell-surface proteins upregulated in pancreatic tumors is severely limited, thus impeding the development of similar targeted therapies for pancreatic cancer.
To develop new diagnostic and therapeutic tools to specifically target pancreatic tumors, we sought to identify cell-surface proteins that may serve as potential tumor-specific targets. Since MS-based proteomics permit sensitive identification and quantification of large numbers of peptides or proteins, novel approaches have been developed to identify the cell-surface proteome by quantitative MS, including lectin-based methods, cell surface shaving, 2-phase separation, and antibody-mediated membrane enrichment.6 Recently, a novel technique has been developed by Bertozzi and coworkers that utilizes modified sugars containing an azide moiety for metabolic labeling of glycoproteins in living cells.7-8 Based on the Staudinger ligation, azide-containing structures can be covalently attached to phosphine-labeled reporters in a highly specific reaction.8 Since neither phosphine nor azide occurs naturally in biomolecules, this approach is particularly suited for complex biological systems, including living cells and organisms. We have modified the glycan metabolic labeling technique9-10 by introducing a thiol-cleavable biotin conjugate in the click-chemistry reaction that provides robust capture-and-release of the glycoproteins and enhances their recovery for subsequent SDS-PAGE separation and MS-based analysis. In this report, we have successfully employed this modified procedure to identify cell-surface glycoproteins in living pancreatic cancer cell lines, and demonstrated that ecto-5′-nucleotidase (NT5E/CD73) is overexpressed in pancreatic ductal adenocarcinomas (PDAC).
Results
Cell-selective labeling using azido-bioorthogonal chemical reporters
To examine the selectivity of the metabolic labeling procedure, equal amounts of protein lysates from MIAPaCa-2 cells grown in the presence of either a control sugar (ManNAc) or azido sugar (ManNAz) were separated by SDS-PAGE, transferred to PVDF membrane, incubated with HRP-conjugated neutravidin, and biotinylated proteins were visualized by chemiluminescence (Fig. 1). Biotinylated proteins were detected across the entire molecular weight range in the azido-sugar sample (Fig. 1, Az), however, no proteins were detected in the control-sugar sample (Fig. 1, Ac).
Figure 1.

HRP-neutravidin detection of biotinylated proteins in MIAPaCa-2 cell lysates. Cell lysates prepared from MIAPaCa-2 cells grown in the presence of either a control sugar (Ac) or azido sugar (Az) were separated by SDS-PAGE, transferred to PVDF membrane, incubated with HRP-conjugated neutravidin, and biotinylated proteins were visualized by chemiluminescence. Molecular weights (kDa) of the protein standards are indicated on the left.
A thiol-cleavable biotin conjugate enhances protein recovery
To identify cell-surface proteins on pancreatic cancer cells, we employed the metabolic labeling procedure with 3 pancreatic cell lines: BxPC-3, MIAPaCa-2, and Panc-1. Initially, we used a non-cleavable biotinylation reagent (phosphine-PEG3-biotin) for labeling the azide-containing glycoproteins, which resulted in the identification of 958 unique proteins by MS/MS analysis of samples prepared from BxPC-3 cells. Although the biotin-streptavidin system provides a specific and strong interaction, which is ideal for affinity purification, breaking this interaction requires harsh conditions to release the captured biotinylated proteins.11 The harsh conditions required are not very efficient and lead to deterioration of samples during release, both of which adversely affect downstream applications including MS-based analyses. To overcome this problem, we introduced a thiol-cleavable biotin conjugate (DBCO-S-S-PEG3-biotin) in the click chemistry reaction of the MIAPaCa-2 and Panc-1 sample preparations. This resulted in the identification of 2008 and 2327 unique proteins in the samples, respectively, thus providing a more robust capture-and-release of the glycoproteins and enhanced protein recovery for subsequent MS-based analysis compared with the samples prepared using the non-cleavable biotinylation reagent.
Identification of cell-surface glycoproteins in pancreatic cancer cell lines
MS/MS analysis of peptides from the biotin-labeled cell-surface proteins in the 3 pancreatic cancer cell lines revealed 954 unique proteins in the azido-sugar samples that had a relative abundance more than threefold above the control-sugar samples. A comparison of the proteins identified in each sample indicated that 20% of these proteins were present in 2 cell lines (193 of 954 proteins) and 17 of the proteins were found in all 3 cell lines examined (Table 1). Consistent with the desired capture of glycoproteins, 16 of the 17 proteins identified in all 3 cell lines are known or predicted to be membrane proteins or proteins that would have transited through the Golgi apparatus and been candidates for N-linked glycosylation. Similarly, 13 of the membrane proteins identified have been reported to be localized to the plasma membrane. These results further support the utility of using the metabolic labeling procedure to capture and identify cell-surface proteins from living cells.
Table 1.
Summary of proteins identified in 3 cell lines
| BxPC-3 |
MIAPaCa-2 |
Panc-1 |
|||||||||||||
|---|---|---|---|---|---|---|---|---|---|---|---|---|---|---|---|
| UniProtID | GeneSymbol | AltName | Name | Locationa | Membrane Organizationb | Acc | Azd | FCe | Ac | Az | FC | Ac | Az | FC | PCDf |
| P35613 | BSG | CD147, EMMPRIN | Basigin | PM | Type I | 0 | 14 | 4.8 | 0 | 472 | 8.6 | 0 | 213 | 7.3 | Y |
| P21589 | NT5E | CD73 | 5′-nucleotidase | PM | GPI | 0 | 6 | 4.0 | 0 | 235 | 7.9 | 6 | 80 | 2.2 | N |
| P26006 | ITGA3 | CD49c | Integrin α-3 | PM | Type I | 0 | 20 | 5.2 | 0 | 197 | 7.7 | 6 | 157 | 2.9 | Y |
| O00592 | PODXL | PCLP | Podocalyxin | PM | Type I | 0 | 23 | 5.3 | 0 | 170 | 7.5 | 0 | 9 | 4.2 | Y |
| Q15758 | SLC1A5 | Neutral amino acid transporter B(0) | PM | Multipass | 1 | 18 | 2.7 | 0 | 129 | 7.3 | 7 | 91 | 2.2 | N | |
| P23229 | ITGA6 | CD49f | Integrin α-6 | PM | Type I | 0 | 13 | 4.8 | 0 | 108 | 7.1 | 11 | 125 | 2.1 | Y |
| P08648 | ITGA5 | CD49e | Integrin α-5 | PM | Type I | 0 | 3 | 3.3 | 0 | 72 | 6.7 | 0 | 69 | 6.2 | Y |
| P05556 | ITGB1 | CD29 | Integrin β-1 | PM | Type I | 0 | 69 | 6.4 | 15 | 326 | 3.2 | 51 | 533 | 2.0 | Y |
| Q10471 | GALNT2 | Polypeptide N-acetylgalactosaminyl transferase 2 | Golgi | Type II | 1 | 4 | 1.2 | 0 | 35 | 6.0 | 1 | 39 | 3.2 | Y | |
| P16070 | CD44 | CD44 antigen | PM | Type I | 0 | 18 | 5.1 | 14 | 1354 | 4.7 | 1 | 578 | 5.9 | Y | |
| Q14126 | DSG2 | CDHF5 | Desmoglein-2 | PM | Type I | 0 | 29 | 5.6 | 0 | 31 | 5.8 | 1 | 33 | 3.1 | Y* |
| Q9BRK5 | SDF4 | CAB45 | 45 kDa calcium-binding protein | Golgi | 0 | 3 | 3.3 | 0 | 26 | 5.7 | 1 | 19 | 2.5 | Y | |
| P11279 | LAMP1 | CD107a | Lysosome-associated membrane glycoprotein 1 | PM | Type I | 0 | 8 | 4.3 | 2 | 16 | 2.1 | 0 | 28 | 5.3 | N |
| O00214 | LGALS8 | Galectin-8 | Secreted | 0 | 2 | 2.9 | 4 | 74 | 3.0 | 0 | 20 | 5.0 | N | ||
| P16144 | ITGB4 | CD104 | Integrin β-4 | PM | Type I | 2 | 24 | 2.3 | 4 | 48 | 2.6 | 0 | 16 | 4.8 | Y |
| P00533 | EGFR | HER1 | Epidermal growth factor receptor | PM | Type I | 3 | 12 | 1.2 | 7 | 352 | 4.0 | 48 | 477 | 2.0 | Y |
| O15118 | NPC1 | Niemann-Pick C1 protein | Late endo | Multipass | 0 | 3 | 3.3 | 1 | 35 | 3.6 | 7 | 47 | 1.6 | N | |
PM – Plasma membrane, Late endo – Late endosome.
Type I – Type I membrane protein, Type II – Type II membrane protein, Multipass – Multipass membrane protein, GPI – GPI-anchored membrane protein.
Spectral count in control-labeled sugar (ManNAc).
Spectral count in azido-labeled sugar (ManNAz).
ln(fold change Az/Ac).
Reported in Pancreatic Cancer Database (pancreaticcancerdatabase.org).
reported as decreased in pancreatic ductal adenocarcinoma.
As noted above, using a thiol-cleavable biotin conjugate during the processing of the MIAPaCa-2 and Panc-1 cells enhanced the recovery and number of proteins identified by GeLC-MS/MS. Further, a comparison of the proteins identified in these 2 cell lines revealed 181 proteins in common, compared with only 20 and 26 proteins shared between BxPC-3 and MIAPaCa-2 and Panc-1 cells, respectively. This discrepancy is likely due to the poorer recovery of proteins from the BxPC-3 cell preparation with the non-cleavable biotin reagent rather than a difference in the cell-surface proteins residing on BxPC-3 cells, which further illustrates the benefits of using the cleavable conjugate.
NT5E is expressed in all pancreatic cancer cell lines examined
Since we detected NT5E in all 3 pancreatic cancer cell lines by GeLC-MS/MS analysis, we sought to determine if it was similarly expressed in other pancreatic cancer cell lines by western blot analysis. Total cell lysates prepared from 8 pancreatic cancer cell lines were resolved by SDS-PAGE and the expression of NT5E was evaluated using an anti-NT5E antibody (Fig. 2). NT5E was detected in each of the 8 cell lines, with lower levels of protein detected in BxPC-3, Capan-1, and HPAF-I cells and higher levels of protein in the other 5 cell lines. The western blot results (Fig. 2) were consistent with the spectral counts obtained by GeLC-MS/MS analysis (Table S1), namely, a low level of NT5E was detected in BxPC-3 cells, while higher levels were observed in Panc-1 and MIAPaCa-2 cells.
Figure 2.
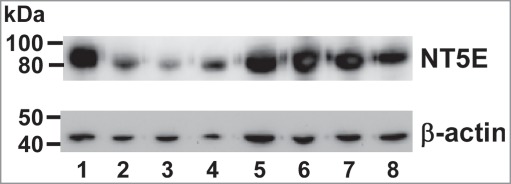
Ecto-5′-nucleotidase (NT5E) is expressed in pancreatic cancer cell lines. Western blot showing the endogenous expression of NT5E in various human pancreatic cancer cell lines. Lane 1: AsPC-1; Lane 2: BxPC-3; Lane 3: Capan-1; Lane 4: HPAF-1; Lane 5: Hs766T; Lane 6: MiaPaCa-2; Lane 7: Panc-1; Lane 8: Suit-2. In each lane, 20 µg of total cell lysate was loaded and detected with anti-NT5E antibody (upper panel). The same blot was stripped and re-probed for β-actin showing the loading control (lower panel). Molecular weights (kDa) of the protein standards are indicated on the left.
NT5E is overexpressed in human pancreatic ductal adenocarcinomas
To examine NT5E expression in pancreas tissues, IHC was performed on 19 tissue sections with PDAC and 12 sections with normal pancreas tissue. NT5E expression was significantly higher in the PDAC specimens compared with normal pancreas tissue sections (Fig. 3). High cytoplasmic staining was detected in 11 of 19 PDAC specimens (Fig. 4A), while only 3 of 12 normal pancreas tissues exhibited high expression – primarily associated with Islets cells (Fig. 4C). Interestingly, 5 of the 8 PDAC specimens designated as Low staining displayed intense focal luminal staining (Fig. 4B), while only 2 of the normal pancreas tissues categorized as Low exhibited High luminal staining (Fig. 4D). Thus, there was a much stronger overall pattern of expression in the benign and malignant lumen in cases that had cancer. In the benign samples there was staining, but it was much more patchy and weak. The potential clinical importance of NT5E overexpression in pancreatic tumors is highlighted by recent studies that suggest NT5E may be a target for cancer immunotherapy (reviewed in ref 12).
Figure 3.

Ecto-5′-nucleotidase (NT5E) is significantly overexpressed in pancreatic ductal adenocarcinoma compared to normal pancreas tissue. Intensity and distribution of cytoplasmic and luminal staining for NT5E was evaluated in sections of pancreatic ductal adenocarcinoma (PDAC, n = 19) and normal pancreas (n = 12) tissue samples (see Methods). The combined IHC score (cytoplasmic + luminal) determined for each sample is depicted along with the median score and interquartile range for each group (horizontal bars). Two PDAC specimens did not contain luminal features, and their combined IHC scores were consequently right censored at the value of their cytoplasmic composite score (open circles). The score difference between the groups was assessed for statistical significance at P<0.05 via 2-sided Wilcoxon test for right-censored data.
Figure 4.
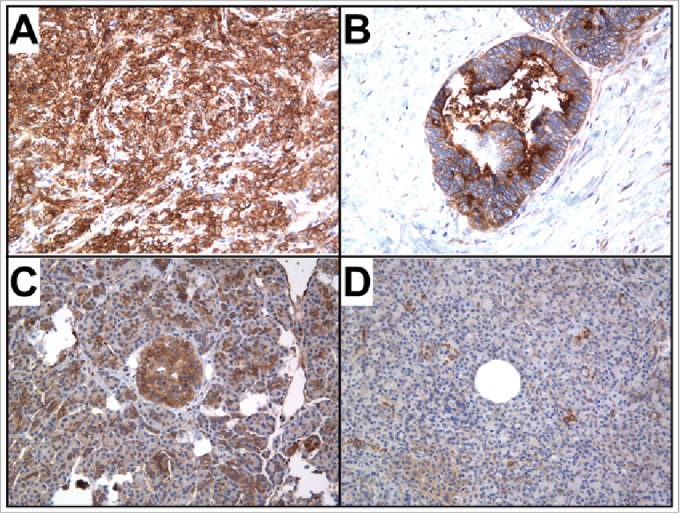
Representative pancreatic tissues sections stained for NT5E. (A) High NT5E cytoplasmic staining was observed in 11 of 19 PDAC sections, (B) while 5 of 8 PDAC sections with Low cytoplasmic exhibited intense focal luminal staining. (C) Three of 12 normal pancreas tissue sections exhibited High cytoplasmic NT5E staining, concentrated primarily in the Islet cells, and (D) only scattered positive NT5E staining was observed in the 9 Low NT5E staining normal pancreas sections, with only 2 exhibiting focal luminal staining in the ducts. Magnification 200x.
Discussion
Numerous gene profiling studies, including our own,13 have been performed to identify genes differentially expressed in pancreatic tumors and cell lines.14-30 Although these studies have certainly increased our understanding of molecular pathways activated or suppressed in pancreatic adenocarcinomas, transcription analyses do not necessarily correlate with protein abundance, and thus provide only an indirect measure of alterations in protein levels.31 Furthermore, the ability to identify cell-surface-resident proteins in these studies is indirect and highly dependent upon the quality of the gene annotation data associated with the bioinformatic analyses, and may not adequately reflect the proteins displayed on the cell surface. Recently, advances in mass spectrometry (MS)-based methods have provided a direct means to protein-profile pancreatic tumors, cell lines, and bodily fluids [reviewed in ref 32], as well as the secretome of pancreatic cell lines.33 In spite of these efforts, a significant deficit remains in our knowledge of the identity of cell-surface markers that are upregulated in pancreatic tumors. Since a compendium of such molecular targets is vital for the development of novel targeted therapies, we utilized a bioorthogonal chemical reporter to metabolically label N-linked sialoglycoproteins on the surface of 3 pancreatic cancer cell lines followed by attachment of a biotinylated affinity probe using copper-free click chemistry. Cell-surface glycoproteins were thereby selectively enriched and identified from among highly abundant proteins present in the cellular proteome.
In this study we examined the cell-surface glycoproteome of cultured cell lines derived from pancreatic cancers as surrogates for human tumors, similar to the strategy employed for biomarker discovery of the pancreatic cancer secretome.33 The use of cultured cell lines provides a means to employ metabolic labeling with bioorthogonal chemical reporters specifically to capture cell-surface glycoproteins, a task that is not feasible using tissue samples. Since cultured cell lines only serve as models of human tumors, we have analyzed 3 different cell lines in an attempt to catalog cell-surface markers that accurately reflect the proteins displayed on tumors.
The expression of several of the cell-surface glycoproteins identified in all 3 cell lines has been appreciated for some time in pancreatic cancer through DNA microarray or proteomic profiling, RT-PCR expression analysis, or immunohistochemistry, including basigin (BSG/EMMPRIN/CD147),34-36 CD44,14,37-39 EGFR,40-42 and 5 integrins – ITGA3, ITGA5, ITGA6, ITGB1, and ITGB4.17,22,33,43-45 It is particularly noteworthy that basigin-targeted therapy46 and EGFR-targeted therapy (reviewed in ref 47) have been investigated for pancreatic cancer, underscoring the importance of identifying novel cell-surface proteins as potential targets for pancreatic cancer therapy.
The ability to identify pancreatic cancer cell-surface proteins is further highlighted by the detection of ecto-5′-nucleotidase (NT5E/CD73) in the 3 pancreatic cancer cell lines (Table 1). NT5E is a glycosylphosphatidylinositol (GPI)-anchored ecto-enzyme that catalyzes the conversion of extracellular nucleotides to membrane-permeable nucleosides. It has been reported to be overexpressed in several solid tumors including breast,48-49 ovarian,50 and endometrial51 cancer. NT5E was also purified and characterized from a human pancreatic cancer cell line, PaTu II, and its immunolocalization to the plasma membrane in both cultured cells and normal human pancreatic tissue was verified using monoclonal antibodies prepared using the purified protein.52-53 Using DNA microarrays, the NT5E transcript has been identified both in pancreatic cancer cell lines, including BxPC-3 and MIAPaCa-2, and PDAC specimens;17,25 however, its expression in human pancreatic tumor specimens by IHC had not been previously examined. Following its identification in this study by GeLC-MS/MS in 3 pancreatic cancer cell lines, we have verified its expression by western blot in 5 additional pancreatic cancer cell lines. Further, we have demonstrated that it is overexpressed in human PDAC tissue specimens compared with normal pancreas tissue. Of particular importance to its expression in tumors is the NT5E-mediated production of adenosine from AMP, which has been implicated in tumor-associated immunosuppression.54
Our profiling studies also revealed additional potential cell-surface targets such as neutral amino-acid transporter B(0) (SLC1A5), lysosome-associated membrane protein glycoprotein 1 (LAMP1), galectin-8 (LGALS8), and Niemman-Pick C1 protein (NPC1), whose expression have not been thoroughly examined in pancreatic cancer (Table 1). Although we utilized an enrichment strategy to detect N-linked glycoproteins metabolically labeled with an azido sugar moiety, proteins lacking an N-linked glycosylation motif, such as galectin-8, were also identified. Although galectin-8 itself has not been reported to be glycosylated, it contains 2 carbohydrate recognition domains and has been shown to bind to a subset of cell-surface glycoproteins of the integrin family;55-56 thus, it may have been captured indirectly via its association with glycoproteins that were azido-labeled.
Previously we have used cell-surface capture6,57,58 to analyze the cell-surface glycoproteome of BxPC-3 cells.59 In this procedure, membrane glycoproteins are labeled with a bi-functional biocytin hydrazide linker prior to streptavidin capture of biotinylated glycopeptides.6,57,58 In the current study, using metabolic labeling to capture glycoproteins, we identified 8 proteins that were also found by cell-surface capture, including BSG, ITGA3, SLC1A5, ITGB1, and DSG2 that were found to be expressed in MIAPaCa-2 and Panc-1 cells (Table 1). Between these 2 different approaches for identifying cell-surface glycoproteins, we found the metabolic labeling procedure to be far superior based on the number of proteins identified by each method as well as in the reduction in manipulations required prior to MS analysis. Further, the cell-surface capture procedure is reliant solely on the MS identification of the glycopeptides released by endoglycosidase cleavage following streptavidin capture, whereas the metabolic labeling procedure enables identification of peptides derived from the entire captured glycoprotein following trypsin (or other proteolytic) digestion. Intuitively, this should enhance both the total number of peptides analyzed as well as the confidence in the protein identifications obtained by MS analysis.
In an effort to detect cell-surface proteins that may be used to target pancreatic tumors for diagnostic and therapeutic purposes, we have used a bioorthogonal chemical reporter to selectively enrich and identify sialoglycoproteins expressed on pancreatic cancer cell lines. By comparing the resulting glycoprotein profiles among 3 pancreatic cancer cell lines, we have identified cell-surface proteins that have been previously reported to be overexpressed in PDAC as well as novel glycoprotein targets. Additional glycoproteins may be revealed through the use of other azido-labeled metabolic precursors (e.g., N-azidoacetylgalactosamine to label O-linked glycoproteins). Similarly, profiling additional pancreatic cancer cell lines may identify proteins excluded in the current study that were only present in one of the 3 cell lines examined.
Materials and Methods
Cell lines and cell culture
Pancreatic cancer cell lines BxPC-3 (ATCC, CRL-1687), MIAPaCa-2 (ATCC, CRL-1420), and Panc-1 (CRL-1469) were obtained from the American Type Culture Collection. Cells were maintained in Dulbecco's Modified Eagle's Medium (Mediatech, 10–017-CV) supplemented with 10% fetal bovine serum (Atlanta Biologicals, S11150) at 37°C in a 5% CO2/air environment.
Metabolic labeling cells
For each cell line, 4 10-cm dishes were seeded with cells (106/dish) in growth medium. The following day, 10 mM N-azidoacetylmannosamine-tetraacylated prepared in DMSO (Ac4ManNAz, Thermo Fisher Scientific, 88904) was added to 2 dishes of cells to yield a final concentration of 50 µM azido sugar. The remaining 2 dishes received 10 mM N-acetyl-D-mannosamine (Sigma-Aldrich, A8176) as a control. After 72 h, the cells were washed twice with phosphate-buffered saline (PBS) then treated with culture medium containing 200 µM of either EZ-Link Phosphine-PEG3-Biotin (Thermo Fisher Scientific, 88901) or DBCO-S-S-PEG3-Biotin (Click Chemistry Tools, A112) conjugate suspended in DMSO to selectively tag glycoproteins on the surface of live cells. After four hours, the cells were washed twice with PBS, PBS containing 1 mM EDTA was added to the plates, and the cells were harvested by scraping. The cell suspensions from each sample (azido sugar or control sugar) were pooled, collected by centrifugation, washed twice with PBS, and lysed with RIPA buffer (1 mM EDTA, 1% NP-40, 0.5% deoxycholate, 0.1% SDS in PBS) followed by sonication.
Western blot
The protein concentration of each lysate was determined by bicinchoninic acid (BCA) assay (Sigma-Aldrich, BCA-1). To detect biotin-labeled proteins, equal amounts of each sample (10 µg of total protein) were separated by gel electrophoresis (in the absence of reducing reagent when the thiol-cleavable linker was used) using 4–12% gradient Bis-Tris NuPage gels (Life Technologies, NP0321) and transferred to a PVDF membrane. The membrane was blocked with a 5% non-fat milk solution in PBS, pH 7.4, containing 0.1% Tween-20 (PBST) then incubated overnight at 4°C with Pierce High Sensitivity NeutrAvidin-HRP (Thermo Fisher Scientific, 31030) diluted 1:10,000 with 2% non-fat milk/PBST. After washing with PBST, the biotinylated proteins were visualized by chemiluminescence using ECL plus reagent (GE Healthcare, RPN2133) and a ChemiDoc XRS image documentation system and Quantity One analysis software (Bio-Rad).
To detect NT5E in pancreatic cancer cell line lysates, equal amounts (20 µg) of each total cell lysate was separated using a 4–12% gradient Bis-Tris NuPage gel, transferred to PVDF membrane, and blocked with 5% non-fat milk solution for 1h at room temperature. The blot was incubated with a polyclonal sheep anti-NT5E antibody (R&D Systems, AF5795) at a dilution of 1:500 at 4°C overnight on a rocking platform. The blot was washed 3 times with 1x Tris-buffered saline containing 0.1% Tween-20 (TBST) and subsequently incubated with donkey anti-sheep HRP-conjugated secondary antibody (Santa Cruz, sc-2473) for 1h at a dilution of 1:5000 at room temperature. The blot was washed 3 times with TBST and incubated with Luminata Forte Western HRP substrate (Millipore, WBLUF0100) for 5 min and the signal was detected with a Bio-Rad imaging station. To determine the loading control, the blot was stripped and blocked with 5% non-fat milk solution for 1h and incubated with anti-β-actin mouse monoclonal antibody (Santa Cruz Biotechnology, sc-47778) in 5% non-fat milk solution for 1h at room temperature and the signal was detected after incubating with HRP-conjugated goat-anti-mouse antibody (Santa Cruz Biotechnology, sc-2005).
Mass spectrometry
The protein concentration was determined by BCA assay, and equal amounts of protein from each sample (azido sugar or control sugar) were mixed overnight with streptavidin-coupled magnetic beads (Life Technologies, Dynabeads streptavidin M-280) pretreated with Pierce protein-free T20 (PBS) blocking buffer (Thermo Fisher Scientific, 37573). After extensive washing in RIPA buffer, the captured proteins were released in SDS-PAGE sample buffer containing thiol, resolved on 4–12% Bis-Tris NuPAGE gels, and stained with SimplyBlue SafeStain (Life Technologies, LC6060). For GeLC-MS/MS analysis, each gel lane was cut into 23 equal sections and subjected to in-gel trypsin digestion. 60 Peptides were analyzed by nanoflow LC-MS/MS with a Thermo Orbitrap Velos mass spectrometer equipped with a Waters nanoACQUITY LC system. 61-62 Specifically, high resolution/accurate mass spectra of intact peptides were collected with the Orbitrap mass analyzer, while tandem mass spectra of fragmented peptides were rapidly collected with the linear ion trap. Proteins were identified from MS/MS spectra by database searching using the Mascot search engine (Matrix Science, on-site license) with a peptide mass tolerance of 2 ppm, fragment mass tolerance of ±0.5 Da, a maximum of 2 missed tryptic cleavages, and fixed carbamidomethylation of cysteine modification and variable deamidation and oxidation modifications. The Mascot results were uploaded into Scaffold 4 for viewing the proteins and peptide information. A protein false discovery rate of 1% was used as the cutoff value, and spectral counts were exported into an Excel spreadsheet for quantitative analysis.
Quantitative analysis of protein levels
The relative amount of proteins identified by GeLC-MS/MS was determined by calculating a Normalized Spectral Abundance Factor (NSAF).63-64 Prior to log transformation, the entire spectral data set was shifted by adding 0.1 to every value to account for proteins with spectral counts of zero in some samples. To reduce further analysis of background proteins, the list of proteins identified in each cell line was filtered to include only proteins identified in the azido-labeled samples that had an NSAF at least threefold higher than the control sugar sample. Proteins were also excluded that had less than 5 spectral counts in at least one sample examined.
Immunohistochemistry
Formalin-fixed, paraffin-embedded tissue blocks from 12 non-malignant pancreas and 19 pancreatic adenocarcinoma tissues were prepared for immunohistochemical analysis. Representative hematoxylin and eosin-stained sections from each tissue were evaluated by microscopic analysis. Sections (4 µm) were deparaffinized and rehydrated in xylene followed by graded ethanol. Antigen retrieval was performed in a pressure cooker using 10 mM citrate, pH 6.0, for 20 minutes. Endogenous peroxidase activity was quenched by hydrogen peroxide treatment followed by serum-free protein block (DakoCytomation, X0909). Sections were incubated with a rabbit anti-NT5E antibody (Sigma-Aldrich, HPA017357), diluted 1:1500 in antibody diluent (DakoCytomation, S0809), overnight at 4°C. Immunoreactive staining was detected using a DAKO LSAB+ peroxidase system (DakoCytomation, K0679) followed by hematoxylin 2 counterstain (Richard-Allen Scientific, 7231). The cytoplasmic and luminal staining intensity for the NT5E protein and the percentage of positive cells in each location was scored by a pathologist (CMQ), and a composite score for each cellular location was calculated as follows. The staining intensity for the NT5E protein was assigned a score from 0 to 3 based on staining, with 0 indicating no staining; 1+, weakly positive; 2+, moderately positive; and 3+, strongly positive. The percentage of positive cells was scored as: 0, no positive cells; 1+, 1–25% positive cells; 2+, 26–50% positive cells; 3+, 51–75% positive cells; 4+, >75% positive cells. The composite score was calculated as the product of the staining-intensity score and the positive-percentage score, and thus ranged from 0 to 12. Staining with composite scores < 6 was categorized as Low, while staining ≥ 6 was categorized as High. The acquisition and use of archived, paraffin-embedded human tissue samples in this study were reviewed and approved by the UAMS Human Research Advisory Committee.
Statistical analysis
Each sample's cytoplasmic and luminal composite scores were added together to yield a combined IHC score. If a sample's luminal features were missing, its combined IHC score was considered to be right-censored at the value of its cytoplasmic composite score. The PDAC and Normal samples were compared statistically at a P<0.05 significance level for the group difference in combined IHC scores via 2-sided Wilcoxon test, a generalization of the Mann-Whitney U test to right-censored data. All statistical analysis employed Prism 6 (GraphPad Software, Inc., La Jolla, CA USA) and SAS v9.3 (The SAS Institute, Cary, NC).
Disclosure of Potential Conflicts of Interest
No potential conflicts of interest were disclosed.
Acknowledgments
The authors thank Sheyda Najafi for assistance with literature searches of the proteins identified by cell-surface labeling.
Supplemental Material
Supplemental data for this article can be accessed on the publisher's website.
Funding
This work was supported in part by the Department of Veterans Affairs, Veterans Health Administration, Office of Research and Development, Biomedical Laboratory Research and Development, VA Merit Award 01BX000828 (RSH), and National Institutes of Health grants R01GM106024 (AJT), R33CA173264 (AJT), UL1RR029884, P30GM103450, P20GM103429, and P20GM103625. The mass spectrometric analysis was supported by the UAMS Proteomics Core.
References
- 1.Siegel R, Ma J, Zou Z, Jemal A. Cancer statistics, 2014. CA Cancer J Clin 2014; 64:9-29; PMID:24399786; http://dx.doi.org/ 10.3322/caac.21208 [DOI] [PubMed] [Google Scholar]
- 2.Rahib L, Smith BD, Aizenberg R, Rosenzweig AB, Fleshman JM, Matrisian LM. Projecting cancer incidence and deaths to 2030: the unexpected burden of thyroid, liver, and pancreas cancers in the United States. Cancer Res 2014; 74:2913-21; PMID:24840647; http://dx.doi.org/ 10.1158/0008-5472.CAN-14-0155 [DOI] [PubMed] [Google Scholar]
- 3.Conroy T, Desseigne F, Ychou M, Bouche O, Guimbaud R, Becouarn Y, Adenis A, Raoul JL, Gourgou-Bourgade S, de la Fouchardière C, et al.. FOLFIRINOX versus gemcitabine for metastatic pancreatic cancer. N Engl J Med 2011; 364:1817-25; PMID:21561347; http://dx.doi.org/ 10.1056/NEJMoa1011923 [DOI] [PubMed] [Google Scholar]
- 4.Von Hoff DD, Ervin T, Arena FP, Chiorean EG, Infante J, Moore M, Seay T, Tjulandin SA, Ma WW, Saleh MN, et al.. Increased survival in pancreatic cancer with nab-paclitaxel plus gemcitabine. N Engl J Med 2013; 369:1691-703; PMID:24131140; http://dx.doi.org/ 10.1056/NEJMoa1304369 [DOI] [PMC free article] [PubMed] [Google Scholar]
- 5.Gerber DE. Targeted therapies: a new generation of cancer treatments. Am Fam Physician 2008; 77:311-9; PMID:18297955 [PubMed] [Google Scholar]
- 6.Wollscheid B, Bausch-Fluck D, Henderson C, O'Brien R, Bibel M, Schiess R, Aebersold R, Watts JD. Mass-spectrometric identification and relative quantification of N-linked cell surface glycoproteins. Nat Biotechnol 2009; 27:378-86; PMID:19349973; http://dx.doi.org/ 10.1038/nbt.1532 [DOI] [PMC free article] [PubMed] [Google Scholar]
- 7.Agard NJ, Bertozzi CR. Chemical approaches to perturb, profile, and perceive glycans. Acc Chem Res 2009; 42:788-97; PMID:19361192; http://dx.doi.org/ 10.1021/ar800267j [DOI] [PMC free article] [PubMed] [Google Scholar]
- 8.Vocadlo DJ, Hang HC, Kim EJ, Hanover JA, Bertozzi CR. A chemical approach for identifying O-GlcNAc-modified proteins in cells. Proc Natl Acad Sci U S A 2003; 100:9116-21; PMID:12874386; http://dx.doi.org/ 10.1073/pnas.1632821100 [DOI] [PMC free article] [PubMed] [Google Scholar]
- 9.Hubbard SC, Boyce M, McVaugh CT, Peehl DM, Bertozzi CR. Cell surface glycoproteomic analysis of prostate cancer-derived PC-3 cells. Bioorg Med Chem Lett 2011; 21:4945-50; PMID:21798741; http://dx.doi.org/ 10.1016/j.bmcl.2011.05.045 [DOI] [PMC free article] [PubMed] [Google Scholar]
- 10.Yang L, Nyalwidhe JO, Guo S, Drake RR, Semmes OJ. Targeted identification of metastasis-associated cell-surface sialoglycoproteins in prostate cancer. Mol Cell Proteomics 2011; 10:M110 007294. [DOI] [PMC free article] [PubMed] [Google Scholar]
- 11.Holmberg A, Blomstergren A, Nord O, Lukacs M, Lundeberg J, Uhlen M. The biotin-streptavidin interaction can be reversibly broken using water at elevated temperatures. Electrophoresis 2005; 26:501-10; PMID:15690449; http://dx.doi.org/ 10.1002/elps.200410070 [DOI] [PubMed] [Google Scholar]
- 12.Zhang B. CD73: a novel target for cancer immunotherapy. Cancer Res 2010; 70:6407-11; PMID:20682793; http://dx.doi.org/ 10.1158/0008-5472.CAN-10-1544 [DOI] [PMC free article] [PubMed] [Google Scholar]
- 13.Johnson SK, Dennis RA, Barone GW, Lamps LW, Haun RS. Differential Expression of Insulin Growth Factor Binding Protein 5 in Pancreatic Adenocarcinomas: Identification Using DNA Microarray. Mol Carcinog 2006; 45:814-27; PMID:16865675; http://dx.doi.org/ 10.1002/mc.20203 [DOI] [PubMed] [Google Scholar]
- 14.Iacobuzio-Donahue CA, Maitra A, Shen-Ong GL, van Heek T, Ashfaq R, Meyer R, Walter K, Berg K, Hollingsworth MA, Cameron JL, et al.. Discovery of Novel Tumor Markers of Pancreatic Cancer using Global Gene Expression Technology. Am J Pathol 2002; 160:1239-49; PMID:11943709; http://dx.doi.org/ 10.1016/S0002-9440(10)62551-5 [DOI] [PMC free article] [PubMed] [Google Scholar]
- 15.Iacobuzio-Donahue CA, Ryu B, Hruban RH, Kern SE. Exploring the Host Desmoplastic Response to Pancreatic Carcinoma : Gene Expression of Stromal and Neoplastic Cells at the Site of Primary Invasion. Am J Pathol 2002; 160:91-9; PMID:11786403; http://dx.doi.org/ 10.1016/S0002-9440(10)64353-2 [DOI] [PMC free article] [PubMed] [Google Scholar]
- 16.Han H, Bearss DJ, Browne LW, Calaluce R, Nagle RB, Von Hoff DD. Identification of Differentially Expressed Genes in Pancreatic Cancer Cells Using cDNA Microarray. Cancer Res 2002; 62:2890-6; PMID:12019169 [PubMed] [Google Scholar]
- 17.Logsdon CD, Simeone DM, Binkley C, Arumugam T, Greenson JK, Giordano TJ, Misek DE, Kuick R, Hanash S. Molecular Profiling of Pancreatic Adenocarcinoma and Chronic Pancreatitis Identifies Multiple Genes Differentially Regulated in Pancreatic Cancer. Cancer Res 2003; 63:2649-57; PMID:12750293 [PubMed] [Google Scholar]
- 18.Iacobuzio-Donahue CA, Ashfaq R, Maitra A, Adsay NV, Shen-Ong GL, Berg K, Hollingsworth MA, Cameron JL, Yeo CJ, Kern SE, et al.. Highly expressed genes in pancreatic ductal adenocarcinomas: a comprehensive characterization and comparison of the transcription profiles obtained from three major technologies. Cancer Res 2003; 63:8614-22; PMID:14695172 [PubMed] [Google Scholar]
- 19.Crnogorac-Jurcevic T, Efthimiou E, Nielsen T, Loader J, Terris B, Stamp G, Baron A, Scarpa A, Lemoine NR. Expression profiling of microdissected pancreatic adenocarcinomas. Oncogene 2002; 21:4587-94; PMID:12085237; http://dx.doi.org/ 10.1038/sj.onc.1205570 [DOI] [PubMed] [Google Scholar]
- 20.Crnogorac-Jurcevic T, Missiaglia E, Blaveri E, Gangeswaran R, Jones M, Terris B, Costello E, Neoptolemos JP, Lemoine NR. Molecular alterations in pancreatic carcinoma: expression profiling shows that dysregulated expression of S100 genes is highly prevalent. J Pathol 2003; 201:63-74; PMID:12950018; http://dx.doi.org/ 10.1002/path.1418 [DOI] [PubMed] [Google Scholar]
- 21.Missiaglia E, Blaveri E, Terris B, Wang YH, Costello E, Neoptolemos JP, Crnogorac-Jurcevic T, Lemoine NR. Analysis of gene expression in cancer cell lines identifies candidate markers for pancreatic tumorigenesis and metastasis. Int J Cancer 2004; 112:100-12; PMID:15305381; http://dx.doi.org/ 10.1002/ijc.20376 [DOI] [PubMed] [Google Scholar]
- 22.Iacobuzio-Donahue CA, Maitra A, Olsen M, Lowe AW, van Heek NT, Rosty C, Walter K, Sato N, Parker A, Ashfaq R, et al.. Exploration of global gene expression patterns in pancreatic adenocarcinoma using cDNA microarrays. Am J Pathol 2003; 162:1151-62; PMID:12651607; http://dx.doi.org/ 10.1016/S0002-9440(10)63911-9 [DOI] [PMC free article] [PubMed] [Google Scholar]
- 23.Tan ZJ, Hu XG, Cao GS, Tang Y. Analysis of gene expression profile of pancreatic carcinoma using cDNA microarray. World J Gastroenterol 2003; 9:818-23; PMID:12679940 [DOI] [PMC free article] [PubMed] [Google Scholar]
- 24.Nakamura T, Furukawa Y, Nakagawa H, Tsunoda T, Ohigashi H, Murata K, Ishikawa O, Ohgaki K, Kashimura N, Miyamoto M, et al.. Genome-wide cDNA microarray analysis of gene expression profiles in pancreatic cancers using populations of tumor cells and normal ductal epithelial cells selected for purity by laser microdissection. Oncogene 2004; 23:2385-400; PMID:14767473; http://dx.doi.org/ 10.1038/sj.onc.1207392 [DOI] [PubMed] [Google Scholar]
- 25.Grutzmann R, Pilarsky C, Ammerpohl O, Luttges J, Bohme A, Sipos B, Foerder M, Alldinger I, Jahnke B, Schackert HK, et al.. Gene expression profiling of microdissected pancreatic ductal carcinomas using high-density DNA microarrays. Neoplasia 2004; 6:611-22; PMID:15548371; http://dx.doi.org/ 10.1593/neo.04295 [DOI] [PMC free article] [PubMed] [Google Scholar]
- 26.Prasad NB, Biankin AV, Fukushima N, Maitra A, Dhara S, Elkahloun AG, Hruban RH, Goggins M, Leach SD. Gene expression profiles in pancreatic intraepithelial neoplasia reflect the effects of Hedgehog signaling on pancreatic ductal epithelial cells. Cancer Res 2005; 65:1619-26; PMID:15753353; http://dx.doi.org/ 10.1158/0008-5472.CAN-04-1413 [DOI] [PubMed] [Google Scholar]
- 27.Friess H, Ding J, Kleeff J, Fenkell L, Rosinski JA, Guweidhi A, Reidhaar-Olson JF, Korc M, Hammer J, Büchler MW. Microarray-based identification of differentially expressed growth- and metastasis-associated genes in pancreatic cancer. Cell Mol Life Sci 2003; 60:1180-99; PMID:12861384 [DOI] [PMC free article] [PubMed] [Google Scholar]
- 28.Grutzmann R, Saeger HD, Luttges J, Schackert HK, Kalthoff H, Kloppel G, Pilarsky C. Microarray-based gene expression profiling in pancreatic ductal carcinoma: status quo and perspectives. Int J Colorectal Dis 2004; 19:401-13; PMID:14745573; http://dx.doi.org/ 10.1007/s00384-003-0563-3 [DOI] [PubMed] [Google Scholar]
- 29.Brandt R, Grutzmann R, Bauer A, Jesnowski R, Ringel J, Lohr M, Pilarsky C, Hoheisel JD. DNA microarray analysis of pancreatic malignancies. Pancreatology 2004; 4:587-97; PMID:15557762; http://dx.doi.org/ 10.1159/000082241 [DOI] [PubMed] [Google Scholar]
- 30.Gardner-Thorpe J, Ito H, Ashley SW, Whang EE. Differential display of expressed genes in pancreatic cancer cells. Biochem Biophys Res Commun 2002; 293:391-5; PMID:12054612; http://dx.doi.org/ 10.1016/S0006-291X(02)00237-1 [DOI] [PubMed] [Google Scholar]
- 31.Gygi SP, Rochon Y, Franza BR, Aebersold R. Correlation between protein and mRNA abundance in yeast. Mol Cell Biol 1999; 19:1720-30; PMID:10022859 [DOI] [PMC free article] [PubMed] [Google Scholar]
- 32.Chen R, Pan S, Brentnall TA, Aebersold R. Proteomic profiling of pancreatic cancer for biomarker discovery. Mol Cell Proteomics 2005; 4:523-33; PMID:15684406; http://dx.doi.org/ 10.1074/mcp.R500004-MCP200 [DOI] [PubMed] [Google Scholar]
- 33.Gronborg M, Kristiansen TZ, Iwahori A, Chang R, Reddy R, Sato N, Molina H, Jensen ON, Hruban RH, Goggins MG, et al.. Biomarker Discovery from Pancreatic Cancer Secretome Using a Differential Proteomic Approach. Mol Cell Proteomics 2006; 5:157-71; PMID:16215274; http://dx.doi.org/ 10.1074/mcp.M500178-MCP200 [DOI] [PubMed] [Google Scholar]
- 34.Zhang W, Erkan M, Abiatari I, Giese NA, Felix K, Kayed H, Büchler MW, Friess H, Kleeff J. Expression of extracellular matrix metalloproteinase inducer (EMMPRIN/CD147) in pancreatic neoplasm and pancreatic stellate cells. Cancer Biol Ther 2007; 6:218-27; PMID:17224648; http://dx.doi.org/ 10.4161/cbt.6.2.3623 [DOI] [PubMed] [Google Scholar]
- 35.Li M, Zhai Q, Bharadwaj U, Wang H, Li F, Fisher WE, Chen C, Yao Q. Cyclophilin A is overexpressed in human pancreatic cancer cells and stimulates cell proliferation through CD147. Cancer 2006; 106:2284-94; PMID:16604531; http://dx.doi.org/ 10.1002/cncr.21862 [DOI] [PubMed] [Google Scholar]
- 36.Schneiderhan W, Diaz F, Fundel M, Zhou S, Siech M, Hasel C, Möller P, Gschwend JE, Seufferlein T, Gress T, et al.. Pancreatic stellate cells are an important source of MMP-2 in human pancreatic cancer and accelerate tumor progression in a murine xenograft model and CAM assay. J Cell Sci 2007; 120:512-9; PMID:17227797; http://dx.doi.org/ 10.1242/jcs.03347 [DOI] [PubMed] [Google Scholar]
- 37.Immervoll H, Hoem D, Steffensen OJ, Miletic H, Molven A. Visualization of CD44 and CD133 in normal pancreas and pancreatic ductal adenocarcinomas: non-overlapping membrane expression in cell populations positive for both markers. J Histochem Cytochem 2011; 59:441-55; PMID:21411814; http://dx.doi.org/ 10.1369/0022155411398275 [DOI] [PMC free article] [PubMed] [Google Scholar]
- 38.Takada M, Yamamoto M, Saitoh Y. The significance of CD44 in human pancreatic cancer: I. High expression of CD44 in human pancreatic adenocarcinoma. Pancreas 1994; 9:748-52; PMID:7531334; http://dx.doi.org/ 10.1097/00006676-199411000-00013 [DOI] [PubMed] [Google Scholar]
- 39.Gansauge F, Gansauge S, Zobywalski A, Scharnweber C, Link KH, Nussler AK, Beger HG. Differential expression of CD44 splice variants in human pancreatic adenocarcinoma and in normal pancreas. Cancer Res 1995; 55:5499-503; PMID:7585621 [PubMed] [Google Scholar]
- 40.Korc M, Chandrasekar B, Yamanaka Y, Friess H, Buchier M, Beger HG. Overexpression of the epidermal growth factor receptor in human pancreatic cancer is associated with concomitant increases in the levels of epidermal growth factor and transforming growth factor α. J Clin Invest 1992; 90:1352-60; PMID:1401070; http://dx.doi.org/ 10.1172/JCI116001 [DOI] [PMC free article] [PubMed] [Google Scholar]
- 41.Zhang L, Yuan SZ. Expression of c-erbB-2 oncogene protein, epidermal growth factor receptor, and TGF-beta1 in human pancreatic ductal adenocarcinoma. Hepatobiliary Pancreat Dis Int 2002; 1:620-3; PMID:14607699 [PubMed] [Google Scholar]
- 42.Tobita K, Kijima H, Dowaki S, Kashiwagi H, Ohtani Y, Oida Y, Yamazaki H, Nakamura M, Ueyama Y, Tanaka M, et al.. Epidermal growth factor receptor expression in human pancreatic cancer: Significance for liver metastasis. Int J Mol Med 2003; 11:305-9; PMID:12579331 [PubMed] [Google Scholar]
- 43.Cao D, Hustinx SR, Sui G, Bala P, Sato N, Martin S, Maitra A, Murphy KM, Cameron JL, Yeo CJ, et al.. Identification of novel highly expressed genes in pancreatic ductal adenocarcinomas through a bioinformatics analysis of expressed sequence tags. Cancer Biol Ther 2004; 3:1081-9; discussion 90-1; PMID:15467436; http://dx.doi.org/ 10.4161/cbt.3.11.1175 [DOI] [PubMed] [Google Scholar]
- 44.Van den Broeck A, Vankelecom H, Van Eijsden R, Govaere O, Topal B. Molecular markers associated with outcome and metastasis in human pancreatic cancer. J Exp Clin Cancer Res 2012; 31:68; PMID:22925330; http://dx.doi.org/ 10.1186/1756-9966-31-68 [DOI] [PMC free article] [PubMed] [Google Scholar]
- 45.Chen R, Brentnall TA, Pan S, Cooke K, Moyes KW, Lane Z, Crispin DA, Goodlett DR, Aebersold R, Bronner MP. Quantitative proteomics analysis reveals that proteins differentially expressed in chronic pancreatitis are also frequently involved in pancreatic cancer. Mol Cell Proteomics 2007; 6:1331-42; PMID:17496331; http://dx.doi.org/ 10.1074/mcp.M700072-MCP200 [DOI] [PubMed] [Google Scholar]
- 46.Kim H, Zhai G, Liu Z, Samuel S, Shah N, Helman EE, Knowles JA, Stockard CR, Fineberg NS, Grizzle WE, et al.. Extracelluar matrix metalloproteinase as a novel target for pancreatic cancer therapy. Anticancer Drugs 2011; 22:864-74; PMID:21730821; http://dx.doi.org/ 10.1097/CAD.0b013e328349311e [DOI] [PMC free article] [PubMed] [Google Scholar]
- 47.Faller BA, Burtness B. Treatment of pancreatic cancer with epidermal growth factor receptor-targeted therapy. Biologics 2009; 3:419-28; PMID:19774209 [PMC free article] [PubMed] [Google Scholar]
- 48.Canbolat O, Durak I, Cetin R, Kavutcu M, Demirci S, Ozturk S. Activities of adenosine deaminase, 5′-nucleotidase, guanase, and cytidine deaminase enzymes in cancerous and non-cancerous human breast tissues. Breast Cancer Res Treat 1996; 37:189-93; PMID:8750586; http://dx.doi.org/ 10.1007/BF01806500 [DOI] [PubMed] [Google Scholar]
- 49.Supernat A, Markiewicz A, Welnicka-Jaskiewicz M, Seroczynska B, Skokowski J, Sejda A, Szade J, Czapiewski P, Biernat W, Zaczek A. CD73 expression as a potential marker of good prognosis in breast carcinoma. Appl Immunohistochem Mol Morphol 2012; 20:103-7; PMID:22553809; http://dx.doi.org/ 10.1097/PAI.0b013e3182311d82 [DOI] [PubMed] [Google Scholar]
- 50.Oh HK, Sin JI, Choi J, Park SH, Lee TS, Choi YS. Overexpression of CD73 in epithelial ovarian carcinoma is associated with better prognosis, lower stage, better differentiation and lower regulatory T cell infiltration. J Gynecol Oncol 2012; 23:274-81; PMID:23094131; http://dx.doi.org/ 10.3802/jgo.2012.23.4.274 [DOI] [PMC free article] [PubMed] [Google Scholar]
- 51.Aliagas E, Vidal A, Texido L, Ponce J, Condom E, Martin-Satue M. High expression of ecto-nucleotidases CD39 and CD73 in human endometrial tumors. Mediators Inflamm 2014; 2014:509027; PMID:24707115; http://dx.doi.org/ 10.1155/2014/509027 [DOI] [PMC free article] [PubMed] [Google Scholar]
- 52.Flocke K, Lesch G, Elsasser HP, Bosslet K, Mannherz HG. Monoclonal antibodies against 5′-nucleotidase from a human pancreatic tumor cell line: their characterization and inhibitory capacity on tumor cell adhesion to fibronectin substratum. Eur J Cell Biol 1992; 58:62-70; PMID:1644065 [PubMed] [Google Scholar]
- 53.Flocke K, Mannherz HG. Isolation and characterization of 5′-nucleotidase of a human pancreatic tumor cell line. Biochim Biophys Acta 1991; 1076:273-81; PMID:1998727; http://dx.doi.org/ 10.1016/0167-4838(91)90278-8 [DOI] [PubMed] [Google Scholar]
- 54.Jin D, Fan J, Wang L, Thompson LF, Liu A, Daniel BJ, Shin T, Curiel TJ, Zhang B. CD73 on tumor cells impairs antitumor T-cell responses: a novel mechanism of tumor-induced immune suppression. Cancer Res 2010; 70:2245-55; PMID:20179192; http://dx.doi.org/ 10.1158/0008-5472.CAN-09-3109 [DOI] [PMC free article] [PubMed] [Google Scholar]
- 55.Hadari YR, Arbel-Goren R, Levy Y, Amsterdam A, Alon R, Zakut R, Zick Y. Galectin-8 binding to integrins inhibits cell adhesion and induces apoptosis. J Cell Sci 2000; 113 (Pt 13):2385-97; PMID:10852818 [DOI] [PubMed] [Google Scholar]
- 56.Levy Y, Arbel-Goren R, Hadari YR, Eshhar S, Ronen D, Elhanany E, Geiger B, Zick Y. Galectin-8 functions as a matricellular modulator of cell adhesion. J Biol Chem 2001; 276:31285-95; PMID:11371555; http://dx.doi.org/ 10.1074/jbc.M100340200 [DOI] [PubMed] [Google Scholar]
- 57.Gundry RL, Raginski K, Tarasova Y, Tchernyshyov I, Bausch-Fluck D, Elliott ST, Boheler KR, Van Eyk JE, Wollscheid B. The mouse C2C12 myoblast cell surface N-linked glycoproteome: Identification, glycosite occupancy, and membrane orientation. Mol Cell Proteomics 2009; 8:2555-69; PMID:19656770; http://dx.doi.org/ 10.1074/mcp.M900195-MCP200 [DOI] [PMC free article] [PubMed] [Google Scholar]
- 58.Schiess R, Mueller LN, Schmidt A, Mueller M, Wollscheid B, Aebersold R. Analysis of cell surface proteome changes via label-free, quantitative mass spectrometry. Mol Cell Proteomics 2009; 8:624-38; PMID:19036722; http://dx.doi.org/ 10.1074/mcp.M800172-MCP200 [DOI] [PMC free article] [PubMed] [Google Scholar]
- 59.Haun RS, Fan CY, Mackintosh SG, Zhao H, Tackett AJ. CD109 Overexpression in Pancreatic Cancer Identified by Cell-Surface Glycoprotein Capture. J Proteomics Bioinform 2014; Suppl 10:S10003; PMID:25635161 [DOI] [PMC free article] [PubMed] [Google Scholar]
- 60.Byrum S, Avaritt NL, Mackintosh SG, Munkberg JM, Badgwell BD, Cheung WL, Tackett AJ. A quantitative proteomic analysis of FFPE melanoma. J Cutan Pathol 2011; 38:933-6; PMID:21883366; http://dx.doi.org/ 10.1111/j.1600-0560.2011.01761.x [DOI] [PMC free article] [PubMed] [Google Scholar]
- 61.Byrum S, Mackintosh SG, Edmondson RD, Cheung WL, Taverna SD, Tackett AJ. Analysis of Histone Exchange during Chromatin Purification. J Integr OMICS 2011; 1:61-5; PMID:21709819 [DOI] [PMC free article] [PubMed] [Google Scholar]
- 62.Byrum SD, Taverna SD, Tackett AJ. Quantitative analysis of histone exchange for transcriptionally active chromatin. J Clin Bioinforma 2011; 1:17; PMID:21884633; http://dx.doi.org/ 10.1186/2043-9113-1-17 [DOI] [PMC free article] [PubMed] [Google Scholar]
- 63.Byrum SD, Larson SK, Avaritt NL, Moreland LE, Mackintosh SG, Cheung WL, Tackett AJ. Quantitative Proteomics Identifies Activation of Hallmark Pathways of Cancer in Patient Melanoma. J Proteomics Bioinform 2013; 6:43-50; PMID:23976835; http://dx.doi.org/ 10.4172/jpb.1000260 [DOI] [PMC free article] [PubMed] [Google Scholar]
- 64.Zybailov B, Mosley AL, Sardiu ME, Coleman MK, Florens L, Washburn MP. Statistical analysis of membrane proteome expression changes in Saccharomyces cerevisiae. J Proteome Res 2006; 5:2339-47; PMID:16944946; http://dx.doi.org/ 10.1021/pr060161n [DOI] [PubMed] [Google Scholar]
Associated Data
This section collects any data citations, data availability statements, or supplementary materials included in this article.