Abstract
Objective:
To report the long-term follow-up of subsolid nodules (SSNs) detected in participants of a prospective low-dose CT lung cancer screening cohort, and to investigate the utility of the PanCan model in stratifying risk in baseline SSNs.
Methods:
Participants underwent a baseline scan, two annual incidence scans and further follow-up scans for the detected nodules. All SSNs underwent a minimum of 2 years of follow-up (unless resolved or resected). Risk of malignancy was estimated using the PanCan model; discrimination [area under the receiver-operating characteristic curve (AUC)] and calibration (Hosmer–Lemeshow goodness-of-fit test) were assessed. The Mann–Whitney U–Wilcoxon test was used to compare estimated risk between groups.
Results:
70 SSNs were detected in 41 (16.0%) out of 256 total participants. Median follow-up period was 25.5 months (range 2.0–74.0 months). 29 (41.4%) SSNs were transient. Five (7.1%) SSNs were resected, all found to be Stage I lung adenocarcinoma, including one SSN stable in size for 3.0 years before growth was detected. The PanCan model had good discrimination for the 52 baseline SSNs (AUC = 0.89; 95% confidence interval 0.76–1); the Hosmer–Lemeshow goodness-of-fit test was non-significant (p = 0.27). Estimated risk was significantly higher in the baseline SSNs found to be cancer vs those not found to be cancer after 2–6 years of follow-up (p < 0.01).
Conclusion:
Our findings support a long-term follow-up approach for screen-detected SSNs for 3 years or longer. The PanCan model appeared discriminatory and well calibrated in this cohort.
Advances in knowledge:
The PanCan model may have utility in identifying low-risk SSNs which could be followed with less frequent CT scans.
INTRODUCTION
With the advent of low-dose CT lung cancer screening, the importance of subsolid nodules (SSNs) is increasingly being recognized. While a significant proportion of SSNs are transient,1 the most common finding in persistent SSNs that are resected is an entity within the spectrum of lung adenocarcinoma.2–4 Guidelines on the management of SSNs have been released, including that indeterminate SSNs should be followed-up for 3 years or longer,1,5 since they may represent slow-growing adenocarcinoma. However, the guideline authors graded their recommendations as based on very low to moderate quality level of evidence.1,5 Additional longitudinal data are required to support current management practices. Estimation of absolute nodule lung cancer risk, e.g. by the Pan-Canadian Early Detection of Lung Cancer (Brock University) Model6 (PanCan model) for baseline scan nodules, may have a role in management7 but requires further validation in multiple populations. This article reports the prevalence, incidence and long-term follow-up of SSNs detected in a low-dose CT lung cancer screening cohort 8,9 based on the National Lung Screening Trial protocols and investigates the utility of the PanCan model in stratifying risk in baseline SSNs.
METHODS AND MATERIALS
The study population comprised 256 high-risk volunteers undergoing low-dose CT screening from December 2007 onwards.8 Participants provided written informed consent. The study was approved by the Hospital and University Medical Research Ethics Committees. Low-dose CT was performed with a 64-detector helical scanner (Philips Brilliance 64; Philips Medical Systems, Best, Netherlands) with the parameters: 120 kV, 25–70 mA (dependent on body weight8), individual detector collimation 0.625 mm, gantry rotation time 0.75 s, pitch 0.92 and thin-slice reconstruction width 0.9 mm at 0.45-mm intervals [standard (B) reconstruction kernel]. Baseline scans and two annual incidence scans were viewed on a picture archiving and communication system (IMPAX, Agfa Healthcare, Mortsel, Belgium) and were prospectively and independently read by pairs of thoracic radiologists (JA, JC, ML, RES) blinded to previous CTs and subsequently ratified at a consensus meeting of at least one radiologist and two thoracic physicians (HMM, KMF, RVB, SCL, IAY).8 The maximum axial diameter of nodules and corresponding width (the longest dimension perpendicular to maximum axial diameter, viewed on the same CT image) were measured with electronic callipers on thin-slice images at a standard lung window setting (width 1500 HU, level −500 HU). The nodule type (solid, part-solid and non-solid), margin (smooth, spiculated and ill-defined) and lobar location were also recorded. When nodules were first detected on incidence scans, previous scans were reviewed at the consensus meeting to ascertain the presence or otherwise of any precursor lesion that might have been overlooked previously. All SSNs underwent at least 2 years of follow-up (unless resolved or resected) to ensure absence of growth. Follow-up of nodules beyond the three scheduled screening scans was performed prospectively by a radiologist unblinded to previous scans. For the purposes of this report, follow-up was censored on 12 February 2015. Suspicious nodules were referred for clinical review with a thoracic physician. Modes of biopsy included percutaneous CT-guided needle biopsy, bronchoscopic biopsy and surgical resection. Pathological examination is reported according to the International Association for the Study of Lung Cancer/American Thoracic Society/European Respiratory Society International Multidisciplinary Classification of Lung Adenocarcinoma.10
Nodule definitions: an SSN is a focal nodular area of increased lung attenuation through which normal parenchymal structures, including airways and vessels, can be visualized;1 a part-solid nodule (PSN) is an SSN which contains solid component(s) that obscure underlying architecture;1 a non-solid nodule (NSN) is an SSN in which there are no solid components;1 and a ‘transient SSN’ completely disappears (i.e. resolves) on follow-up scan (no minimum or maximum follow-up period). Owing to intraobserver and interobserver variability in size measurement, growth was defined as a ≥3-mm increase in diameter11 or development of solid component(s).12
Statistical analysis was performed on R v. 3.1.2.13 Differences between groups were analysed with the Mann–Whitney U–Wilcoxon test (for continuous variables) and χ2 test or Fisher's exact test (for categorical variables). We used the PanCan model (full model with spiculation)6 to estimate risk of malignancy in baseline SSNs, including those found to be present at baseline in retrospect. Model variables were age, sex, family history of lung cancer (first-degree relative), presence of visually detected emphysema (determined at consensus meeting), nodule diameter, nodule type, nodule location, baseline scan nodule count and presence of spiculation. Model performance was evaluated through statistical tests of discrimination (ability to correctly categorize nodules as cancer vs not cancer on follow-up, assessed by the area under the receiver-operating characteristic curve with larger values indicating better discrimination; 95% confidence intervals were estimated based on 1000 bootstrapped samples) and calibration (how well the model-predicted cancer rates match the observed cancer rates, assessed with the Hosmer–Lemeshow goodness-of-fit test, with p-value <0.05 indicating a poorly calibrated model). Statistical significance was defined as a two-tailed p-value <0.05.
RESULTS
Study population and nodule characteristics
Participant baseline characteristics are presented in Table 1.
Table 1.
Participant characteristics at baseline
| Variable | Total (n = 256) | Participants with at least one SSN (n = 41) | Participants with no SSNs (n = 215) | p-value |
|---|---|---|---|---|
| Males | 171 (66.8) | 27 (65.9) | 144 (67.0) | 0.89 |
| Age (yearsa) | 64 (59–74) | 63 (60–74) | 64 (59–74) | 0.27 |
| Current smokerb | 121 (47.3) | 19 (46.3) | 102 (47.4) | 0.90 |
| Smoking pack year history (pack years) | 56 (26–235) | 51 (33–150) | 56 (26–235) | 0.20 |
| Airflow limitation on spirometryc | 155 (60.5) | 27 (65.9) | 128 (59.5) | 0.45 |
| FEV1% predicted | 95.0 (46.6–155.6) | 90.0 (54.8–129.7) | 95.7 (46.6–155.6) | 0.17 |
| Body mass index (kg m−2) | 28.3 (18.1–42.3) | 27.9 (18.1–42.3) | 28.4 (20.5–40.6) | 0.84 |
| First-degree relative with lung cancer | 46 (18.0) | 8 (19.5) | 38 (17.7) | 0.78 |
| Caucasian ethnicity | 254 (99.2) | 40 (97.6) | 214 (99.5) | 0.30 |
FEV1, forced expiratory volume in 1 s; SSN, subsolid nodule.
Data presented as either n (%) or median (range).
Rounded down to nearest year.
Self-reported current smoker or quit <6 months prior to enrolment.
FEV1/forced vital capacity ratio <70%.
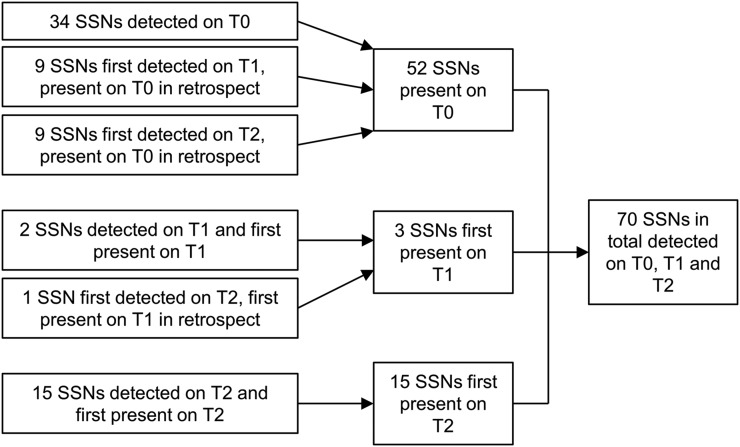
70 SSNs were detected in 41 (16.0%) of 256 participants (Figure 1). In these 41 participants, median number of SSNs per participant was 1 (range 1–9). 52 (74.3%) SSNs were present at baseline (34 prospectively detected, 18 retrospectively detected). Three (4.3%) SSNs were first present on the first-year incidence scan (two prospectively detected, one retrospectively detected). 15 (21.4%) SSNs were first present on the second-year incidence scan (all prospectively detected).
Figure 1.
Detection of subsolid nodules (SSNs). T0, baseline scan; T1, first-year incidence scan; T2, second-year incidence scan.
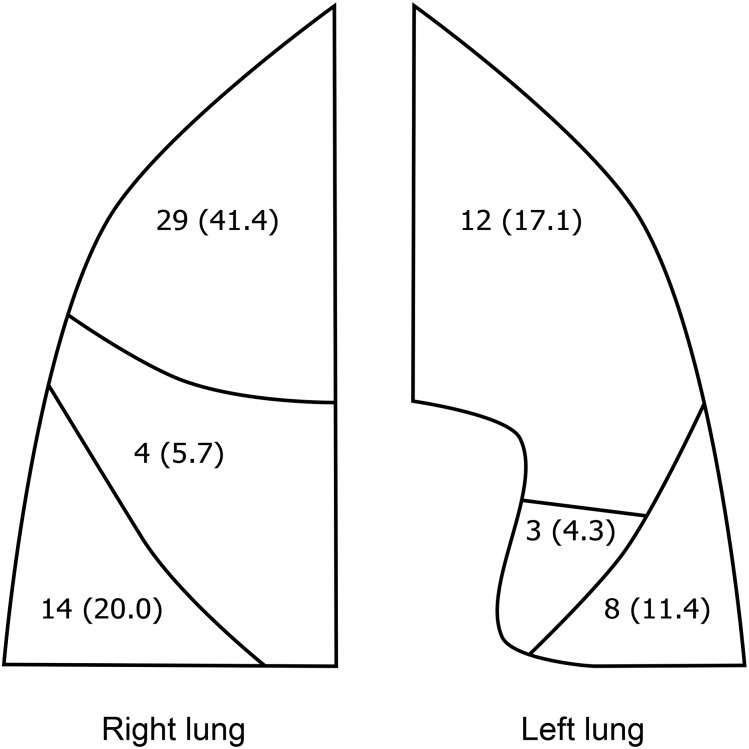
The median SSN initial diameter was 6.3 mm (range 2.9–20.0 mm) (“initial” refers to the earliest scan in which the SSN was observed, including in retrospect, out of the baseline and annual incidence scans). 62 (88.6%) SSNs were non-solid initially (median diameter 6.1 mm, range 2.9–18.3 mm), and 8 (11.4%) SSNs were part-solid initially (median diameter 9.5 mm, range 5.7–20.0 mm). The majority of SSNs were in the upper lobes (41 of 70 SSNs, 58.6%) (Figure 2).
Figure 2.
Lobar distribution of the 70 subsolid nodules. Data presented as n (%).
Course of subsolid nodules
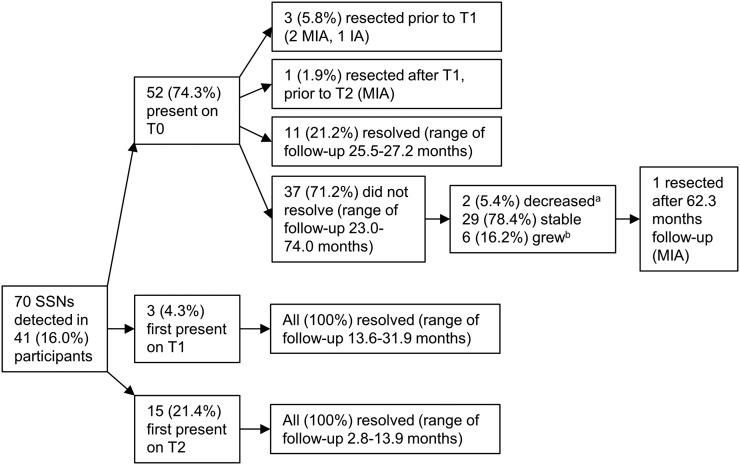
Median follow-up period for all 70 SSNs was 25.5 months (range 2.0–74.0 months). Figure 3 shows the course of the SSNs. Of the 62 SSNs which were non-solid initially, 2 (3.2%) SSNs became part-solid—1 SSN was first observed as part-solid at 16.1 months and subsequently demonstrated no change in diameter over 32.5 months, and 1 SSN was first observed as part-solid at 44.1 months; both are still undergoing radiological surveillance. 29 (41.4%) SSNs were transient (26 NSNs and 3 PSNs), observed to fully resolve within 2.8–31.9 months after initial presence; 3 (4.3%) SSNs persisted for greater than 12 months before disappearance, while 26 (37.1%) SSNs disappeared in less than 12 months. SSNs first present on an incidence scan were more frequently transient than SSNs present on baseline [100% (18 of 18) vs 21.2% (11 of 52); χ2 = 34.26, df = 1; p < 0.0001].
Figure 3.
Course of the subsolid nodules (SSNs). (a) Decreased in diameter ≥3 mm; (b) increased in diameter ≥3 mm or solid component(s) developed. IA, invasive adenocarcinoma; MIA, minimally invasive adenocarcinoma; T0, baseline scan; T1, first-year incidence scan; T2, second-year incidence scan.
Some SSNs exhibited slow rates of growth. Two SSNs exhibited an increase in diameter (≥3 mm) after 36.5 months and 44.1 months of observed stability in diameter, respectively, the former of which was a NSN resected after 62.3 months of radiological follow-up and found to be non-mucinous minimally invasive adenocarcinoma. One SSN was first observed to contain a solid component at 44.1 months, having been purely non-solid density up to that point.
Resected subsolid nodules
Five (7.1%) SSNs (two NSNs and three PSNs) were surgically resected in total (Figure 3), including three PSNs that had prior percutaneous CT-guided needle biopsy, all showing adenocarcinoma. All five resected SSNs were found to be cancer—four non-mucinous minimally invasive adenocarcinomas (two NSNs and two PSNs) and one acinar predominant invasive adenocarcinoma (PSN). The median initial diameter of the cancerous SSNs was 9.9 mm (range 6.4–20.0 mm).The median time from initial presence on CT scan to treatment was 8.7 months (range 5.7–67.3 months). All were pathological stage T1aN0 (Stage I).
Application of the PanCan model
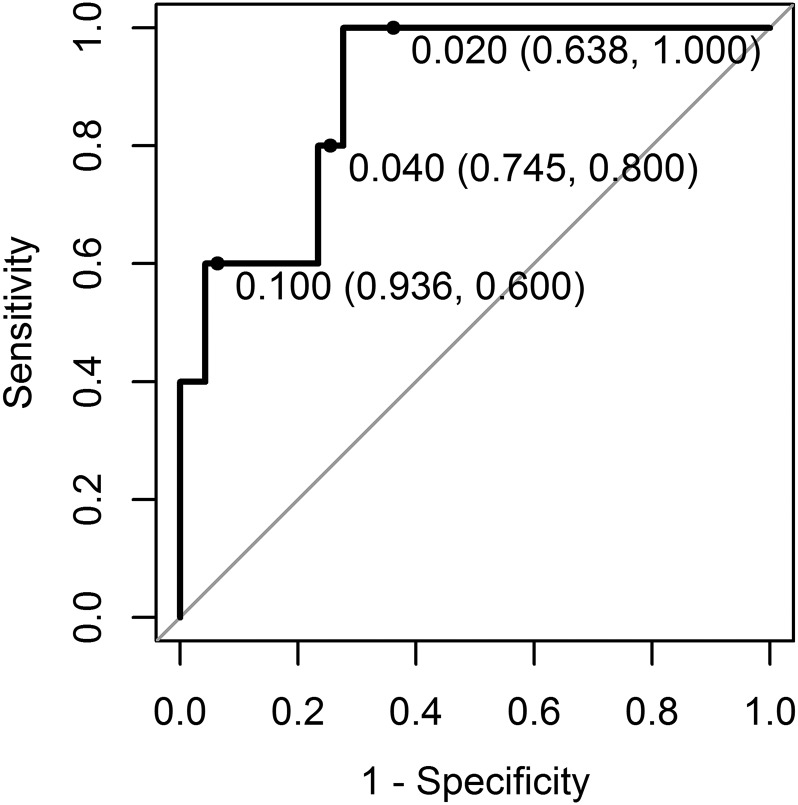
The PanCan model had good discrimination for the 52 baseline SSNs (area under the receiver-operating characteristic curve=0.89, 95% confidence interval 0.76–1) (Figure 4). The Hosmer–Lemeshow goodness-of-fit test was non-significant (χ2 = 10.00, df = 8, p-value = 0.27), indicating no significant evidence of miscalibration.
Figure 4.
Receiver-operating characteristic curve for the PanCan model (full model with spiculation) applied to 52 subsolid nodules (SSNs) present on the baseline scan (5 SSNs found to be lung cancer on surgical resection; 47 SSNs not found to be cancer on 2–6 years of follow-up). Area under the receiver-operating characteristic curve was 0.89 (95% confidence interval 0.76–1). 0.02, 0.04 and 0.1 risk thresholds are labelled on the receiver-operating characteristic curve [risk threshold (specificity and sensitivity)].
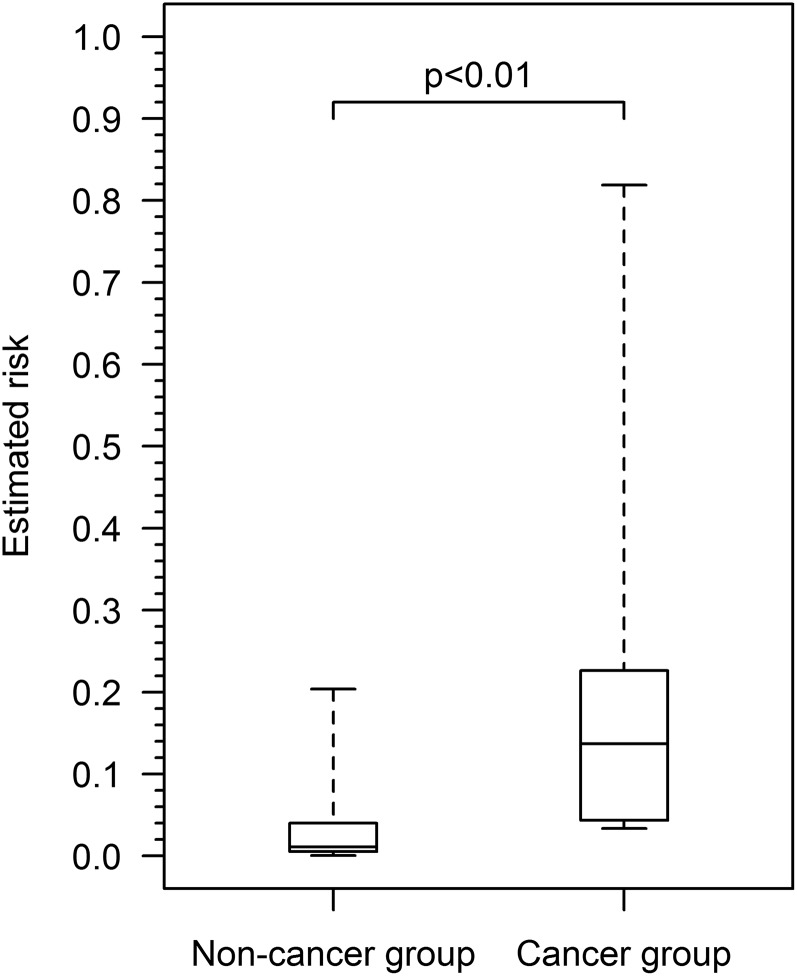
Figure 5 shows the distribution of estimated lung cancer risk in the 52 baseline SSNs. Estimated risk was significantly higher in the baseline SSNs found to be cancer (median 0.1369, range 0.0338–0.8190) vs those not found to be cancer on 2–6 years of follow-up (median 0.0108, range 0.0006–0.2036) (W = 209, p < 0.01). As a sensitivity analysis, if SSNs ≤5 mm, which may not require follow-up according to current recommendations,1,5 are excluded from analysis (n = 15, all in the non-cancer group), estimated risk remains significantly higher in the cancer group than in the non-cancer group (median 0.0202; range 0.0027–0.2036) (W = 134, p = 0.02).
Figure 5.
Box plots of estimated lung cancer risk (PanCan full model with spiculation) for baseline subsolid nodules found to be lung cancer (n = 5) vs not found to be cancer on 2–6 years of follow-up (n = 47). Horizontal lines within boxes represent median risk, boxes represent the lower and upper hinges and whiskers represent the total range. The cancer group had significantly higher estimated risk than the non-cancer group (p < 0.01, Mann–Whitney U–Wilcoxon test).
DISCUSSION
We evaluated the natural history of SSNs in an Australian lung cancer screening cohort and tested the utility of the PanCan model in stratifying risk in baseline SSNs. Our results demonstrate that SSNs may grow after more than 3 years' apparent stability in diameter and attenuation, and conversely may resolve after persisting for longer than 1 year. Our results therefore support a long-term CT monitoring approach for SSNs in keeping with international recommendations of minimum 3 years' surveillance.1,5 However, the length of follow-up required beyond 3 years is unclear and requires further investigation.
The PanCan model performed well in our baseline SSNs, with good discrimination and no evidence of miscalibration, although limited by the small sample size. Estimated risk was significantly higher in the baseline SSNs found to be cancer vs those not found to be cancer on 2–6 years of follow-up. The latter group of SSNs could have been followed safely with CT 2 years after baseline rather than 1 year. The PanCan model could therefore potentially be used to identify low-risk baseline SSNs, which could be followed with less frequent CT follow-up. Recommendations for follow-up, often annual for 3 years or longer after an initial 3-month CT examination to determine persistence, have largely been based on the SSN size and non-solid/part-solid type,1,5 although the use of the PanCan model to inform management has also been suggested in more recent guidelines.7 Owing to the long duration of follow-up required, the use of a risk prediction model such as the PanCan model to identify SSNs that could undergo less intense follow-up could reduce the cost of follow-up and radiation exposure. The selection of an appropriate risk threshold to define a low-risk SSN is complex and requires considerations of sensitivity and specificity and is outside the scope of this study. Further external validation of the PanCan model and investigation of risk stratification to inform nodule management should be conducted in larger cohorts of SSNs with longer follow-up periods. Furthermore, since guidelines often recommend initial short-term follow-up at 3 months,1,5,7 the application of the PanCan model specifically in SSNs persistent at 3 months may warrant closer evaluation, as these SSNs are the ones which require consideration for long-term follow-up.
In our study, we observed all incidence scan SSNs resolved by 3 years, and all cancers were from baseline SSNs. Yankelevitz et al12 and Lee et al14 also found that incidence scan SSNs were more frequently transient than baseline SSNs. We hypothesize that SSNs present at baseline often represent longstanding lesions, such as entities in the spectrum of lung adenocarcinoma, which are likely to persist. In contrast, SSNs first arising on incidence scans are newer lesions and have a greater chance of being transient infectious or inflammatory lesions.
This study had a number of limitations. Firstly, our study had a relatively small sample size. Secondly, while some SSNs were followed for beyond 5 years, the minimum follow-up period was 2 years (unless the SSN resolved or was resected). A longer minimum follow-up period may have allowed for further detection of growth in more slowly growing lesions. Thirdly, only suspicious lesions for cancer were biopsied, and thus the histological identity of most SSNs was not determined.
CONCLUSION
Although limited by small sample size, our findings support a long-term CT follow-up approach for screen-detected SSNs for 3 years or longer. The PanCan risk model may have utility in identifying low-risk SSNs which could be followed with less frequent CT scans and should be tested prospectively in larger cohorts.
FINANCIAL SUPPORT
This study was supported by the Australian National Health and Medical Research Council, a Queensland Smart State grant and The Prince Charles Hospital Foundation.
Contributor Information
Henry Zhao, Email: henry.zhao@uqconnect.edu.au.
Henry M Marshall, Email: henry.marshall@health.qld.gov.au.
Ian A Yang, Email: Ian.Yang@health.qld.gov.au.
Rayleen V Bowman, Email: Rayleen.Bowman@health.qld.gov.au.
John Ayres, Email: ayres.jonny@gmail.com.
Jane Crossin, Email: lukehourigan@mac.com.
Melanie Lau, Email: lellybeary@gmail.com.
Richard E Slaughter, Email: rsla3121@bigpond.net.au.
Stanley Redmond, Email: Stanley.Redmond@health.qld.gov.au.
Linda Passmore, Email: Linda.Passmore@health.qld.gov.au.
Elizabeth McCaul, Email: Elizabeth.McCaul@health.qld.gov.au.
Deborah Courtney, Email: Deborah.Courtney@health.qld.gov.au.
Steven C Leong, Email: stevencleong@me.com.
Morgan Windsor, Email: Morgan.Windsor@health.qld.gov.au.
Paul V Zimmerman, Email: Paul.Zimmerman@health.qld.gov.au.
Kwun M Fong, Email: Kwun.Fong@health.qld.gov.au.
REFERENCES
- 1.Naidich DP, Bankier AA, MacMahon H, Schaefer-Prokop CM, Pistolesi M, Goo JM, et al. Recommendations for the management of subsolid pulmonary nodules detected at CT: a statement from the Fleischner Society. Radiology 2013; 266: 304–17. doi: 10.1148/radiol.12120628 [DOI] [PubMed] [Google Scholar]
- 2.Kim HY, Shim YM, Lee KS, Han J, Yi CA, Kim YK. Persistent pulmonary nodular ground-glass opacity at thin-section CT: histopathologic comparisons. Radiology 2007; 245: 267–75. doi: 10.1148/radiol.2451061682 [DOI] [PubMed] [Google Scholar]
- 3.Kodama K, Higashiyama M, Takami K, Oda K, Okami J, Maeda J, et al. Treatment strategy for patients with small peripheral lung lesion(s): intermediate-term results of prospective study. Eur J Cardiothorac Surg 2008; 34: 1068–74. doi: 10.1016/j.ejcts.2008.07.044 [DOI] [PubMed] [Google Scholar]
- 4.Nakata M, Sawada S, Saeki H, Takashima S, Mogami H, Teramoto N, et al. Prospective study of thoracoscopic limited resection for ground-glass opacity selected by computed tomography. Ann Thorac Surg 2003; 75: 1601–5. doi: 10.1016/S0003-4975(02)04815-4 [DOI] [PubMed] [Google Scholar]
- 5.Gould MK, Donington J, Lynch WR, Mazzone PJ, Midthun DE, Naidich DP, et al. Evaluation of individuals with pulmonary nodules: when is it lung cancer? Diagnosis and management of lung cancer, 3rd ed: American College of Chest Physicians Evidence-Based Clinical Practice Guidelines. Chest 2013; 143(Suppl. 5): e93S–e120S. [DOI] [PMC free article] [PubMed] [Google Scholar]
- 6.McWilliams A, Tammemagi MC, Mayo JR, Roberts H, Liu G, Soghrati K, et al. Probability of cancer in pulmonary nodules detected on first screening CT. N Engl J Med 2013; 369: 910–9. doi: 10.1056/NEJMoa1214726 [DOI] [PMC free article] [PubMed] [Google Scholar]
- 7.Callister ME, Baldwin DR, Akram AR, Barnard S, Cane P, Draffan J, et al. British Thoracic Society guidelines for the investigation and management of pulmonary nodules. Thorax. 2015; 70: ii1–ii54. doi: 10.1136/thoraxjnl-2015-207168 [DOI] [PubMed] [Google Scholar]
- 8.Marshall HM, Bowman RV, Crossin J, Lau MA, Slaughter RE, Passmore LH, et al. Queensland lung cancer screening study: rationale, design and methods. Intern Med J 2012; 43: 174–82. doi: 10.1111/j.1445-5994.2012.02789.x [DOI] [PubMed] [Google Scholar]
- 9.Marshall HM, Bowman RV, Ayres J, Crossin J, Lau M, Slaughter RE, et al. Lung cancer screening feasibility in Australia. Eur Respir J 2015; 45: 1734–7. doi: 10.1183/09031936.00208714 [DOI] [PubMed] [Google Scholar]
- 10.Travis WD, Brambilla E, Noguchi M, Nicholson AG, Geisinger KR, Yatabe Y, et al. International association for the study of lung cancer/american thoracic society/european respiratory society international multidisciplinary classification of lung adenocarcinoma. J Thorac Oncol 2011; 6: 244–85. doi: 10.1097/JTO.0b013e318206a221 [DOI] [PMC free article] [PubMed] [Google Scholar]
- 11.de Hoop B, Gietema H, van de Vorst S, Murphy K, van Klaveren RJ, Prokop M. Pulmonary ground-glass nodules: increase in mass as an early indicator of growth. Radiology 2010; 255: 199–206. doi: 10.1148/radiol.09090571 [DOI] [PubMed] [Google Scholar]
- 12.Yankelevitz DF, Yip R, Smith JP, Liang M, Liu Y, Xu DM, et al. ; International Early Lung Cancer Action Program Investigators Group. CT screening for lung cancer: nonsolid nodules in baseline and annual repeat rounds. Radiology 2015; 277: 555–64. doi: 10.1148/radiol.2015142554 [DOI] [PMC free article] [PubMed] [Google Scholar]
- 13.R Core Team. R: a language and environment for statistical computing. Vienna, Austria: R Foundation for Statistical Computing; 2014. [Google Scholar]
- 14.Lee SM, Park CM, Goo JM, Lee CH, Lee HJ, Kim KG. Transient part-solid nodules detected at screening thin-section CT for lung cancer: comparison with persistent part-solid nodules. Radiology 2010; 255: 242–51. doi: 10.1148/radiol.09090547 [DOI] [PubMed] [Google Scholar]


