. 2016 Apr 8;5:e14294. doi: 10.7554/eLife.14294

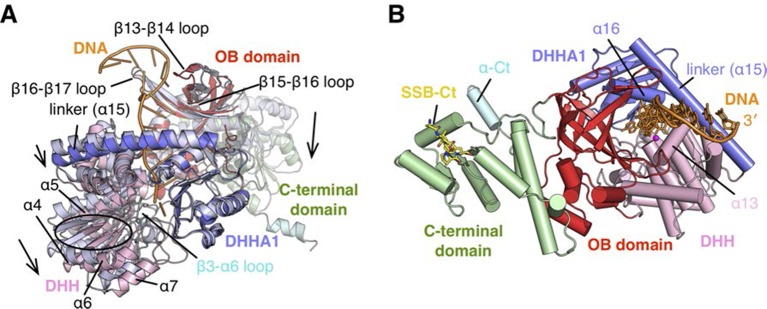
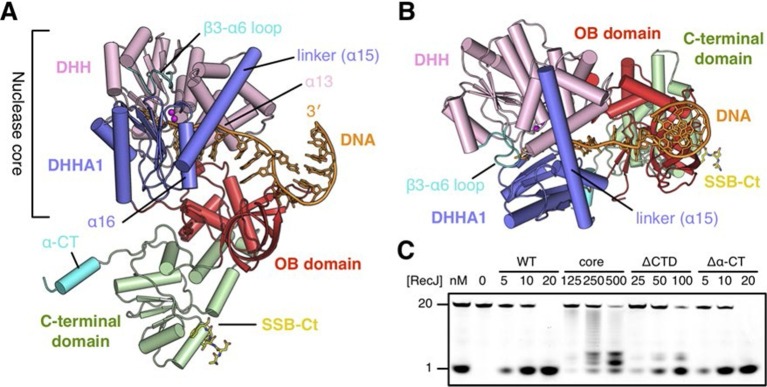
Figure 2. Structure of drRecJ complex.

(A) Overall structure of drRecJ complex viewed from the side. Protein domains of drRecJ are labeled and shown in distinct colors. The DNA and SSB-Ct are colored orange and yellow, respectively. Two Mn2+ in the active site are shown as magenta spheres. Two regions that are disordered in the ttRecJ structures (PDB code: 2ZXP) are highlighted in cyan. Three helices that form a helical gateway are also labeled. (B) Overall structure of the drRecJ complex viewed from the top of the DNA. The downstream nucleotides stack well to mimic the double-stranded DNA. (C) Denaturing PAGE gel showing the nuclease activities of different truncations of drRecJ. 3′-Fluorescence-labeled 20 nt ssDNA (100 nM) was incubated with various concentrations of different truncations of drRecJ proteins (see methods).

DOI: http://dx.doi.org/10.7554/eLife.14294.006

Figure 2.

Figure 2—figure supplement 1. Structure of RecJ:DNA complex.

Figure 2—figure supplement 1.

(A) Comparison of complex II and ttRecJ structures. The ttRecJ (PDB code: 2ZXP) is colored white. Protein domains of drRecJ are shown in distinct colors and labeled. The DNA and ordered β3-α6 loop are colored orange and cyan, respectively. Loops and helices showing noticeable deviations are labeled. The relative domain movements are shown by the arrowheads. (B) Overall structure of complex II viewed from the top of the DNA entrance. Protein domains of drRecJ are shown in distinct colors and labeled. The DNA and SSB-Ct are colored orange and yellow, respectively. Two Mn2+ in the active site are shown as magenta spheres. Three helices (α13, α15 and α16) that form a helical gateway are also labeled.
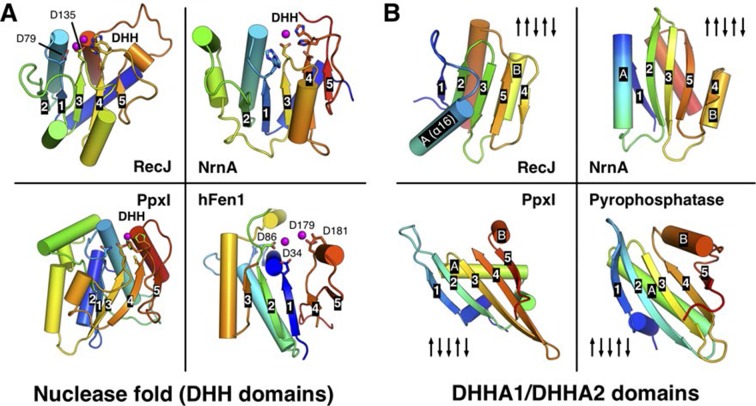
Figure 2—figure supplement 2. Comparison of the nuclease fold and DHHA1/DHHA2 domain.

Figure 2—figure supplement 2.

(A) Structural comparison among the nuclease fold from drRecJ, NrnA (PDB code: 4LS9), PpxI (PDB code: 2QB6) and hFen1 (PDB code: 3Q8K). The nuclease fold of each enzyme is shown in rainbow colors from the blue N- to the red C-terminus. The residues involved in catalysis are shown as sticks. The topologies of β-strands are also labeled. (B) Structural comparison between the DHHA1 domain (drRecJ, NrnA) and the DHHA2 domain (PpxI, Pyrophosphatase (PDB code: 1WPM)). The topologies of β-strands and two inserted α-helices (A and B) are labeled.
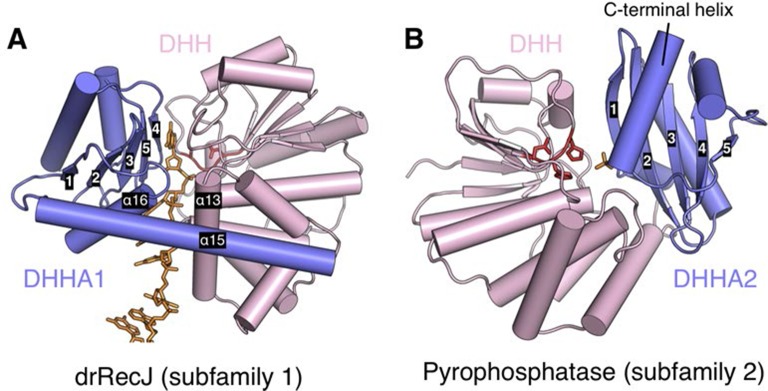
Figure 2—figure supplement 3. Relative position of DHH (pink) and DHHA1/DHHA2 (blue) domain.

Figure 2—figure supplement 3.

The active site of subfamily 1 group is formed between DHH domain and β3 to β5 of DHHA1 domain (A). While the β1 of DHHA2 domain and DHH domain form the active site of subfamily 2 group proteins (B). DNA and phosphate group are colored orange and DHH motif is shown as red stick. The helical gateway in DHHA1 domain and C-terminal α-helix in DHHA2 are also labeled.