

Ions induce changes in the H-bond network of water that extend by >20 nm, vary for H2O and D2O, and lead to surface tension anomalies.
Keywords: Water, electrolytes, hydrogen bonding, nuclear quantum effects, second harmonic generation, nonlinear light scattering, molecular dynamics, surface tension.
Abstract
Electrolytes interact with water in many ways: changing dipole orientation, inducing charge transfer, and distorting the hydrogen-bond network in the bulk and at interfaces. Numerous experiments and computations have detected short-range perturbations that extend up to three hydration shells around individual ions. We report a multiscale investigation of the bulk and surface of aqueous electrolyte solutions that extends from the atomic scale (using atomistic modeling) to nanoscopic length scales (using bulk and interfacial femtosecond second harmonic measurements) to the macroscopic scale (using surface tension experiments). Electrolytes induce orientational order at concentrations starting at 10 μM that causes nonspecific changes in the surface tension of dilute electrolyte solutions. Aside from ion-dipole interactions, collective hydrogen-bond interactions are crucial and explain the observed difference of a factor of 6 between light water and heavy water.
INTRODUCTION
The hydration of ions is related to physiologically, medically, and chemically relevant processes such as protein folding/precipitation, enzyme/ion channel/ion pump activity, action potentials generation, transport across membranes, self-assembly, interfacial charging, and aerosol formation (1–6). Ions interact with dipolar water molecules through ion-dipole interactions. The electrostatic potential around an ion decays with 1/R (with R being the distance away from the ion) and is damped by the high dielectric constant of water and the presence of other ions. The orientationally averaged interaction energy of a dipole and an ion is of a much shorter range, and decays with 1/R4. The structure and dynamics of water around ions have been studied with neutron scattering (7–9), x-ray diffraction (10, 11), x-ray absorption spectroscopy (12, 13), Raman spectroscopy (14), dielectric spectroscopy (15, 16), solvent relaxation measurements (17), vibrational dynamics measurements (18–22), infrared photodissociation spectroscopy of small gas clusters (23, 24), and molecular dynamics studies (22, 25–28). In these studies, a significant perturbation in the structure and dynamics of liquid water by ions is not observed beyond the third hydration shell. For univalent ions, structural changes are observed at ionic strengths >0.1 M. Although the perturbation is found to depend primarily on the valency of the ions, specific effects on chemical structure, size, and polarizability are clearly present (29, 30). Ion pairing becomes relevant at the same ionic strengths (16). In general, there is agreement that the ions’ influence on the water network is mainly dictated by behavior that can be described with mean-field models that treat water as an ideal gas of dipoles, in which ion-dipole interactions are the sole driving force. However, water is a structured liquid in which more complex collective hydrogen-bond (H-bond) interactions account for many of its unusual properties (such as the high melting and boiling points, the large viscosity, and the high surface tension). In addition, most methods rely on either using local probes or determining differences in an average property. Local probes include, for example, the OH stretch frequency, which can be used as an indicator of either chemical interactions (14) or molecular reorientation (19), or the structure factor of O atoms in the first solvation shell, which only changes significantly for water molecules in the first few hydration shells. High electrolyte concentrations are needed to detect a difference in the average distribution of such a property (the OH stretch frequency, the orientational relaxation, or the structure factor). Similarly, computational methods are typically limited to a relatively small number of molecules (27), applicable to either “infinite dilution” or high concentrations (~1 M), making it impractical to simulate the dilute electrolyte solutions studied here.
Here, we report a multiscale investigation of the bulk and surface of dilute aqueous electrolyte solutions. Femtosecond elastic second harmonic scattering (fs-ESHS) (31) was used to detect changes in the orientational order of water molecules in bulk electrolyte solutions over nanoscopic length scales. Snapshots of changes in the orientational distribution of water molecules in different polarization combinations of the incoming and outgoing light reveal that electrolytes induce a perturbation in the orientational order of bulk water. The orientational order, recorded for 21 different electrolytes, starts to change at ionic strengths <10 μM. This seemingly long-range and universal effect is independent of the chemical structure, polarizability, and size of the ions. H2O (hydrogen oxide or light water) and D2O (deuterium oxide or heavy water) show remarkably different responses: the fs-ESHS intensity of pure H2O is 40% lower than that of D2O, whereas a 6× higher ionic strength is needed to perturb D2O compared to H2O. The amount of orientational order induced by the electrolytes is also a factor of 3 lower for D2O. A mean-field model that exclusively incorporates ion-dipole interactions cannot describe the experimental data. Molecular dynamics simulations that include both ion-dipole and dipole-dipole interactions show that ions induce long-range changes in the orientational order of the bulk network, modulating the intrinsic H-bond correlations. That the H-bond is somewhat shorter and stronger for D2O than for H2O (a nuclear quantum effect; Fig. 1A) qualitatively explains the observed difference between neat light water and heavy water and their respective electrolyte solutions. The resultant orientational order can be detected macroscopically. Macroscopic surface tension measurements display changes at ionic strengths that match the saturated values for H2O and D2O, as well as the phenomenological differences observed between them. A comparison with surface and ion-specific resonant reflection second harmonic measurements shows that the nanoscopic bulk restructuring of the H-bond network is responsible for the nonspecific difference in surface tension.
Fig. 1. Snapshots of long-range perturbations in aqueous NaCl solutions.
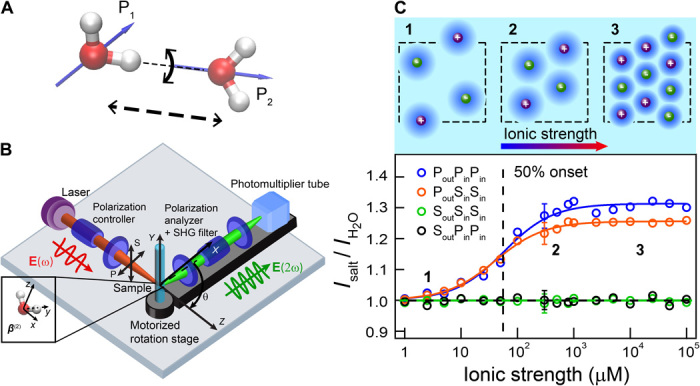
(A) Illustration of two H-bonded water molecules that are orientationally correlated. The black arrows represent different axes along which H-bonds can be broken. fs-ESHS is only sensitive to the breaking of this H-bond via rotation (black curved arrow). Nuclear quantum effects predict that the H-bond bending mode is stronger, whereas the H-bond stretching mode is weaker, for D2O compared to H2O. (B) Sketch of the fs-ESHS experiment. fs-ESHS intensities are recorded at a scattering angle (θ) of 90o. P(S) refers to a polarization direction parallel (perpendicular) to the scattering plane. (C) Top: Illustration of the different regimes probed in the experiment. At low ionic strengths (1), each ion induces long-range structural water correlations in its vicinity, forming a water-ordered domain. At higher ionic strengths, more domains appear. These domains (2) start to overlap and (3) interfere with one another, leading to a saturation of the observed signal. Bottom: fs-ESHS intensities, relative to that of H2O, measured from NaCl solutions. Four different polarization combinations were measured: PoutPinPin, PoutSinSin, SoutPinPin, and SoutSinSin. Only the PoutPinPin and PoutSinSin intensities change with increasing NaCl concentrations.
RESULTS AND DISCUSSION
Femtosecond snapshots of collective effects
In our fs-ESHS experiments (illustrated in Fig. 1B), S- or P-polarized 1028-nm 190-fs 200-kHz pulses interact with an aqueous electrolyte solution and induce a second-order polarization (P(2), Eq. 1 in the Supplementary Materials) that instantaneously scatters polarized 514-nm second harmonic photons. This second-order polarization originates from two main sources (32): electronic anisotropy within an individual nonspherical molecule (32–34) and structural anisotropy, which reports on the combined structural electronic anisotropy of many molecules. The first term is an incoherent contribution and can be understood as a measure of charge asymmetry within a molecule (and is also known as the self-correlation term; Eqs. 8, 11, and 12 in the Supplementary Materials). The second term is a coherent contribution and reports on the total sum of static positional orientational correlations between any pair of molecules (Eq. 9 in the Supplementary Materials). A randomly distributed set of water molecules (as in an ideal gas) contains electronic anisotropy but no orientational correlations. For this reason, femtosecond second harmonic scattering is used routinely to probe particle and droplet surfaces (35, 36): Aligned water molecules by means of H-bonds, an electrostatic field, or other interactions have orientational correlations. As an example, the orientational correlation of a pair of water molecules (as illustrated in Fig. 1A) can be changed by breaking an H-bond through a rotational or bending/libration motion, but not by stretching the H-bond. Femtosecond laser pulses that are shorter than the orientational relaxation time of water are necessary to measure snapshots of the static collective orientational correlations in water (37, 38). In what follows, we refer to the structural collective orientational correlations as orientational order.
Induction of structural orientational order by electrolytes
The polarization combination used in the exciting and emitted beams can be used to obtain information about the nature of the induced second-order polarization. Electronic anisotropy can be found in all eight possible polarization combinations. Orientational order (structural correlation) that is, on average, spherically symmetric, appears only in four polarization combinations: PoutPinPin, SoutSinPin, PoutSinSin, and SoutPinSin (36, 39). In this notation, the subscripts out/in refer to outgoing (emitted) and incoming (exciting) light. If centrosymmetric ions induce changes in the orientational order of water, we expect these changes to appear only in the abovementioned polarization combinations, and not in the combinations SoutSinSin, PoutPinSin, SoutPinPin, and PoutSinPin. The latter combinations report on translational/dipolar order as found in noncentrosymmetric crystals (40). By examining the polarization dependence of the fs-ESHS intensities of aqueous solutions of NaCl from 1 μM to 0.1 M, we can thus determine whether the ions induce changes in the orientational order of the water network. Figure 1C (bottom) shows the change in the fs-ESHS intensity relative to that of neat H2O (at θ = 90o) for 1 μM to 0.1 M NaCl solutions for four different polarization combinations: PoutPinPin, PoutSinSin, SoutSinSin, and SoutPinPin, reporting on the collective orientational order [PoutPinPin and PoutSinSin (39)] and the electronic structure of single molecules [SoutSinSin and SoutPinPin (40)]. The polarization combinations SoutSinSin and SoutPinPin do not display any concentration-dependent intensity change with respect to the signal of pure H2O. This excludes a change in the ion-induced electronic anisotropy of molecules. However, the PoutPinPin and PoutSinSin intensities increase by 30 ± 3% and 25 ± 3%, respectively, before reaching a plateau at ~1 mM. That we observe changes in these polarization combinations alone indicates that the orientational order of water (33, 39) is changing, in qualitative agreement with the inelastic nanosecond hyper-Rayleigh scattering study conducted by Shelton (41).
To make an estimate of the spatial range and magnitude of these perturbations, we simplistically place each ion at the center of a spherical domain that is surrounded by a monomolecular shell of water at a distance R and is distorted in its structure by a tunable phenomenological parameter η, in analogy with nonlinear light-scattering models (35, 36, 42) (see sections S3 and S4). In measurements of up to ~55 μM (Fig. 1C), the spherical domains do not overlap and the measured intensity increases linearly with concentration. At higher concentrations, the fs-ESHS intensity levels off. As more ions are added, the volumes associated with different ions begin to overlap, to interfere with one another, and to exhibit spatial correlations. The dependence of the intensity on concentration is well captured by the functional form of the Langmuir equation, despite being a bulk phenomenon. The Langmuir equation is most commonly used to describe surface adsorption processes. Figure 1C is concerned with a bulk measurement and we note that this correlation is purely empirical. Considering water molecules as organized in concentric shells is not a physically meaningful representation of water and should not be interpreted as such. However, this oversimplified representation does serve to show that (i) the length scale over which the orientational order extends is >5 nm and (ii) short-range (<1 nm) structural changes cannot account for the observed changes. From this analysis, which is presented fully in the Supplementary Materials (sections S3 and S4, fig. S3, and table S2), it is easy to see that the collective orientational order could extend as far as 19 to 70 hydration shells (table S2).
Distortion of the H-bond network over nanoscopic distances
Next, we want to determine whether the observed increase in orientational order depends on the chemical structure and charge of the ions, and which interactions are involved most prominently. We addressed this question by repeating these experiments for 20 other electrolytes with a nonpolar neutral molecule (CCl4) as a control. Figure 2A shows the PoutPinPin fs-ESHS intensity in the same ionic strength range for a monovalent Cl− cation series (NH4Cl, KCl, NaCl, LiCl, and HCl) and for a Na+ anion series (NaH2PO4, NaOH, NaCl, NaBr, NaI, NaNO3, NaClO4, and NaSCN). The divalent cationic–monovalent anionic pairs (MgCl2, CaCl2, SrCl2, and BaCl2), the monovalent cationic–divalent anionic pairs (Na2S2O3 and Na2SO4), and the divalent cationic–anionic pairs (BeSO4, MgSO4, and CaSO4) are also shown. For all electrolyte solutions, the same trend is observed: a rise in intensity up to a plateau. In contrast, for nonionic CCl4, the fs-ESHS intensity remains unchanged. Note that the ionic strengths at which the curves change slope, as well as the relative intensity of the plateau, are independent of the electrolyte used. Thus, there is no dependence on the ionic radius, the polarizability of the ion, or the chemical structure of the ions. This absence of ion specificity is consistent with the notion that the fs-ESHS signal generated by the immediate neighborhood of the ion is negligible (see sections S3 and S4 and fig. S3).
Fig. 2. Nonspecific long-range changes in the H-bond network of water.

(A) fs-ESHS intensities, relative to that of pure water, of 21 different electrolyte solutions obtained at a scattering angle of 90o (PoutPinPin polarization combination). The relative intensities of all electrolyte solutions can be fitted with the same equation. The dashed line indicates the concentration of half saturation. fs-ESHS intensities for CCl4 are also plotted [the x axis should be read here as “Concentration (μM)”]. (B) fs-ESHS intensities of NaCl in H2O and D2O (PoutPinPin polarization combination). (C) Water-water orientational correlations (left) and corresponding changes in average tilt angles (right) obtained from a molecular dynamics simulation of pure water. (D) Ion-induced change in the orientational order for an 8 mM NaCl solution. Changes in the distance-weighed water-water orientational correlations are shown (left axis), as well as the corresponding changes in the distance-weighted average tilt angle per water molecule (right axis).
Thus far, the origin of the increase in orientational order observed in Figs. 1C and 2A has not been attributed to any specific type of interactions. Ion-dipole interactions as captured by a mean-field description are a candidate, but so are collective H-bond interactions between water molecules that are distorted by electrolytes. In the Supplementary Materials (section S7), we consider a Debye-Hückel model that treats water as an ideal gas of dipoles, in which ions interact by means of ion-dipole interactions. This model predicts that the fs-ESHS response saturates as a function of ionic strength. The fs-ESHS response is also expected to scale as 1/temperature. Light water and heavy water have comparable dipole moments and dielectric constants (1.8546 D/1.8558 D and 78.45/78.08 for H2O/D2O; table S1) and thus generate identical fs-ESHS responses within this framework. However, we observe that the temperature-dependent fs-ESHS response (fig. S5B) does not follow the trend found by the Debye-Hückel model. Furthermore, bulk D2O generates an ~40% larger fs-ESHS intensity than bulk H2O, and also generates different second harmonic polarization ratios (section S6 and fig. S4). Accordingly, the scattering patterns for pure light water and heavy water are not consistent with ideal gas behavior. Figure 2B compares the fs-ESHS measurements of NaCl dissolved in H2O and D2O (PoutPinPin polarizations). The intensity change up to the plateau for D2O solutions is 9 ± 3% (instead of 30 ± 3% for H2O, a factor of ~3.3). The ionic strength at half saturation is 310 ± 71 μM for D2O (instead of 55 ± 5 μM for H2O, a factor of 6 ± 1.9). Although the Debye-Hückel model saturates as a function of ionic strength, it predicts a saturated fs-ESHS response that is a factor of 20 (for D2O) or a factor of 6 (for H2O) larger than the measurement. The onset of the increase is either on the order of the observed value (H2O) or off by a factor of 7 (D2O). Within the Debye-Hückel framework, there are no adjustable parameters that can account for any of these effects.
Orientational order arising from H-bond interactions has not been considered relevant in the interpretation of second harmonic data from bulk water (43, 44). However, surface second harmonic scattering experiments from aqueous interfaces of oil nanodroplets in aqueous solutions (45, 46) hint at the importance of H-bonding. Including H-bond interactions here will likely modulate the fs-ESHS signal and may reduce the orientational order found from the Debye-Hückel model. Indeed, liquid water derives its unique properties from its three-dimensional H-bond network, which ensures that some degree of structural orientational order is present. This can be demonstrated with a molecular dynamics simulation of 264,000 (TIP4P 2005) water molecules that includes both ion-dipole and dipole-dipole interactions. Such a large simulation box (or an even larger one) is necessary to approach the low concentration limit that is probed by the experiments and to reduce finite-size artifacts in the electrostatic potential. Figure 2C shows the orientational order in water (that is, the water-water orientational correlations among all pairs of water molecules) as a function of distance. At water-water distances of R < 1 nm, water molecules experience changes in their orientational distribution on the order of 10° to 20° per molecule. Ions will distort this distribution by means of ion-dipole interactions and by changing the H-bond network of water, which are both probed in the fs-ESHS measurements. The fs-ESHS response is represented by (where φ is the angle between the dipoles of a pair of water molecules; section S5 and Eq. 10 in the Supplementary Materials). Figure 2D shows the distance dependence of the ion-induced change in the fs-ESHS response, that is, it shows the difference in the average orientational distribution with and without 8 mM NaCl (〈cos φ〉c − 〈cos φ〉0) multiplied by R2. The resulting distance-weighted angular distortion is plotted on the right axis. Perturbations with a magnitude of ~0.02°∙nm2 are induced by the presence of ions and persist over length scales >8 nm (here limited by the size of the simulation box). Figure 2 (C and D) shows that water-water interactions are very strong but short-ranged (involving less than ~100 molecules), whereas ion-induced water-water correlations are long-ranged but small (involving on the order of ~104 molecules, limited by the size of the simulation box).
Nuclear quantum effects
The contribution of H-bond interactions offers an explanation for the phenomenological difference between light water and heavy water. The strength of the H-bond in H2O and D2O is different and is modulated by nuclear quantum effects. The bending mode of the H-bond (Fig. 1A) in D2O is stronger than that in H2O, whereas the stretching mode of the H-bond displays the opposite behavior. Isotope effects are usually not more than a few percentages in magnitude because of the competition of these opposite quantum effects along the two different molecular axes displayed in Fig. 1A (47–49). In the data of Fig. 2B, a bigger difference between H2O and D2O is found because only one of the two modes (the bending H-bond motion) modulates the fs-ESHS response. A stronger H-bond in D2O (along the bend axis) consistently implies a higher fs-ESHS intensity of pure D2O, a higher ionic strength for the half saturation, and a smaller relative saturation intensity.
Thus, electrolyte concentrations as low as 10 μM induce orientational order in water that amounts to a fraction of a degree. At such concentrations, each ion is surrounded by 2.75 × 10⁶ water molecules. Therefore, although the magnitude of the change in orientation order is small, the total cooperative effect can be significant. Macroscopic properties might be influenced, too, if they report on changes in orientational order. We will explore macroscopic changes next.
Orientational order probed macroscopically
Surface tension measures the work needed to create a unit surface area of liquid-vapor interface. Adding electrolytes to water leads to a change in the surface tension Δγ. The change in Δγ is in turn linked to a net surface excess or depletion of the electrolyte at the interface by the Gibbs adsorption equation. Indeed, for electrolytes at molar concentrations, the surface is depleted relative to the bulk, leading to an increase in surface tension (that is, Δγ > 0) (50). At concentrations <1 mM, which are much smaller than those at which depletion effects become measurable, Jones and Ray (51) measured a decreasing Δγ that reaches a minimum at a concentration of ~1 mM, using the capillary rise method. A possible explanation for this observation is that, at such low concentrations, the decrease in Δγ does not stem from the surface segregation of the bare ions, but rather from the relative stability of the weakly oriented water that surrounds the ions. An increase in the orientational order of the water H-bond network entails an entropic penalty that is greater in the bulk than at the surface, leading to a net favorable interaction with the surface and, hence, to a decrease in Δγ.
To verify this hypothesis, we measured (i) the concentration-dependent surface adsorption of ions by means of resonant second harmonic measurements in reflection mode (Fig. 3B) and (ii) compared the Δγ values of electrolyte solutions at different ionic strengths for light water and heavy water up to 100 mM (Fig. 3C). Starting with the first set of experiments, second harmonic measurements in reflection mode were recorded under resonant conditions, probing the charge-transfer-to-solvent (CTTS) transition of I− present in NaI and KI solutions. The surface activity of I− is found from spectral decomposition and is plotted for NaI and KI solutions as |χ(2)|2 in Fig. 3B (black and red data). The I− surface second harmonic generation (SHG) signal increases at micromolar concentrations close to the minimum of the surface tension measurements and then saturates at ~100 mM. Other salts that have an optically accessible CTTS transition, such as K4Fe(CN)6, also lead to changes in the surface second harmonic signal. The smaller halide ions have CTTS transitions at shorter wavelengths that are not optically accessible. The changes in the surface SHG signal were nonetheless interpreted as nonspecific (52, 54). The bulk fs-ESHS response for NaCl and NaI solutions is also shown (blue and green data). As discussed, it shows that the orientational order of bulk water is changed at ~1 mM. The ionic strength for the half saturation of both curves (55 μM and 4 mM) is different by ~2 orders of magnitude.
Fig. 3. Macroscopic manifestation of orientational order in the H-bond network of aqueous electrolyte solutions.

(A) An illustration of the concept of surface tension. (B) Normalized resonant I− surface second harmonic response of NaI and KI (|χ(2)|2; black and red data) (52) and normalized fs-ESHS (bulk) intensity change originating from constraints in the orientational order of bulk water (blue and green data). Ion-induced changes in the H-bond network of bulk water occur at lower concentrations (55 μM) than the surface adsorption (4 mM). The saturation of the bulk structural changes coincides with the minimum in Δγ (dashed line). The top panel shows an illustration of resonant surface SHG. VIS, visible; UV, ultraviolet; GS, ground state. (C). Measured surface tension difference (Δγ) for NaCl solutions of H2O (blue data) and D2O (brown data). Above 20 mM, Δγ increases, as indicated by the dashed line [see Jarvis and Scheiman (53)]. A cartoon illustrating the structural changes in the electrolyte solution is shown on top. The numbers correspond to the different regimes of ionic strength and are also indicated in (B).
Figure 3C shows the second set of experiments: Δγ recorded for NaCl solutions in H2O and D2O using the Wilhelmy plate method (55). As worked out in detail in section S8, here, Δγ reports on the ion-induced free-energy change involved in creating a water-air surface, with an accuracy of 0.1% (0.072 mJ/m2). It can be seen in Fig. 3C that Δγ reaches a minimum at 2 ± 1 mM for NaCl in H2O and at 14 ± 0.5 mM for D2O (that is, at an ~7× higher ionic strength than for H2O). Beyond ~20 mM (H2O), Δγ increases (50, 51). Within the error of the measurements, the concentrations for which the minima are reached are the same as the ones for which the fs-ESHS signal saturates for both H2O and D2O (Fig. 2B). The difference equals the phenomenological factor of ~6 observed in the fs-ESHS measurements (Fig. 2B). Because surface tension measurements cannot distinguish between the different axes along which H-bonds can be formed/broken (Fig. 1A), the magnitude of Δγ is expected, and observed, to be the same for H2O and D2O. In agreement with this observation, interfacial isotope effects are small: Sum frequency experiments on isotopic mixtures at the air-water interface indicate no substantial isotope effect (56) or, at most, a 4% isotope effect (57).
Thus, although the change in the orientational order of a single water molecule is small, the collective effect appears to be linked to macroscopically detectable distortions in the H-bond network of water. This is a remarkable display of how an accumulation of a small yet quantifiable distortion may result in macroscopic effects. Water plays an omnipresent role in physics, chemistry, biology, and medicine, and subtle effects can have significant consequences for equilibrium and nonequilibrium processes. The observed effects may well be relevant to a wide variety of phenomena, and the sizeable difference observed between H2O and D2O provides us with a handle to understand and verify models aimed at understanding nuclear quantum effects in aqueous systems.
SUMMARY AND CONCLUSIONS
In summary, we observe electrolyte-induced perturbations in the H-bond network of liquid water that start to appear at ionic strengths <10 μM. The changes level off at ~1 mM, are constant up to ~0.1 M, and can be explained as an increase in orientational order in the H-bond network of water. The observed perturbations are independent of the chemical nature of the 21 ion pairs used, indicating a universal effect that is also present at physiological electrolyte concentrations. The observed constraint in the orientational order of water molecules is also detectable macroscopically: The decrease in surface tension measured at micromolar concentrations points to a qualitative change in the surface propensity of ions that can be explained in terms of the collective interaction between nanoscopic “ordered domains” of water around ions and the interface. The H-bond restructuring observed in the fs-ESHS measurements occurs in both H2O and D2O, but the comparative response of D2O is a factor of ~3 lower in relative fs-ESHS intensity than that of H2O, and occurs at an ~6× higher electrolyte concentration. This is consistent with H-bonds being stronger in D2O than in H2O as a result of nuclear quantum effects, which leads to smaller perturbations in heavy water than in light water. This large difference in the onset concentration is also observed in surface tension measurements, suggesting a further link between nanoscopic and macroscopic length scales.
MATERIALS AND METHODS
Sample preparations
CCl4 (99.9%, Sigma-Aldrich), LiCl (99.999%, Sigma-Aldrich), NaCl [99.999% (Acros) for fs-ESHS measurements and 99.999% (Sigma-Aldrich) for surface tension measurements], KCl (99.999%, Acros), MgCl2 (99.99%, Sigma-Aldrich), CaCl2 (99.99%, Sigma-Aldrich), SrCl2 (99.99%, Sigma-Aldrich), BaCl2⋅2H2O (99.9999%, Alfa Aesar), NaNO3 (99.999%, Fluka), NaBr (99.995%, Fluka), NaI (99.999%, Sigma-Aldrich), NaH2PO4 (99.999%, Fluka), NH4Cl (99.9995%, Fluka), NaSCN (99.99%, Sigma-Aldrich), Na2S2O3 (99.99%, Sigma-Aldrich), Na2SO4 (99.99%, Sigma-Aldrich), BeSO4⋅4H2O (99.99%, Sigma-Aldrich), MgSO4 (99.99%, Sigma-Aldrich), CaSO4 (99.99%, Sigma-Aldrich), NaClO4 (99.0%, Acros), NaOH (99.99%, Sigma-Aldrich), and HCl (Ultrpur, Merck) were used as received, without further purification. All samples were made by dissolving the electrolytes in degassed ultrapure water to obtain a stock solution with a high concentration. To purify H2O, we used a Milli-Q UF-Plus instrument (Millipore Inc.) for the fs-ESHS measurements and a NANOpure Ultrapure Water System (Barnstead) for the surface tension measurements, with an electrical resistance of 18.2 megohm⋅cm. For the experiments with heavy water, degassed D2O was used: D2O (99.8% d, >2 megohm⋅cm, Armar) for the fs-ESHS measurements and D2O (99.9% d, Cambridge Isotope Laboratories) for the surface tension measurements. The stock solutions were filtered (Millipore Millex-VV 0.1-μm polyvinylidene difluoride membrane filters) and diluted to the desired concentration.
Femtosecond elastic second harmonic scattering
fs-ESHS measurements were performed, as previously described in detail (31), using 190-fs laser pulses centered at 1028 nm at a 200-kHz repetition rate. The polarization of the input pulses is controlled by a Glan-Taylor polarizer (GT10-B, Thorlabs) and a zero-order half-wave plate (WPH05M-1030). The filtered (FEL0750, Thorlabs) input pulses with a pulse energy of 0.3 μJ (incident laser power P = 60 mW) were focused into a cylindrical glass sample cell (inner diameter, 4.2 mm) with a waist diameter of ~35 μm and a Rayleigh length of 0.94 mm. The scattered second harmonic light was collected with a planoconvex lens (f = 5 cm), and then filtered (ET525/50, Chroma), polarized (GT10-A, Thorlabs), and finally focused into a gated photomultiplier tube (H7421-40, Hamamatsu). The detection angle was set to 90° with an acceptance angle of 11.4°. Data points were acquired with an acquisition time of 50 × 1 s [that is, using 50 × (2 ×105) pulses in total] and a gate width of 10 ns. The fs-ESHS signal of pure H2O (Figs. 1C and 2, A and B) or D2O (Fig. 2B) was measured between every two samples and was used as a reference. The reproducibility of the fs-ESHS measurements was 1 to 3%. Samples were stored and measured in sealed glass sample cells. All measurements were performed in a temperature- and humidity-controlled room (T = 297 K; relative humidity, 26.0%). The obtained relative intensities as a function of ionic strength were fitted with a Langmuir equation whose functional form is given by , where ρ is the ion concentration and A and C are constants. The temperature-dependent measurements were performed by placing the sample cell in a temperature controller (Quantum Northwest).
Molecular dynamics simulations
Classical molecular dynamics simulations were performed using the GROMACS 5.0.4 package (58). The TIP4P-2005 model (59) was chosen for the water molecules, and the CHARMM36 (60) parameters were chosen for the sodium and chloride ions. Cubic simulation boxes, with a side of about 20 nm, were prepared by combining about 264,000 water molecules with randomly distributed pairs of ions, up to the desired concentration. After initial equilibration, simulations were run for 50 ns, and snapshots of the instantaneous configurations of water and ions were saved for further processing.
Surface tension measurements
Surface tension measurements were performed with an Attension Sigma 701 Force Tensiometer (Biolin Scientific), which was equipped with an Attension Pt Wilhelmy plate (Biolin Scientific). This instrument was placed on a Micro-g Lab Table (TMC), located in an ISO class 6 (1000 p/ft3) Cleanroom (Clean Air Products), to minimize environmental noise and to reduce atmospheric dust. All solutions were kept and measured in glassware, which was previously treated with a standard Piranha glass cleaning procedure. Namely, the glassware was first treated for a minimum of 5 min with a 3:1 mixture of concentrated sulfuric acid (95 to 98%, Sigma-Aldrich) and hydrogen peroxide solution (30%, Macron Fine Chemicals). After this process, the glassware was washed with copious amounts of water. Each sample solution was scanned a minimum of 40 times, and every surface tension value was reproduced independently at least 5 times.
Supplementary Material
Acknowledgments
Funding: This work was supported by the Julia Jacobi Foundation, the Swiss National Science Foundation (grant number 200021_140472), and the European Research Council (grant number 616305). P.B.P. and P.S.C. were supported by the National Science Foundation (award numbers CHE-1151079 and CHE-1413307). Author contributions: Y.C., N.G., H.I.O., and C.M.-R. performed experimental measurements and reproducibility validations. Y.C., G.T., D.M.W., C.L., and M.C. performed analytical computations and modeling. S.R., P.B.P., and Y.C. wrote the manuscript. P.S.C. suggested and supervised surface tension measurements. S.R. conceived and supervised the work, and contributed to the data analysis. Competing interests: The authors declare that they have no competing interests. Data and materials availability: All data needed to evaluate the conclusions in the paper are present in the paper and/or the Supplementary Materials. Additional data related to this paper may be requested from the authors.
SUPPLEMENTARY MATERIALS
Supplementary material for this article is available at http://advances.sciencemag.org/cgi/content/full/2/4/e1501891/DC1
S1. Constants and properties of H2O and D2O
S2. Femtosecond elastic second harmonic scattering
S3. Phenomenological discussion of the response of spherical domains
S4. Spherical domain size dependence of the fs-ESHS signal
S5. Molecular dynamics simulations
S6. fs-ESHS from pure H2O and D2O
S7. Mean-field models
S8. Surface tension measurements and interpretation
Table S1. Constants and properties of H2O and D2O.
Table S2. Domain radius, corresponding number of hydration shells, and anisotropy in case the domain size is only determined by the average ion separation.
Fig. S1. Elastic and inelastic second harmonic scattering.
Fig. S2. Sketch of the relevant parameters needed in the phenomenological discussion.
Fig. S3. ΔI as a function of domain size and relative structural anisotropy.
Fig. S4. fs-ESHS patterns for pure H2O and pure D2O.
Fig. S5. Mean-field models and temperature dependence.
REFERENCES AND NOTES
- 1.Marcus Y., Effect of ions on the structure of water: Structure making and breaking. Chem. Rev. 109, 1346–1370 (2009). [DOI] [PubMed] [Google Scholar]
- 2.Ball P., Water as an active constituent in cell biology. Chem. Rev. 108, 74–108 (2008). [DOI] [PubMed] [Google Scholar]
- 3.Tobias D. J., Hemminger J. C., Getting specific about specific ion effects. Science 319, 1197–1198 (2008). [DOI] [PubMed] [Google Scholar]
- 4.Kunz W., Specific ion effects in liquids, in biological systems, and at interfaces. Pure Appl. Chem. 78, 1611–1617 (2006). [Google Scholar]
- 5.Zhang Y. J., Cremer P. S., Chemistry of Hofmeister anions and osmolytes. Annu. Rev. Phys. Chem. 61, 63–83 (2010). [DOI] [PubMed] [Google Scholar]
- 6.Jungwirth P., Cremer P. S., Beyond Hofmeister. Nat. Chem. 6, 261–263 (2014). [DOI] [PubMed] [Google Scholar]
- 7.Howell I., Neilson G. W., Li+ hydration in concentrated aqueous solution. J. Phys. Condens. Matter 8, 4455–4463 (1996). [Google Scholar]
- 8.Mancinelli R., Botti A., Bruni F., Ricci M. A., Soper A. K., Perturbation of water structure due to monovalent ions in solution. Phys. Chem. Chem. Phys. 9, 2959–2967 (2007). [DOI] [PubMed] [Google Scholar]
- 9.Soper A. K., Weckström K., Ion solvation and water structure in potassium halide aqueous solutions. Biophys. Chem. 124, 180–191 (2006). [DOI] [PubMed] [Google Scholar]
- 10.Bouazizi S., Nasr S., Jaîdane N., Bellissent-Funel M.-C., Local order in aqueous NaCl solutions and pure water: X-ray scattering and molecular dynamics simulations study. J. Phys. Chem. B 110, 23515–23523 (2006). [DOI] [PubMed] [Google Scholar]
- 11.Bouazizi S., Nasr S., Local order in aqueous lithium chloride solutions as studied by X-ray scattering and molecular dynamics simulations. J. Mol. Struct. 837, 206–213 (2007). [Google Scholar]
- 12.Waluyo I., Nordlund D., Bergmann U., Schlesinger D., Pettersson L. G. M., Nilsson A., A different view of structure-making and structure-breaking in alkali halide aqueous solutions through x-ray absorption spectroscopy. J. Chem. Phys. 140, 244506 (2014). [DOI] [PubMed] [Google Scholar]
- 13.Nilsson A., Nordlund D., Waluyo I., Huang N., Ogasawara H., Kaya S., Bergmann U., Näslund L.-Å., Öström H., Wernet P., Andersson K. J., Schiros T., Pettersson L. G. M., X-ray absorption spectroscopy and X-ray Raman scattering of water and ice; an experimental view. J. Electron Spectrosc. 177, 99–129 (2010). [Google Scholar]
- 14.Smith J. D., Saykally R. J., Geissler P. L., The effects of dissolved halide anions on hydrogen bonding in liquid water. J. Am. Chem. Soc. 129, 13847–13856 (2007). [DOI] [PubMed] [Google Scholar]
- 15.Buchner R., Hefter G. T., May P. M., Dielectric relaxation of aqueous NaCl solutions. J. Phys. Chem. A 103, 1–9 (1999). [Google Scholar]
- 16.Marcus Y., Hefter G., Ion pairing. Chem. Rev. 106, 4585–4621 (2006). [DOI] [PubMed] [Google Scholar]
- 17.Yoshida K., Ibuki K., Ueno M., Estimated ionic B-coefficients from NMR measurements in aqueous electrolyte solutions. J. Solut. Chem. 25, 435–453 (1996). [Google Scholar]
- 18.Tielrooij K. J., Garcia-Araez N., Bonn M., Bakker H. J., Cooperativity in ion hydration. Science 328, 1006–1009 (2010). [DOI] [PubMed] [Google Scholar]
- 19.Omta A. W., Kropman M. F., Woutersen S., Bakker H. J., Negligible effect of ions on the hydrogen-bond structure in liquid water. Science 301, 347–349 (2003). [DOI] [PubMed] [Google Scholar]
- 20.Cowan M. L., Bruner B. D., Huse N., Dwyer J. R., Chugh B., Nibbering E. T. J., Elsaesser T., Miller R. J. D., Ultrafast memory loss and energy redistribution in the hydrogen bond network of liquid H2O. Nature 434, 199–202 (2005). [DOI] [PubMed] [Google Scholar]
- 21.Heisler I. A., Meech S. R., Low-frequency modes of aqueous alkali halide solutions: Glimpsing the hydrogen bonding vibration. Science 327, 857–860 (2010). [DOI] [PubMed] [Google Scholar]
- 22.Funkner S., Niehues G., Schmidt D. A., Heyden M., Schwaab G., Callahan K. M., Tobias D. J., Havenith M., Watching the low-frequency motions in aqueous salt solutions: The terahertz vibrational signatures of hydrated ions. J. Am. Chem. Soc. 134, 1030–1035 (2012). [DOI] [PubMed] [Google Scholar]
- 23.O’Brien J. T., Williams E. R., Effects of ions on hydrogen-bonding water networks in large aqueous nanodrops. J. Am. Chem. Soc. 134, 10228–10236 (2012). [DOI] [PubMed] [Google Scholar]
- 24.Prell J. S., O’Brien J. T., Williams E. R., Structural and electric field effects of ions in aqueous nanodrops. J. Am. Chem. Soc. 133, 4810–4818 (2011). [DOI] [PubMed] [Google Scholar]
- 25.Ohtaki H., Radnai T., Structure and dynamics of hydrated ions. Chem. Rev. 93, 1157–1204 (1993). [Google Scholar]
- 26.Ceriotti M., Tribello G. A., Parrinello M., Demonstrating the transferability and the descriptive power of sketch-map. J. Chem. Theory Comput. 9, 1521–1532 (2013). [DOI] [PubMed] [Google Scholar]
- 27.P. Hünenberger, M. Reif, Single-Ion Solvation: Experimental and Theoretical Approaches to Elusive Thermodynamic Quantities (Royal Society of Chemistry, Cambridge, UK, 2011). [Google Scholar]
- 28.Stirnemann G., Wernersson E., Jungwirth P., Laage D., Mechanisms of acceleration and retardation of water dynamics by ions. J. Am. Chem. Soc. 135, 11824–11831 (2013). [DOI] [PubMed] [Google Scholar]
- 29.Kunz W., Specific ion effects in colloidal and biological systems. Curr. Opin. Colloid Interface Sci. 15, 34–39 (2010). [Google Scholar]
- 30.Zhang Y., Cremer P., Interactions between macromolecules and ions: The Hofmeister series. Curr. Opin. Chem. Biol. 10, 658–663 (2006). [DOI] [PubMed] [Google Scholar]
- 31.Gomopoulos N., Lütgebaucks C., Sun Q., Macias-Romero C., Roke S., Label-free second harmonic and hyper Rayleigh scattering with high efficiency. Opt. Express 21, 815–821 (2013). [DOI] [PubMed] [Google Scholar]
- 32.Bersohn R., Pao Y.-H., Frisch H. L., Double-quantum light scattering by molecules. J. Chem. Phys. 46, 3184 (1966). [Google Scholar]
- 33.Kauranen M., Persoons A., Theory of polarization measurements of second-order nonlinear light scattering. J. Chem. Phys. 104, 3445 (1996). [Google Scholar]
- 34.Clays K., Persoons A., Hyper-Rayleigh scattering in solution. Rev. Sci. Instrum. 63, 3285–3289 (1992). [Google Scholar]
- 35.Dadap J. I., Shan J., Heinz T. F., Theory of optical second-harmonic generation from a sphere of centrosymmetric material: Small-particle limit. J. Opt. Soc. Am. B 21, 1328–1347 (2004). [Google Scholar]
- 36.Roke S., Gonella G., Nonlinear light scattering and spectroscopy of particles and droplets in liquids. Annu. Rev. Phys. Chem. 63, 353–378 (2012). [DOI] [PubMed] [Google Scholar]
- 37.Fecko C. J., Eaves J. D., Loparo J. J., Tokmakoff A., Geissler P. L., Ultrafast hydrogen-bond dynamics in the infrared spectroscopy of water. Science 301, 1698–1702 (2003). [DOI] [PubMed] [Google Scholar]
- 38.Ohkubo J., Kato T., Kono H., Fujimura Y., Molecular alignment in a liquid induced by a nonresonant laser field: Molecular dynamics simulation. J. Chem. Phys. 120, 9123 (2004). [DOI] [PubMed] [Google Scholar]
- 39.de Beer A. G. F., Roke S., Dadap J. I., Theory of optical second-harmonic and sum-frequency scattering from arbitrarily shaped particles. J. Opt. Soc. Am. B 28, 1374–1384 (2011). [Google Scholar]
- 40.P. N. Butcher, D. Cotter, The Elements of Nonlinear Optics (Cambridge Univ. Press, Cambridge, 1991). [Google Scholar]
- 41.Shelton D. P., Electric field of Ions in solution probed by hyper-Rayleigh scattering. J. Chem. Phys. 130, 114501 (2009). [DOI] [PubMed] [Google Scholar]
- 42.Shelton D. P., Hyper-Rayleigh scattering from correlated molecules. J. Chem. Phys. 138, 154502 (2013). [DOI] [PubMed] [Google Scholar]
- 43.Shelton D. P., Long-range orientation correlation in liquids. J. Chem. Phys. 136, 044503 (2012). [DOI] [PubMed] [Google Scholar]
- 44.Shelton D. P., Long-range orientation correlation in water. J. Chem. Phys. 141, 224506 (2014). [DOI] [PubMed] [Google Scholar]
- 45.Chen Y., Jena K. C., Roke S., From hydrophobic to hydrophilic: The structure and density of the hexadecane droplet/alkanol/water interface. J. Phys. Chem. C 119, 17725–17734 (2015). [Google Scholar]
- 46.Scheu R., Chen Y., de Aguiar H. B., Rankin B. M., Ben-Amotz D., Roke S., Specific ion effects in amphiphile hydration and interface stabilization. J. Am. Chem. Soc. 136, 2040–2047 (2014). [DOI] [PubMed] [Google Scholar]
- 47.Habershon S., Markland T. E., Manolopoulos D. E., Competing quantum effects in the dynamics of a flexible water model. J. Chem. Phys. 131, 024501 (2009). [DOI] [PubMed] [Google Scholar]
- 48.Li X.-Z., Walker B., Michaelides A., Quantum nature of the hydrogen bond. Proc. Natl. Acad. Sci. U.S.A. 108, 6369–6373 (2011). [Google Scholar]
- 49.Berendsen H. J. C., Postma J. P. M., van Gunsteren W. F., DiNola A., Haak J. R., Molecular dynamics with coupling to an external bath. J. Chem. Phys. 81, 3684 (1984). [Google Scholar]
- 50.Jungwirth P., Tobias D. J., Specific ion effects at the air/water interface. Chem. Rev. 106, 1259–1281 (2006). [DOI] [PubMed] [Google Scholar]
- 51.Jones G., Ray W. A., The surface tension of solutions of electrolytes as a function of the concentration. I. A differential method for measuring relative surface tension. J. Am. Chem. Soc. 59, 187–198 (1937). [Google Scholar]
- 52.Petersen P. B., Johnson J. C., Knutsen K. P., Saykally R. J., Direct experimental validation of the Jones–Ray effect. Chem. Phys. Lett. 397, 46–50 (2004). [Google Scholar]
- 53.Jarvis N. L., Scheiman M. A., Surface potentials of aqueous electrolyte solutions. J. Phys. Chem. 72, 74–78 (1968). [Google Scholar]
- 54.Petersen P. B., Saykally R. J., Adsorption of ions to the surface of dilute electrolyte solutions: The Jones−Ray effect revisited. J. Am. Chem. Soc. 127, 15446–15452 (2005). [DOI] [PubMed] [Google Scholar]
- 55.A. W. Adamson, A. P. Gast, Physical Chemistry of Surfaces (Wiley-Interscience, Sydney, 1997). [Google Scholar]
- 56.Liu J., Andino R. S., Miller C. M., Chen X., Wilkins D. M., Ceriotti M., Manolopoulos D. E., A surface-specific isotope effect in mixtures of light and heavy water. J. Phys. Chem. C 117, 2944–2951 (2013). [Google Scholar]
- 57.Nagata Y., Pool R. E., Backus E. H. G., Bonn M., Nuclear quantum effects affect bond orientation of water at the water-vapor interface. Phys. Rev. Lett. 109, 226101–226105 (2012). [DOI] [PubMed] [Google Scholar]
- 58.Lindahl E., Hess B., van der Spoel D., GROMACS 3.0: A package for molecular simulation and trajectory analysis. J. Mol. Model. 7, 306–317 (2001). [Google Scholar]
- 59.Abascal J. L. F., Vega C., A general purpose model for the condensed phases of water: TIP4P/2005. J. Chem. Phys. 123, 234505 (2005). [DOI] [PubMed] [Google Scholar]
- 60.Zhu X., Lopes P. E. M., MacKerell A. D. Jr, Recent developments and applications of the CHARMM force fields. WIREs Comput. Mol. Sci. 2, 167–185 (2012). [DOI] [PMC free article] [PubMed] [Google Scholar]
- 61.Kedenburg S., Vieweg M., Gissibl T., Giessen H., Linear refractive index and absorption measurements of nonlinear optical liquids in the visible and near-infrared spectral region. Opt. Mater. Express 2, 1588–1611 (2012). [Google Scholar]
- 62.Clough S. A., Beers Y., Klein G. P., Rothman L. S., Dipole moment of water from Stark measurements of H2O, HDO, and D2O. J. Chem. Phys. 59, 2254–2259 (1973). [Google Scholar]
- 63.Gubskaya A. V., Kusalik P. G., The total molecular dipole moment for liquid water. J. Chem. Phys. 117, 5290–5302 (2002). [Google Scholar]
- 64.Barthel J., Bachhuber K., Buchner R., Hetzenauer H., Dielectric spectra of some common solvents in the microwave region. Water and lower alcohols. Chem. Phys. Lett. 165, 369–373 (1990). [Google Scholar]
- 65.Srinivasan K., Kay R. L., Pressure dependence of the dielectric constant of H2O and D2O. J. Chem. Phys. 60, 3645–3649 (1974). [Google Scholar]
- 66.Kobayashi T., Sasagane K., Aiga F., Yamaguchi K., Calculation of frequency-dependent first hyperpolarizabilities using the second-order Møller–Plesset perturbation theory. J. Chem. Phys. 110, 11720–11733 (1999). [Google Scholar]
- 67.Christiansen O., Gauss J., Stanton J. F., Frequency-dependent polarizabilities and first hyperpolarizabilities of CO and H2O from coupled cluster calculations. Chem. Phys. Lett. 305, 147–155 (1999). [Google Scholar]
- 68.Luo Y., Ågren H., Vahtras O., Jørgensen P., Spirko V., Hettema H., Frequency-dependent polarizabilities and first hyperpolarizabilities of H2O. J. Chem. Phys. 98, 7159–7164 (1993). [Google Scholar]
- 69.Bishop D. M., Kirtman B., Kurtz H. A., Rice J. E., Calculation of vibrational dynamic hyperpolarizabilities for H2O, CO2, and NH3. J. Chem. Phys. 98, 8024–8030 (1993). [Google Scholar]
- 70.Shelton D. P., Gas phase hyper-Rayleigh scattering measurements. J. Chem. Phys. 137, 044312 (2012). [DOI] [PubMed] [Google Scholar]
- 71.Gubskaya A. V., Kusalik P. G., The multipole polarizabilities and hyperpolarizabilities of the water molecule in liquid state: An ab initio study. Mol. Phys. 99, 1107–1120 (2001). [Google Scholar]
- 72.Roke S., Roeterdink W. G., Wijnhoven J. E. G. J., Petukhov A. V., Kleyn A. W., Bonn M., Vibrational sum frequency scattering from a submicron suspension. Phys. Rev. Lett. 91, 258302 (2003). [DOI] [PubMed] [Google Scholar]
- 73.de Beer A. G. F., Roke S., Sum frequency generation scattering from the interface of an isotropic particle: Geometrical and chiral effects. Phys. Rev. B 75, 245438 (2007). [Google Scholar]
- 74.de Beer A. G. F., Roke S., Nonlinear Mie theory for second-harmonic and sum-frequency scattering. Phys. Rev. B 79, 155420–155429 (2009). [Google Scholar]
- 75.Roke S., Bonn M., Petukhov A. V., Nonlinear optical scattering: The concept of effective susceptibility. Phys. Rev. B 70, 115106–115110 (2004). [Google Scholar]
- 76.de Beer A. G. F., Campen R. K., Roke S., Separating surface structure and surface charge with second-harmonic and sum-frequency scattering. Phys. Rev. B 82, 235431 (2010). [Google Scholar]
- 77.de Beer A. G. F., Roke S., Obtaining molecular orientation from second harmonic and sum frequency scattering experiments in water: Angular distribution and polarization dependence. J. Chem. Phys. 132, 234702 (2010). [DOI] [PubMed] [Google Scholar]
- 78.Hendrickx E., Clays K., Persoons A., Hyper-Rayleigh scattering in isotropic solution. Acc. Chem. Res. 31, 675–683 (1998). [Google Scholar]
- 79.Miyamoto S., Kollman P. A., Settle: An analytical version of the SHAKE and RATTLE algorithm for rigid water models. J. Comput. Chem. 13, 952–962 (1992). [Google Scholar]
- 80.Darden T., York D., Pedersen L., Particle mesh Ewald: An N⋅log(N) method for Ewald sums in large systems. J. Chem. Phys. 98, 10089 (1993). [Google Scholar]
- 81.Bussi G., Donadio D., Parrinello M., Canonical sampling through velocity rescaling. J. Chem. Phys. 126, 014101 (2007). [DOI] [PubMed] [Google Scholar]
- 82.Shelton D. P., Rice J. E., Measurements and calculations of the hyperpolarizabilities of atoms and small molecules in the gas phase. Chem. Rev. 94, 3–29 (1994). [Google Scholar]
- 83.Ong S., Zhao X., Eisenthal K. B., Polarization of water molecules at a charged interface: Second harmonic studies of the silica/water interface. Chem. Phys. Lett. 191, 327–335 (1992). [Google Scholar]
- 84.J.-L. Barrat, J.-P. Hansen, Basic Concepts for Simple and Complex Liquids (Cambridge Univ. Press, Cambridge, 2003). [Google Scholar]
- 85.B. J. Berne, R. Pecora, Dynamic Light Scattering (Wiley-Interscience, New York, 1976). [Google Scholar]
- 86.N. H. March, P. Tosi, Atomic Dynamics in Liquids (Dover, New York, 1991). [Google Scholar]
- 87.Bewig K. W., Zisman W. A., The wetting of gold and platinum by water. J. Phys. Chem. 69, 4238–4242 (1965). [Google Scholar]
Associated Data
This section collects any data citations, data availability statements, or supplementary materials included in this article.
Supplementary Materials
Supplementary material for this article is available at http://advances.sciencemag.org/cgi/content/full/2/4/e1501891/DC1
S1. Constants and properties of H2O and D2O
S2. Femtosecond elastic second harmonic scattering
S3. Phenomenological discussion of the response of spherical domains
S4. Spherical domain size dependence of the fs-ESHS signal
S5. Molecular dynamics simulations
S6. fs-ESHS from pure H2O and D2O
S7. Mean-field models
S8. Surface tension measurements and interpretation
Table S1. Constants and properties of H2O and D2O.
Table S2. Domain radius, corresponding number of hydration shells, and anisotropy in case the domain size is only determined by the average ion separation.
Fig. S1. Elastic and inelastic second harmonic scattering.
Fig. S2. Sketch of the relevant parameters needed in the phenomenological discussion.
Fig. S3. ΔI as a function of domain size and relative structural anisotropy.
Fig. S4. fs-ESHS patterns for pure H2O and pure D2O.
Fig. S5. Mean-field models and temperature dependence.