Abstract
Purpose
To characterise longitudinal changes in the retinal microvasculature of type 2 diabetes mellitus (T2DM) as exemplified in a patient with proliferative diabetic retinopathy (PDR) using an adaptive optics scanning light ophthalmoscope (AOSLO).
Methods
A 35 year old T2DM patient with PDR treated with scatter pan-retinal photocoagulation at the inferior retina one day prior to initial AOSLO imaging along with a 24 year old healthy control were imaged in this study. AOSLO vascular structural and perfusion maps were acquired at four visits over a 20 week period. Capillary diameter and microaneurysm area changes were measured on the AOSLO structural maps. Imaging repeatability was established using longitudinal imaging of microvasculature in the healthy control.
Results
Capillary occlusion and recanalisation, capillary dilatation, resolution of local retinal haemorrhage, capillary hairpin formation, capillary bend formation, microaneurysm formation, progression and regression were documented over time in a region 2° superior to the fovea in the PDR patient. An identical microvascular network with same capillary diameter was observed in the control subject over time.
Conclusions
High-resolution serial AOSLO imaging enables in vivo observation of vasculopathic changes seen in diabetes mellitus. The implications of this methodology are significant, providing the opportunity for studying the dynamics of the pathological process, as well as the possibility of identifying highly sensitive and non-invasive biomarkers of end organ damage and response to treatment.
Keywords: retina, blood vessels, multiply scattered light, adaptive optics, capillaries, diabetic retinopathy
Introduction
Diabetic retinopathy (DR) is a common cause of vision loss and blindness in the working age population,1 affecting nearly 7.7 million Americans age 40 and older in 2010.2 Type 2 diabetes mellitus (T2DM) is the most common type of diabetes. Its great impact on quality of life and economics have made the diagnosis and management of T2DM, and the restoration of normal tissue function, an important focus of medical professionals and public health proponents. Traditionally the diagnosis of DR has been based upon the detection of microaneurysms (MAs), exudates and haemorrhages using slit lamp examination, fundus photography, optical coherence tomography, and intravenous fluorescein angiography. These changes however, become apparent only once there is considerable damage to the tissue. The ability to detect DR earlier through retinal imaging could help limit or even avoid irreversible retinal damage and visual loss, and perhaps secondarily, damage to the kidneys, heart and brain.
Recent developments in adaptive optics scanning light ophthalmoscopy (AOSLO) have allowed in vivo assessment of the retinal microvasculature without the need for exogenous contrast agents, using motion contrast image processing.3–8 This has enabled detection of early subclinical changes to the retinal microvasculature from diabetes mellitus,9–11 including, but not limited to, changes in microvascular lumen diameter and wall-to-lumen ratios, capillary dropout, capillary bend formations, and increased tortuosity. These collective results suggest that existing clinical classifications, based on lower-magnification assessment, may not be adequate in detecting disease processes in early end-organ damage from diabetes.
Confocal AOSLO imaging can be enhanced by using a multiply scattered light detection scheme to produce reliable, high contrast structural and perfusion images of the microvasculature, comparable to those obtained using AOSLO fluorescein angiography.12 These modified AOSLOs have been previously used to study vascular defects in patients with DR.9, 12 This report adds to previous literature by employing an AOSLO, modified with a multiply scattered light detection scheme, to study retinal microvascular changes longitudinally, occurring in a T2DM patient with PDR. Our findings have significant implications for the study of early microvascular damage from diabetes mellitus and the search for more sensitive indicators of disease progression and response to treatment.
Methods
Subjects
A 24 year old male (RR_0188) healthy control subject, with a Haemoglobin A1c (HbA1c) of 4.1% was imaged twice over a span of 36 weeks. The control subject received a complete eye examination, including dilated fundus examination using Spectralis OCT and Topcon fundus picture. Visual acuity was measured at 4 metres using LogMAR ETDRS charts with the line scoring method. For the control subject, visual acuity without spectacle correction was 0.0 logMAR (Snellen 6/6 or 20/20) at both visits. No evidence of retinal pathology or systemic diseases was present. A 35 year old male (RR_0244) with T2DM of eight years duration was imaged four times over the course of 20 weeks. Respectively, the study eye (right eye) and the fellow eye (left eye) was diagnosed with moderate proliferative diabetic retinopathy (PDR) and non-proliferative diabetic retinopathy (NPDR) by our in-house retina specialist nine months prior to the first AOSLO imaging and was under medical treatment with Novolog Flex Pen 15 units 3x/day. The patient received green diode laser pan-retinal photocoagulation to the inferior retina of the right eye one day prior to the first AOSLO imaging visit (spot size 200μm; pulse duration 0.2s; no. of spots 856). No additional pan-retinal photocoagulation treatment was given over the course of 20 weeks. Both eyes had a normal anterior segment with clear crystalline lens and ocular media. Haemoglobin A1c (HbA1c) values of 12.1% and 11.3% were recorded at the first and last visits (Table 1). Visual acuity with the patient’s spectacles was 0.0 logMAR (Snellen 6/6 or 20/20) at all four visits and no subjective refraction was performed. No other systemic disease, including hypertension and hyperlipidaemia was reported by the patient.
Table 1.
Visit information for the 35 year old diabetic patient. HbA1c: Haemoglobin A1c. The normal HbA1c level range is 4.5 – 6%
| AOSLO Imaging | ||||
|---|---|---|---|---|
| Visit 1 | Visit 2 | Visit 3 | Visit 4 | |
| No. of Weeks | Baseline | 4 weeks | 14 weeks | 20 weeks |
| Visual Acuity (logMAR) | 0.0 | 0.0 | 0.0 | 0.0 |
| HbA1c | 12.1% | Not taken | Not taken | 11.3% |
| Blood Pressure (mmHg) | 119/60 | Not taken | 105/64 | 95/70 |
AOSLO imaging was performed on the left eye of the control subject and the right eye of the PDR patient. Pupils were dilated with one drop of 2.5% phenylephrine hydrochloride ophthalmic solution and 1% tropicamide ophthalmic solution. Written informed consent was obtained after the nature and potential risks of the procedure were explained. This study adhered to the tenets of the Declaration of Helsinki and was approved by the Institutional Review Board of the New York Eye and Ear Infirmary of Mount Sinai.
Preliminary ocular imaging
For the PDR patient, intravenous fluorescein angiography was performed one month prior to the first AOSLO visit using the Optos 200Tx (http://www.optos.com). Regions of interest for AOSLO imaging were pre-identified using the intravenous fluorescein angiography. Spectral domain optical coherence tomography (SD-OCT) (http://www.heidelbergengineering.com/us/products/spectralis-models/) and colour fundus photography (http://www.topconmedical.com/products/3doct2000.htm) were also performed on both subjects at all visits. Axial length measurements were obtained using an IOL Master (http://www.zeiss.com/meditec) during the first visit.
AOSLO Imaging
In vivo retinal microvasculature imaging was performed using a custom-built AOSLO system13 modified with a multiply scattered light detection scheme. AOSLO offset pinhole reflectance imaging of retinal microvasculature has been extensively described in previous reports. 4, 8 Briefly, the technique involves displacement of a larger confocal pinhole, located at the retinal plane conjugate in front of the detector. In this study, the confocal pinhole size was approximately 16.67x the Airy disk diameter, as measured at the detector plane. Retinal microvasculature contrast was maximised by manually displacing the confocal pinhole along the horizontal direction only. Imaging was performed at a frame rate of 15 Hz. The imaging light source was a superluminescent laser diode with a peak wavelength centred at 790 nm (www.superlumdiodes.com). Light exposure calculations were determined to be well below the maximum permissible exposure according to the American National Standards Institute ANSI Z136.14
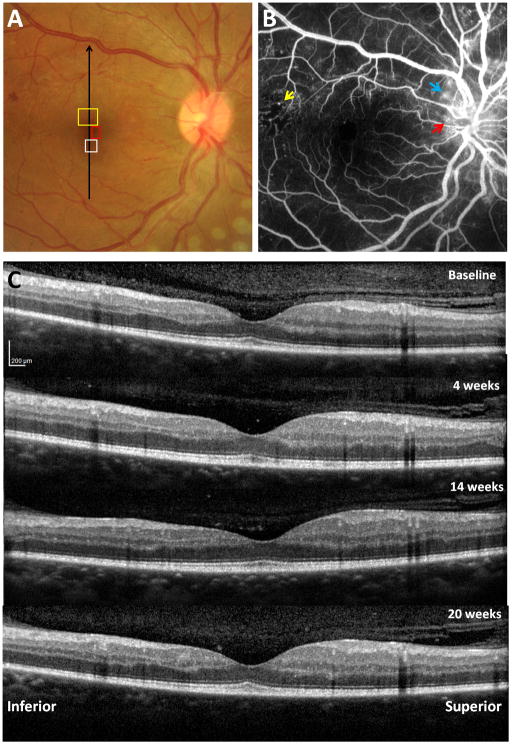
During imaging, subjects were stabilised and secured using a dental impression on a bite bar (Splash! putty, www.denmat.com). Subjects were instructed to direct their gaze upon a green internal fixation target. In the control subject, microvascular images were obtained at 1.5° superior to the fovea (Figure 1). In the PDR patient, three regions of interest were imaged and monitored over the course of 20 weeks, 1) 2° superior to the fovea, 2) 2° inferior to the fovea, and 3) 1.5° nasal to the fovea (Figure 2A). Throughout the imaging sessions, subjects were encouraged to blink frequently to maintain their normal tear film insuring a clear visual axis and were provided with short breaks at regular intervals, or as requested.
Figure 1.
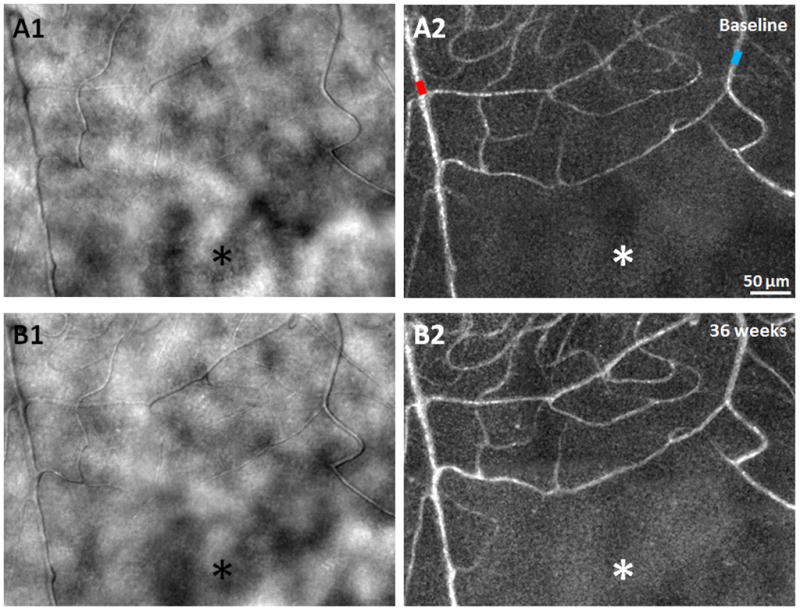
A1 & B1) AOSLO structural images of the capillary network approximately 1.5° superior to the fovea, obtained 36 weeks apart in a 24 year old male healthy control, showing relatively uniform foveal capillary network and lumen diameters with no significant changes. (A2 & B2) Corresponding perfusion maps generated using a motion contrast technique. Arteriole and venule are marked as red and blue, respectively. Asterisks indicate the foveal avascular zone. Scale bar = 50 μm across.
Figure 2.
Clinical retinal images of a 35 year old male PDR patient with T2DM. A) Fundus photograph with regions of interest on the right eye imaged by AOSLO, as presented in Figures 3, 4 and 10. Black arrow indicates location of vertical SD-OCT scanning. B) Intravenous fluorescein angiography showing scattered MAs with a temporal region of capillary nonperfusion (yellow arrow) and neovascularisation (red arrow) with leakage (blue arrow) at and around the disc. C) Vertical SDOCT scans through the fovea across the four visits.
AOSLO image sequences collected at each retinal location and focus were registered offline. They were averaged to maximise signal-to-noise ratio, formatted into microvascular structural maps, and processed to identify blood cell motion, creating motion contrast perfusion maps, as previously described.3 Montages of the AOSLO images were generated using Adobe Photoshop CS6 (www.adobe.com). Retinal magnification adjustments were applied to the AOSLO images incorporating the measured axial lengths into the Emsley schematic eye model formula.15
Capillary diameter and microaneurysm area measurements
Before AOSLO imaging, arterioles and venules near the foveal avascular zone were pre-identified on the wide field fundus pictures. Capillaries were defined as the smallest blood vessels connecting the arterioles and venules on the AOSLO images. The foveal avascular zone effective diameter in the control and the PDR patient was 450 and 570μm, respectively. Capillary diameter measurements were obtained near the margin of the foveal avascular zone in both subjects. In this study, capillary wall imaging was not always possible using the current offset pinhole technique. Thus, capillary diameter was defined as the total diameter of capillaries. Capillary diameter measurements were obtained on four to five capillaries near the foveal avascular zone on each studied region per visit. For each capillary, approximately 10 diameter measurements were performed manually using MATLAB (www.mathworks.com), resulting in 40–50 capillary diameter measurements on each studied region per visit. The capillary diameters for PDR vs. control were compared using an unpaired t-test. Nonperfused capillaries, identified from comparison of structural and motion contrast perfusion maps, were avoided in these measurements. Microaneurysms (MAs) were also delineated manually, using a MATLAB algorithm.
Results
Repeatability of AOSLO imaging on the Control Subject
AOSLO imaging of the control subject was performed in a region approximately 1.5° superior to the fovea (Figure 1) over an interval of 36 weeks. The foveal capillary networks and lumen diameters imaged in both visits appeared uniform and identical, without evidence of change in perfusion status using both the structural images and the motion contrast perfusion maps (Figure 1).
Preliminary ocular imaging of the PDR Patient
In the PDR patient, intravenous fluorescein angiography obtained one month prior to AOSLO imaging, revealed numerous MAs, an area of temporal capillary non-perfusion, leakage and neovascularisation involving the optic disc, and lesions of neovascularisation elsewhere in the right eye (Figure 2B). Intravenous fluorescein angiography of the left eye showed numerous MAs, leakage, and neovascularisation involving the optic disc.
Although no intraretinal microvascular abnormality, changes in neovascularisation, or soft exudates were detected in the right eye over the course of four visits, fundus photographs revealed multiple microaneurysm appearances and disappearances. A small flame haemorrhage inferior to the optic disc was observed at the second visit that had resolved by the third visit. No noticeable foveal change was detected on fundus photography over time.
No clinically significant oedema of the macular region or changes in retinal thickness were detected in either eye on SD-OCT examination across the four imaging visits. Figure 2C shows the SD-OCT scans of the right eye across the four visits.
PDR Microvascular abnormalities at 2° Inferior to the Fovea
Figure 3 shows AOSLO structural images and motion contrast maps obtained 2° inferior to the fovea of the PDR patient. Qualitatively, uniform and identical capillary plexus were identified at each visit with the exception of two cystic structures with a diameter of ~30μm noted at visit 4 (Figure 3D1, white arrow) and a dilation of a capillary over time (Figure 3A1–D1, black arrows). No motion of cells within the two microcysts was visualised on the AOSLO videos. Neither fundus photography nor SD-OCT was able to detect the microcysts. All imaged capillaries appeared perfused without evidence of occlusion or outpouching.
Figure 3.
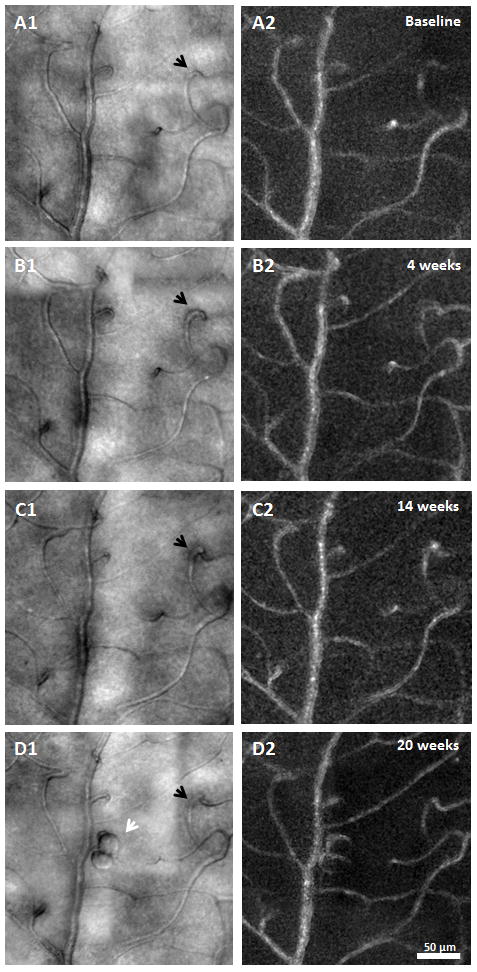
AOSLO structural images of a venule obtained approximately 2° inferior to the fovea in the PDR patient. Imaged region corresponds to the white box on Figure 1A. Left column shows AOSLO structural images of four visits. Overall, relatively stable microvascular structure was identified over time with the exception of a capillary dilation (A1–D1, black arrows) and two microcysts (D1, white arrow). Right column shows the corresponding motion contrast perfusion map. Scale bar = 50 μm across.
PDR Microvascular abnormalities at 2° Superior to the Fovea
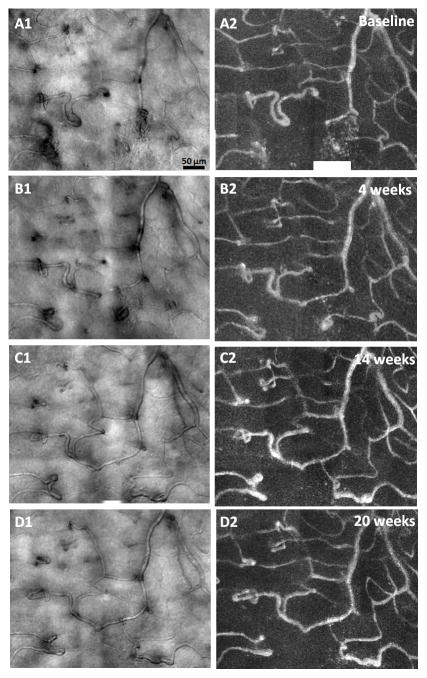
A variety of retinal microvascular abnormalities were readily observed on the AOSLO images taken 2° superior to the fovea of the PDR patient. Compared to the healthy control images (Figure 1), PDR images showed the presence of nonperfused capillaries, MAs, vessel loops, engorged and dilated blood vessels, vascular tortuosity, and irregular capillary diameters (Figure 4). Dynamic pathological changes to the retinal microvasculature in the PDR patient across the four visits included capillary occlusion and recanalisation (Figure 5), capillary dilation (Figure 6), formation of a capillary bend (Figure 7), resolution of local retinal haemorrhage (Figure 8), and hairpin capillary formation (Figure 8).
Figure 4.
Longitudinal microvascular changes in PDR. AOSLO structural images (left column) and motion contrast perfusion maps (right column) obtained approximately 2° superior to the fovea. Imaged region corresponds to the yellow box on Figure 1A. Vessel abnormalities such as nonperfused capillary, microaneurysm, and capillary loops are visible. Scale bar = 50 μm across. Selected regions are shown in higher magnification in Figures 5–8.
Figure 5.
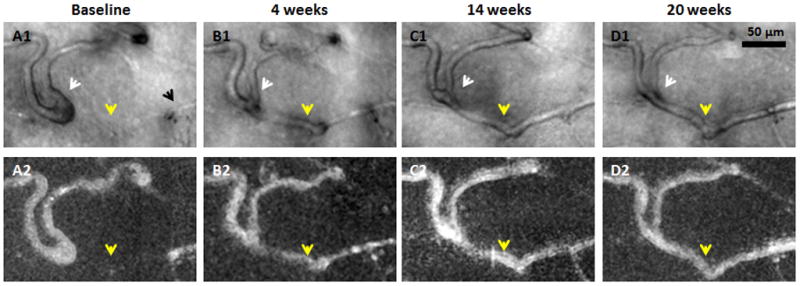
Recanalisation of an occluded capillary. Magnified region from Figure 4. Top row shows AOSLO structural images. Bottom row shows corresponding motion contrast perfusion maps. A1) Black arrow indicates a capillary segment with an abrupt end. A1–D1) White arrows indicate that as the neighbouring capillary is recanalised and reperfused (yellow arrows), vessel calibre and distortion decrease. Scale bar = 50 μm across.
Figure 6.
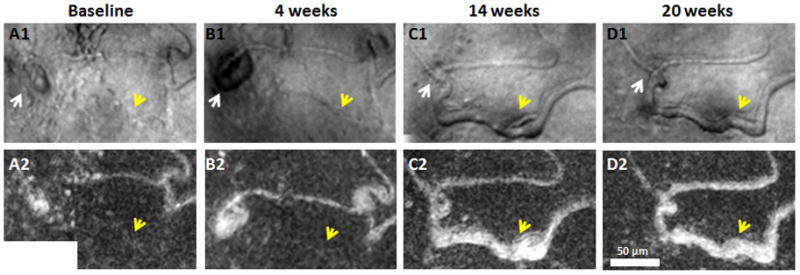
Capillary dilation after recanalisation and reperfusion. Magnified region from Figure 4. Top row shows AOSLO structural images. Bottom row shows corresponding motion contrast perfusion maps. A small MA can be seen along a dilated capillary (A1 & B1, white arrows). Regressed MA after capillary recanalisation and reperfusion (C1 & D1, white arrows). Yellow arrows indicate capillary dilation due to recanalisation and reperfusion after the first two visits. Scale bar = 50 μm across.
Figure 7.
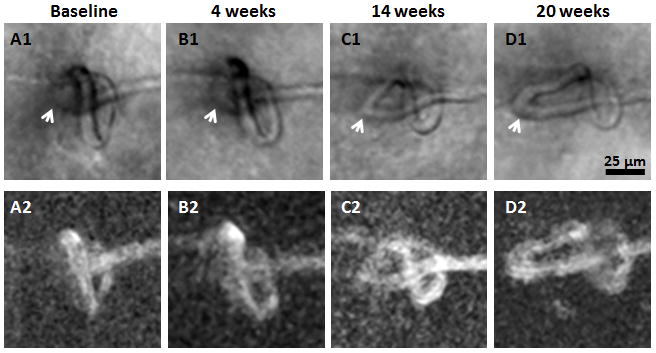
Formation of capillary bends. Magnified region from Figure 4. Top row shows AOSLO structural images. Bottom row shows corresponding motion contrast perfusion maps. Arrows indicate the formation of capillary bends. Scale bar = 25 μm across.
Figure 8.
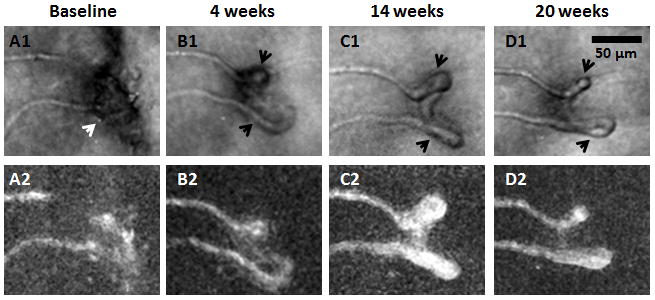
Haemorrhage absorption and hairpin formation. Magnified region from Figure 4. Top row shows AOSLO structural images. Bottom row shows corresponding motion contrast maps. A1) White arrow indicates a possible focal haemorrhage located superficially to the imaged vessels compromising its visibility at baseline. B1–D1) Formation of hairpin capillaries near the insult (black arrows). Scale bar = 50 μm across.
Capillary occlusion and recanalisation
Dynamic capillary occlusion and recanalisation were observed at two regions (Figures 5 and 6).
The first region showed a dilated capillary loop (Figure 5A1, white arrow) and a capillary segment which ended abruptly (Figure 5A1, black arrow). Comparison between the structural image and the corresponding motion contrast perfusion map suggested that this capillary segment was occluded at visit 1 (Figure 5A1 & 5A2, yellow arrows). A capillary segment adjacent and directly connected to the occlusion was observed to be dilated and distorted with increased tortuosity (Figure 5A1, white arrow). The occluded capillary from visit 1 was observed to recanalise at visit 2 (Figure 5B1 & 5B2, yellow arrows), and remained perfused at visits 3 and 4. The dilation and distortion of the adjacent capillary segment regressed gradually after recanalisation (Figure 5B1, 5C1, & 5D1, white arrows).
A second region, approximately 100 μm inferior to the first region showed a capillary with a focal bulge (Figure 6A1, white arrow) adjacent to a nonperfused capillary segment (Figure 6A1, yellow arrow) that progressed into a saccular microaneurysm by visit 2 (Figure 6B1, white arrow), but had disappeared by visits 3 and 4 after recanalisation of the nonperfused capillary segment (Figure 6C1 & 6D1, white arrows). Similar to the first region, the occluded capillary from visit 1 (Figure 6A1 & 6A2, yellow arrows) was recanalised and dilated at visit 3 (Figure 6C1 & 6C2, yellow arrows), and remained perfused at visits 4. No neovascularisation was detected in these two perifoveal regions, although some capillaries were abnormally dilated and tortuous.
Modulation of vessel diameter and capillary bend formation
At the capillary occlusion site, dilation of the capillary diameter was observed in the recanalised capillary segments (Figures 5 and 6, yellow arrows). There was a capillary bend formation upstream to the site of capillary occlusion in Figure 5. This capillary bend gradually progressed with increasing vessel length and diameter (Figure 7, white arrows) over 20 weeks.
Haemorrhage absorption
Figure 8A1 (white arrow) shows a possible focal haemorrhage located superficially to the imaged vessel, compromising its visibility. The haemorrhage may have been associated with VEGF-mediated neovascular changes near the insult and the formation of hairpin capillaries (Figures 8B1, 8C1, and 8D1, black arrows).
Capillary diameter measurement
Figure 9 shows the capillary diameter measurements obtained in the healthy control and PDR patient over time. While the mean of capillary diameter was 5.78 ± 1.5 μm (range: 4–9 μm) in the control subject, the mean of capillary diameter in the PDR patient was higher, with 7.7 ± 2.2 μm in the inferior region and 10.0 ± 3.2 μm in the superior region. Although a range of 4–9 μm capillary diameters was measured in the normal subject, a wide range of 5–30 μm was observed within the superior region of the PDR patient. The mean of capillary diameters measured at the PDR superior and inferior region were significantly higher than that of the control (unpaired t-test, p<0.05). Capillary diameter measurements varied over the course of the study in both inferior and superior regions of the PDR patient. In the inferior and superior regions, capillary diameter initially decreased by 7% and 9% at visit 2, then increased by 7% and 13% at visit 3, followed by a 4% and 5% reduction at visit 4. In contrast, a 2% difference of the capillary diameter measurements was reported in the control subject over 36 weeks.
Figure 9.
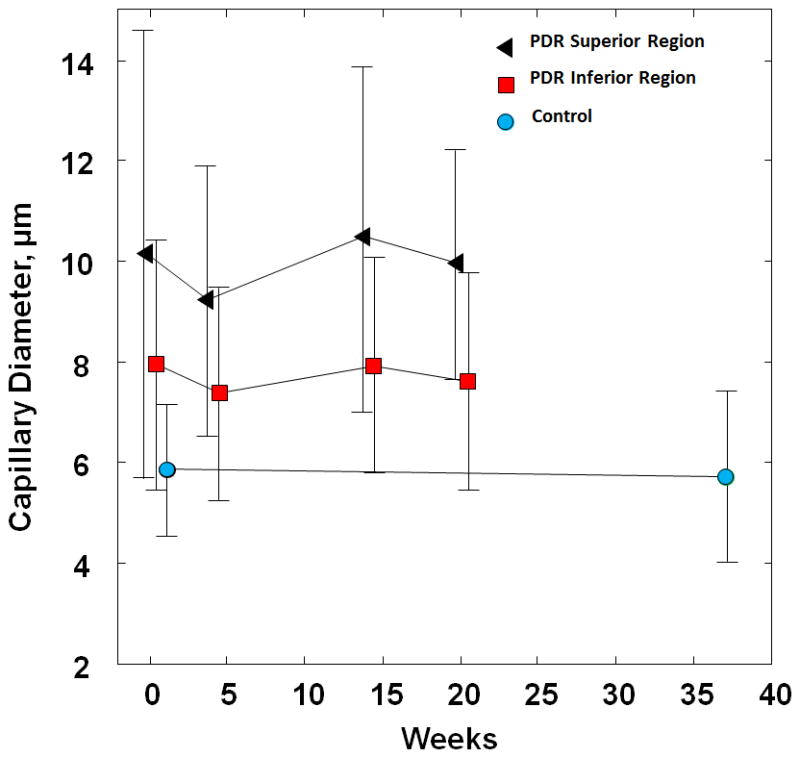
Capillary diameter measurements over time in the PDR patient and healthy control. Error bars represent standard deviation. Square and circle data points have been displaced slightly to the right for better visualisation of the error bars.
Microaneurysm Development
MA formation, progression, and regression were clearly identified 1.5° nasal to the fovea in the PDR patient across visits (Figure 10). Four MAs were imaged and monitored over time. The walls of all of the MAs remained transparent with visible blood flow in the AOSLO structural image sequence. No lumen clots were detected. Two types of MA morphologies were observed - focal bulge and saccular,16, 17 ranging in size from 200 - 700 μm2. At baseline visit 1, only one focal bulge MA (Figure 10A1, white arrow) was detected with relatively uniform capillary network and lumen diameter in the neighbouring region. No images were collected at visit 2 in this region. At visit 3, while three saccular MAs with various sizes were formed adjacent to the focal bulge MA (Figure 10B1, black arrows), the focal bulge MA appeared to have regressed (Figure 10B1, white arrow). By visit 4, as one of the saccular MAs seemed to have progressed in size by 27%, two other saccular MAs had regressed by 25% & 38% (Figure 10C1). Also visualized at visit 4 was the complete regression of the focal bulge MA without any evidence of thrombogenesis (Figure 10, white arrows).
Figure 10.
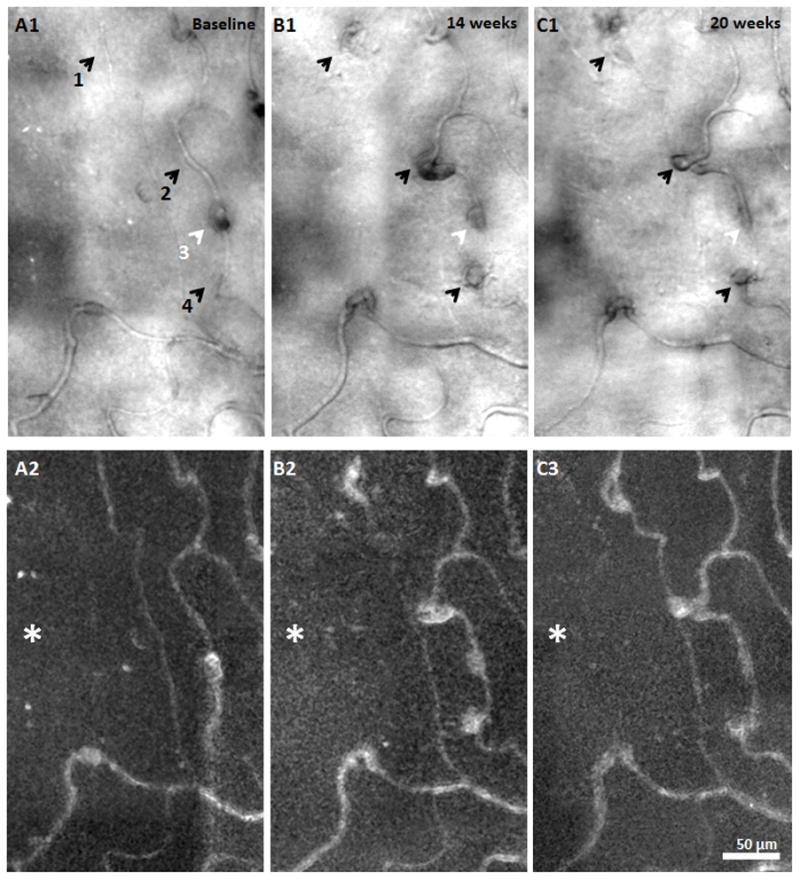
MA formation, progression, and regression located at 1.5° nasal retina in the PDR patient. A1, B1, & C1) AOSLO structural images over time. Black arrows indicate saccular MA formation over time. White arrows show a focal bulge MA and regression over time. A2, B3, & C3) corresponding motion contrast perfusion maps. Asterisks indicate the foveal avascular zone. Scale bar = 50 μm across.
Discussion
Longitudinal AOSLO imaging over 20 weeks in this T2DM patient with PDR revealed various microscopic sub-clinical vascular changes, not detectable with current clinical OCT technology. These findings illustrate that vascular change can be highly dynamic, with microscopic changes such as capillary recanalisation and reperfusion, capillary dilation, and MA development occurring week to week, despite apparently stable visual acuity and SD-OCT. We must caution the reader however, as it is unclear whether these changes are representative of the natural history of diabetic retinopathy since the PDR patient was treated with pan-retinal photocoagulation prior to imaging. In general, the structural and motion contrast perfusion images obtained using AOSLO modified with a multiply scattered light detection scheme enabled us to detect nonperfused capillaries, which is not possible using vascular imaging techniques that depend on the use of contrast agents.
Capillary Diameter
AOSLO imaging modified with multiply scattered light detection provides high contrast structural images of the retinal vasculature, enabling measurements of the capillary diameter.4, 9 Our findings of capillary diameter measured in the healthy control eye are in close agreement with those reported by histological studies reported in macaque monkeys.18, 19 Compared to the control subject, our results of larger capillary diameter in the PDR patient are similar to those in a previous report on NPDR patients using similar approach.9
Haemodynamics
It is well known from histopathological studies that diabetes mellitus is associated with endothelial and pericyte cell death, and basement membrane thickening,20–22 leading to capillary occlusion with development of retinal ischemia. The presence of capillary occlusion in the inner retinal plexus is considered a critical sign of DR.23, 24 In our study, two distinct examples of capillary segments with occlusion and recanalisation were found (Figures 5 & 6). While both capillary segments showed occlusion at Visit 1, one capillary segment showed subsequent recanalisation and re-establishment of near-normal structure at Visit 2–4 (Figure 5). Another capillary segment showed a more tortuous and dilated course after recanalisation and reperfusion at Visits 3–4 (Figure 6C1 & D1, yellow arrows). Notably, this recanalisation event should not be confused with neovascularisation. While recanalisation indicates a restoration of local perfusion, neovascularisation occurs once there is damage of downstream tissue with high VEGF release resulting in an ill-fated attempt to rescue dying surrounding tissue. It is difficult to speculate on what effect the process of recanalisation has on the overall health of the retina. Although recanalisation suggests at least partial functional recovery of the blood vessel, reperfusion injury to the surrounding tissue may occur. 25, 26
Although this study explores results obtained in one PDR patient, the observed capillary abnormalities and associated retinal hypoxia were consistent with prior studies.24, 27 In attempting to explain our results of vascular remodelling due to capillary occlusion and recanalisation, we speculated that as the adjacent capillary is occluded, it causes an increase in the neighbouring intravascular hydrostatic pressure. It is possible that the neighbouring perfused capillary, with an already compromised vascular wall structure, became dilated via mechanical stretching as a result of this increased hydrostatic pressure (Figures 5A1, 6A1, & 6B1). Once the occluded capillary became recanalised and reperfused, the hydrostatic intravascular pressure equilibrated, resulting in a less dilated and distorted capillary in the adjacent segment (Figures 5B1–5D1, Figures 6C1–6D1). The remaining tortuosity and dilation of the recanalised capillary suggests the presence of compromised vascular wall structure due to malfunction of pericytes and endothelial cells. It is anticipated that with the addition of an imaging frame rate of ~120 fps or higher,28, 29 AOSLO may provide quantitative measurements of capillary blood flow at or near the affected regions. Our findings may offer insight into the pathophysiology of microvascular damage in DR.
Microaneurysm development
Retinal MAs have been used clinically as an indicator for monitoring disease progression and treatment response.30–33 In particular, absolute count34, 35 and turnover36, 37 of MAs can be used as an indicator for disease progression and reflect the severity of retinopathy38. Prior studies have also shown that the total number of retinal MAs correlates with the HbA1c level in patients with T2DM.37, 39 Although many aspects of MAs have been studied extensively using histological and clinical approaches, the dynamics of MA development remains unclear.17 Figure 10 shows a series of events representing the development of MAs in the PDR patient over 20 weeks. A total of 4 MAs were imaged and monitored. Only one MA was visible at visit 1 (Figure 10, MA no. 3) surrounded by a relatively normal looking capillary network without any noticeable capillary wall bulges. By visit 3, three new MAs had formed (Figure 10, MA no. 1, 2, & 4) with relatively tortuous neighbouring capillaries, suggesting early stages of MA formation. Our findings agree with prior studies that have shown that MAs are dynamic lesions which undergo formation and regression.40 Tracking MAs over time may serve as a biomarker of vascular stability revealing disease progression or treatment response. Our longitudinal images are able to document the life cycle of individual MAs through their stages of development noninvasively using AOSLO.
Conclusions
AOSLO provides direct and noninvasive visualisation of the retinal microvasculature of healthy and DR retina, which when performed longitudinally opens the opportunity for new insights into the dynamics of vascular disease. Use of this imaging technique may facilitate identification of more sensitive indicators of DR progression based upon microvascular features. Future studies should include a larger sample size with appropriately matched healthy controls and imaging visit intervals. Hopefully, our findings will serve as a template for future studies focused on dynamics of retinal microvasculature in the pathogenesis of DR.
Acknowledgments
The authors acknowledge Dr. Tatyana Milman for her helpful discussion. Funding for this research was provided by the Marrus Family Foundation, Bendheim_Lowenstein Family Foundation, Wise Family Foundation, RD & Linda Peters Foundation, Edith C. Blum Foundation, Chairman's Research Fund of the New York Eye and Ear Infirmary, the Glaucoma Research Foundation Catalyst for a Cure Initiative, an unrestricted departmental grant from Research to Prevent Blindness, and National Institutes of Health grants P30EY001931, UL1TR000055. Alfredo Dubra, PhD is the recipient of a Career Development Award from Research to Prevent Blindness. The sponsors and funding organizations had no role in the design or conduct of this research.
Footnotes
Disclosure
Commercial Relationship(s): Alfredo Dubra: US Patent No: 8,226,236: (Patent). Richard B. Rosen: Clarity: (Consultant);Opticology: (Personal Financial Interest);OD-OS: (Consultant);Allergan: (Consultant);Carl Zeiss Meditech: (Consultant);Optovue: (Consultant);Advanced Cellular Technologies: (Consultant). NanoRetina: (consultant) and Regeneron: (consultant). No other conflicting relationships exist.
This manuscript was presented in part at the ARVO 2014 annual meeting (RB Rosen et al., Monitoring retinal vasculopathic changes over time using In Vivo offset pinhole adaptive optics scanning light ophthalmoscopy. Invest Ophthalmol Vis Sci 2014;55: E-Abstract 1657.)
References
- 1.Kempen JH, O'Colmain BJ, Leske MC, Haffner SM, Klein R, Moss SE, et al. The prevalence of diabetic retinopathy among adults in the United States. Arch Ophthalmol. 2004;122(4):552–63. doi: 10.1001/archopht.122.4.552. [DOI] [PubMed] [Google Scholar]
- 2.Prevent Blindness America. Prevalence of adult vision impairment and age-related eye disease in the U.S. Chicago: IL: Prevent Blindness America; 2012. Vision Problems in the US. [Google Scholar]
- 3.Chui TY, Zhong Z, Song H, Burns SA. Foveal avascular zone and its relationship to foveal pit shape. Optom Vis Sci. 2012;89(5):602–10. doi: 10.1097/OPX.0b013e3182504227. [DOI] [PMC free article] [PubMed] [Google Scholar]
- 4.Chui TY, Vannasdale DA, Burns SA. The use of forward scatter to improve retinal vascular imaging with an adaptive optics scanning laser ophthalmoscope. Biomed Opt Express. 2012;3(10):2537–49. doi: 10.1364/BOE.3.002537. [DOI] [PMC free article] [PubMed] [Google Scholar]
- 5.Tam J, Martin JA, Roorda A. Noninvasive visualization and analysis of parafoveal capillaries in humans. Invest Ophthalmol Vis Sci. 2010;51(3):1691–8. doi: 10.1167/iovs.09-4483. [DOI] [PMC free article] [PubMed] [Google Scholar]
- 6.Sulai YN, Scoles D, Harvey Z, Dubra A. Visualization of retinal vascular structure and perfusion with a nonconfocal adaptive optics scanning light ophthalmoscope. J Opt Soc Am A Opt Image Sci Vis. 2014;31(3):569–79. doi: 10.1364/JOSAA.31.000569. [DOI] [PMC free article] [PubMed] [Google Scholar]
- 7.Chui TY, VanNasdale DA, Elsner AE, Burns SA. The association between the foveal avascular zone and retinal thickness. Invest Ophthalmol Vis Sci. 2014;55(10):6870–7. doi: 10.1167/iovs.14-15446. [DOI] [PMC free article] [PubMed] [Google Scholar]
- 8.Chui TY, Gast TJ, Burns SA. Imaging of vascular wall fine structure in the human retina using adaptive optics scanning laser ophthalmoscopy. Invest Ophthalmol Vis Sci. 2013;54(10):7115–24. doi: 10.1167/iovs.13-13027. [DOI] [PMC free article] [PubMed] [Google Scholar]
- 9.Burns SA, Elsner AE, Chui TY, Vannasdale DA, Jr, Clark CA, Gast TJ, et al. In vivo adaptive optics microvascular imaging in diabetic patients without clinically severe diabetic retinopathy. Biomed Opt Express. 2014;5(3):961–74. doi: 10.1364/BOE.5.000961. [DOI] [PMC free article] [PubMed] [Google Scholar]
- 10.Tam J, Dhamdhere KP, Tiruveedhula P, Lujan BJ, Johnson RN, Bearse MA, Jr, et al. Subclinical capillary changes in non-proliferative diabetic retinopathy. Optom Vis Sci. 2012;89(5):E692–703. doi: 10.1097/OPX.0b013e3182548b07. [DOI] [PMC free article] [PubMed] [Google Scholar]
- 11.Tam J, Dhamdhere KP, Tiruveedhula P, Manzanera S, Barez S, Bearse MA, Jr, et al. Disruption of the retinal parafoveal capillary network in type 2 diabetes before the onset of diabetic retinopathy. Invest Ophthalmol Vis Sci. 2011;52(12):9257–66. doi: 10.1167/iovs.11-8481. [DOI] [PMC free article] [PubMed] [Google Scholar]
- 12.Chui TY, Dubow M, Pinhas A, Shah N, Gan A, Weitz R, et al. Comparison of adaptive optics scanning light ophthalmoscopic fluorescein angiography and offset pinhole imaging. Biomed Opt Express. 2014;5(4):1173–89. doi: 10.1364/BOE.5.001173. [DOI] [PMC free article] [PubMed] [Google Scholar]
- 13.Dubra A, Sulai Y. Reflective afocal broadband adaptive optics scanning ophthalmoscope. Biomed Opt Express. 2011;2(6):1757–68. doi: 10.1364/BOE.2.001757. [DOI] [PMC free article] [PubMed] [Google Scholar]
- 14.American National Standard Institute. American National Standard for the Safe Use of lasers. ANSI; New York: 2007. ANSI Z136.1-2007. [Google Scholar]
- 15.Smith G, Atchison DA. The eye and visual optical instruments. 1. Cambridge University Press; 1997. [Google Scholar]
- 16.Moore J, Bagley S, Ireland G, McLeod D, Boulton ME. Three dimensional analysis of microaneurysms in the human diabetic retina. J Anat. 1999;194( Pt 1):89–100. doi: 10.1046/j.1469-7580.1999.19410089.x. [DOI] [PMC free article] [PubMed] [Google Scholar]
- 17.Dubow M, Pinhas A, Shah N, Cooper RF, Gan A, Gentile RC, et al. Classification of human retinal microaneurysms using adaptive optics scanning light ophthalmoscope fluorescein angiography. Invest Ophthalmol Vis Sci. 2014;55(3):1299–309. doi: 10.1167/iovs.13-13122. [DOI] [PMC free article] [PubMed] [Google Scholar]
- 18.Weinhaus RS, Burke JM, Delori FC, Snodderly DM. Comparison of fluorescein angiography with microvascular anatomy of macaque retinas. Exp Eye Res. 1995;61(1):1–16. doi: 10.1016/s0014-4835(95)80053-0. [DOI] [PubMed] [Google Scholar]
- 19.Snodderly DM, Weinhaus RS, Choi JC. Neural-vascular relationships in central retina of macaque monkeys (Macaca fascicularis) J Neurosci. 1992;12(4):1169–93. doi: 10.1523/JNEUROSCI.12-04-01169.1992. [DOI] [PMC free article] [PubMed] [Google Scholar]
- 20.Mizutani M, Kern TS, Lorenzi M. Accelerated death of retinal microvascular cells in human and experimental diabetic retinopathy. J Clin Invest. 1996;97(12):2883–90. doi: 10.1172/JCI118746. [DOI] [PMC free article] [PubMed] [Google Scholar]
- 21.Li W, Yanoff M, Liu X, Ye X. Retinal capillary pericyte apoptosis in early human diabetic retinopathy. Chin Med J (Engl) 1997;110(9):659–63. [PubMed] [Google Scholar]
- 22.Joussen AM, Poulaki V, Le ML, Koizumi K, Esser C, Janicki H, et al. A central role for inflammation in the pathogenesis of diabetic retinopathy. FASEB J. 2004;18(12):1450–2. doi: 10.1096/fj.03-1476fje. [DOI] [PubMed] [Google Scholar]
- 23.Garner A. Histopathology of diabetic retinopathy in man. Eye (Lond) 1993;7( Pt 2):250–3. doi: 10.1038/eye.1993.58. [DOI] [PubMed] [Google Scholar]
- 24.Kohner EM, Porta M. Vascular abnormalities in diabetes and their treatment. Trans Ophthalmol Soc U K. 1980;100(3):440–4. [PubMed] [Google Scholar]
- 25.Gourdin MJ, Bree B, De Kock M. The impact of ischaemia-reperfusion on the blood vessel. Eur J Anaesthesiol. 2009;26(7):537–47. doi: 10.1097/EJA.0b013e328324b7c2. [DOI] [PubMed] [Google Scholar]
- 26.Carden DL, Granger DN. Pathophysiology of ischaemia-reperfusion injury. J Pathol. 2000;190(3):255–66. doi: 10.1002/(SICI)1096-9896(200002)190:3<255::AID-PATH526>3.0.CO;2-6. [DOI] [PubMed] [Google Scholar]
- 27.Scholfield CN, McGeown JG, Curtis TM. Cellular physiology of retinal and choroidal arteriolar smooth muscle cells. Microcirculation. 2007;14(1):11–24. doi: 10.1080/10739680601072115. [DOI] [PubMed] [Google Scholar]
- 28.Forouzan O, Yang X, Sosa JM, Burns JM, Shevkoplyas SS. Spontaneous oscillations of capillary blood flow in artificial microvascular networks. Microvasc Res. 2012;84(2):123–32. doi: 10.1016/j.mvr.2012.06.006. [DOI] [PubMed] [Google Scholar]
- 29.Mujat M, Patel A, Iftimia N, Akula AD, Fulton AB, Ferguson DR. High-resolution retinal imaging: enhancement techniques. Proc SPIE 9307, Ophthalmic Technologies. 2015;XXV:930703. [Google Scholar]
- 30.Ishikawa K, Uyama M, Asayama K. Occlusive thromboaortopathy (Takayasu's disease): cervical arterial stenoses, retinal arterial pressure, retinal microaneurysms and prognosis. Stroke. 1983;14(5):730–5. doi: 10.1161/01.str.14.5.730. [DOI] [PubMed] [Google Scholar]
- 31.Yu T, Mitchell P, Berry G, Li W, Wang JJ. Retinopathy in older persons without diabetes and its relationship to hypertension. Arch Ophthalmol. 1998;116(1):83–9. doi: 10.1001/archopht.116.1.83. [DOI] [PubMed] [Google Scholar]
- 32.Baker ML, Hand PJ, Wang JJ, Wong TY. Retinal signs and stroke: revisiting the link between the eye and brain. Stroke. 2008;39(4):1371–9. doi: 10.1161/STROKEAHA.107.496091. [DOI] [PubMed] [Google Scholar]
- 33.Wong TY, Klein R, Sharrett AR, Couper DJ, Klein BE, Liao DP, et al. Cerebral white matter lesions, retinopathy, and incident clinical stroke. JAMA. 2002;288(1):67–74. doi: 10.1001/jama.288.1.67. [DOI] [PubMed] [Google Scholar]
- 34.Klein R, Meuer SM, Moss SE, Klein BE. Retinal microaneurysm counts and 10-year progression of diabetic retinopathy. Arch Ophthalmol. 1995;113(11):1386–91. doi: 10.1001/archopht.1995.01100110046024. [DOI] [PubMed] [Google Scholar]
- 35.Sjolie AK, Klein R, Porta M, Orchard T, Fuller J, Parving HH, et al. Retinal microaneurysm count predicts progression and regression of diabetic retinopathy. Post-hoc results from the DIRECT Programme. Diabet Med. 2011;28(3):345–51. doi: 10.1111/j.1464-5491.2010.03210.x. [DOI] [PubMed] [Google Scholar]
- 36.Ribeiro ML, Nunes SG, Cunha-Vaz JG. Microaneurysm turnover at the macula predicts risk of development of clinically significant macular edema in persons with mild nonproliferative diabetic retinopathy. Diabetes Care. 2013;36(5):1254–9. doi: 10.2337/dc12-1491. [DOI] [PMC free article] [PubMed] [Google Scholar]
- 37.Nunes S, Pires I, Rosa A, Duarte L, Bernardes R, Cunha-Vaz J. Microaneurysm turnover is a biomarker for diabetic retinopathy progression to clinically significant macular edema: findings for type 2 diabetics with nonproliferative retinopathy. Ophthalmologica. 2009;223(5):292–7. doi: 10.1159/000213639. [DOI] [PubMed] [Google Scholar]
- 38.Kohner EM, Stratton IM, Aldington SJ, Turner RC, Matthews DR. Microaneurysms in the development of diabetic retinopathy (UKPDS 42). UK Prospective Diabetes Study Group. Diabetologia. 1999;42(9):1107–12. doi: 10.1007/s001250051278. [DOI] [PubMed] [Google Scholar]
- 39.Chen SJ, Chou P, Lee AF, Lee FL, Hsu WM, Liu JH, et al. Microaneurysm number and distribution in the macula of Chinese type 2 diabetics with early diabetic retinopathy: a population-based study in Kinmen, Taiwan. Acta Diabetol. 2010;47(1):35–41. doi: 10.1007/s00592-009-0095-6. [DOI] [PubMed] [Google Scholar]
- 40.Bernardes R, Nunes S, Pereira I, Torrent T, Rosa A, Coelho D, et al. Computer-assisted microaneurysm turnover in the early stages of diabetic retinopathy. Ophthalmologica. 2009;223(5):284–91. doi: 10.1159/000213638. [DOI] [PubMed] [Google Scholar]


