

Abstract
Myoglobin (Mb) was lyophilized in the absence (Mb-A) and presence (Mb-B) of sucrose in a pilot-scale lyophilizer with or without controlled ice nucleation. Cake morphology was characterized using scanning electron microscopy (SEM) and changes in protein structure were monitored using solid-state Fourier-transform infrared spectroscopy (ssFTIR), solid-state hydrogen-deuterium exchange-mass spectrometry (ssHDX-MS) and solid-state photolytic labeling-mass spectrometry (ssPL-MS). The results showed greater variability in nucleation temperature and irregular cake structure for formulations lyophilized without controlled nucleation. Controlled nucleation resulted in nucleation at ~ −5 °C and uniform cake structure. Formulations containing sucrose showed better retention of protein structure by all measures than formulations without sucrose. Samples lyophilized with and without controlled nucleation were similar by most measures of protein structure. However, ssPL-MS showed the greatest pLeu incorporation and more labeled regions for Mb-B lyophilized with controlled nucleation. The data support the use of ssHDX-MS and ssPL-MS to study formulation and process-induced conformational changes in lyophilized proteins.
Keywords: Lyophilization, solid-state, controlled nucleation, protein structure, protein formulation, microscopy, hydrogen-deuterium exchange, photolytic labeling, mass spectrometry, FTIR
INTRODUCTION
Proteins are often marketed in lyophilized form or stored as lyophilized powders after purification and prior to formulation. Lyophilization begins with freezing, followed by primary drying to remove bulk ice by sublimation and secondary drying to desorb unfrozen water. Proteins are subjected to various stresses during lyophilization, including freeze-concentration and denaturation at the ice-surface, pH shifts and dehydration-induced aggregation 1–4. Proteins can be protected from some of these stresses by modifying the formulation and using stabilizing excipients 5–8. However, the process itself can play a role in determining critical quality attributes (CQAs) of the product. For example, the thermal history of freezing may result in the formation of mannitol hydrate in mannitol-containing formulations, which seem to be metastable and can release water during storage, adversely influencing the long-term storage stability of the drug product 9–11. Inadequate drying temperature or time can also result in product failure due to increased moisture content, and processing or storage above the glass transition temperature (Tg) can result in degradation 12, 13. Cake elegance can be adversely affected by aggressive processing above the collapse temperature, producing various degrees of macro- and micro-collapse 14, 15. Higher temperatures during lyophilization can degrade reducing carbohydrate excipients via the Maillard reaction 16, which may reduce their stabilizing effects.
The freezing step is critical, since parameters such as the degree of supercooling and rate of freezing can affect the morphology of ice crystals, which in turn affects the rate of primary drying 17, 18. When a solution is supercooled to a large degree, ice nucleation occurs at lower temperatures with little time for ice crystal growth, resulting in smaller pores in the dried solid. These small pores offer greater resistance to the flow of water vapor through the porous bed of partially dried solids. This necessitates the use of a longer primary drying step to remove crystalline water. In contrast, a lower degree of supercooling is associated with a slower rate of freezing and a relatively small number of large ice crystals. Since ice nucleation is stochastic, cycles without controlled freezing are expected to nucleate over a range of temperatures, resulting in longer freezing times and heterogeneous ice crystal morphology. Variability is also introduced by vial position within the lyophilizer chamber 19, since vials near the door and walls of the lyophilizer chamber receive more heat via radiation than those near the center of the chamber. Together, these factors result in inter-vial- and inter-batch heterogeneity. If left uncontrolled, this variability may be magnified when a process is scaled from a laboratory bench-top lyophilizer to a production freeze-dryer. Heat- and mass-transfer differences between pilot and production freeze-dryers may also play a role, so that the same lyophilization cycle may produce variable product CQAs at different scales. Controlling the freezing step is critical to producing uniform ice crystal morphology, resulting in less variability between samples and faster drying. The freezing rate can also affect product stability, since smaller ice crystals formed by fast freezing present a greater surface area for potential protein adsorption and unfolding. Aggregation at the protein solution-ice interface has been implicated in the lyophilization-induced instability of human growth hormone 20, recombinant human factor XIII 21, lactate dehydrogenase and immunoglobulin G 3.
Strategies to control nucleation include the use of an ice fog as a seeding technique and rapid depressurization to induce spontaneous nucleation. While the effect of controlled ice nucleation on primary drying time has been well documented 22–25, its effect on protein structure is not well understood. Controlled nucleation at a lower degree of supercooling would be expected to result in relatively larger ice crystals with lower surface area for protein adsorption. This would be expected to produce a product that is more stable than one lyophilized without controlled nucleation. The effect of depressurization-induced controlled nucleation on product characteristics has been reported for a monoclonal antibody 26. Although the drying time was reduced by ~ 10 h and cake appearance improved to some extent with controlled nucleation, there was no significant impact on aggregation as detected by UV spectroscopy and size exclusion chromatography (SEC). Secondary structure was not altered significantly, as quantified by circular dichroism (CD) spectroscopy. The process did not affect binding to protein-A, suggesting that the tertiary structure was also intact, at least at the binding site. Other studies investigated the effect of different lyophilization cycles on protein conformation and cake structure 27, 28. While cycle variations typically led to altered cake morphology as detected using scanning electron microscopy (SEM), conformational changes could not be detected using conventional ssFTIR and solution-state CD and fluorescence spectroscopy.
In this work, the effects of controlled nucleation and lyophilizer scale on protein structure were examined using high-resolution mass spectrometric methods: solid-state hydrogen-deuterium exchange (ssHDX-MS) and solid-state photolytic labeling (ssPL-MS). To our knowledge, this is the first application of these methods to both process and formulation effects. The ControLyo® depressurization technology was used for controlled nucleation. Myoglobin (Mb) lyophilized in a LyoStar freeze-dryer with or without controlled nucleation showed no significant changes in structure at the backbone and side-chain levels, as determined by ssFTIR, ssHDX-MS and ssPL-MS, respectively. However, formulation effects were dominant and protein structure was better protected at the backbone in the presence of sucrose. The results indicate that, at least for the model protein used here, the local structure remains unaltered by controlled nucleation and that ssHDX-MS and ssPL-MS can be used to detect process- and formulation-induced changes in protein structure.
MATERIALS AND METHODS
Materials
Equine skeletal muscle holomyoglobin (Mb), sucrose, potassium phosphate dibasic and ammonium bicarbonate were purchased from Sigma Aldrich (St. Louis, MO). Potassium phosphate monobasic (anhydrous) was purchased from Amresco (Solon, OH). D2O was obtained from Cambridge Isotope Laboratories, Inc. (Andover, MA) and photo-leucine (L-2-amino-4, 4'-azipentanoic acid) from Thermo Scientific (Rockford, IL). Mass spectrometry-grade water, acetonitrile and formic acid were purchased from Fisher Scientific (Fair Lawn, NJ). Spectra/Por dialysis tubing (MWCO 8000–10000 Da) was used to dialyze the protein prior to formulation (Spectrum Laboratories, Inc., Rancho Dominguez, CA). Syringes (Beckton, Dickinson and Company, Franklin Lakes, NJ) and 0.2 μm Acrodisc® syringe filters (Pall Corporation, Ann Arbor, MI) were used to filter the dialysate.
Sample Preparation
Mb was dissolved in potassium phosphate buffer (2.5 mM, pH 7.4) and dialyzed overnight against the same buffer using dialysis tubing. The dialyzed protein was filtered using a syringe filter and its concentration measured using UV spectroscopy (8453 UV-Vis, Agilent Technologies, Santa Clara, CA) and the molar extinction coefficient ε555 nm = 12.92 mM−1cm−1 (obtained from Sigma Aldrich product information sheet for equine skeletal muscle myoglobin, product M0630). This stock solution (345 μM) was used for all formulations. A 20 mg/mL stock solution of sucrose was prepared by dissolving sucrose in potassium phosphate buffer (2.5 mM, pH 7.4) and stored at 4 °C until use. Similarly, a 30.9 mM stock solution of photo-leucine (pLeu) was prepared using the same buffer and stored at 4 °C until use.
Two formulations were prepared for lyophilization: a control formulation containing Mb and buffer (‘Mb-A’) and a formulation containing Mb, sucrose and buffer (‘Mb-B’). Stock solutions of Mb, sucrose and buffer were mixed such that the final Mb concentration was 70 μM and the ratio of Mb to sucrose was 1:1 w/w. For photolytic labeling studies, pLeu was added to Mb-A and Mb-B such that the molar ratio of pLeu to Mb was 100:1. The weight fractions of each component are listed in Table 1. The formulations were filled in glass tubing vials (USP Type I glass; 2 ml capacity) with 13 mm necks. The fill volume was 500 μL for ssHDX-MS, ssPL-MS, thermogravimetric analysis, X-ray diffraction and solid-state Fourier-transform infrared spectroscopy samples. A 3 mL fill in 10 mL-capacity glass beakers was used for scanning electron microscopy.
Table 1.
Weight fractions of components of lyophilized formulations
| Lyophilized Formulation | % w/w | |||
|---|---|---|---|---|
| Mb a | Sucrose a | Buffer | pLeu a | |
| Mb-A | 91.7 | N/A | 8.3 | N/A |
| Mb-B | 42.9 | 42.9 | 14.1 | N/A |
| Mb-A + pLeu | 46.0 | N/A | 15.1 | 38.8 |
| Mb-B + pLeu | 31.5 | 31.5 | 10.4 | 26.6 |
Mb, myoglobin; pLeu, photo-leucine (L-2-amino-4,4'-azipentanoic acid)
Lyophilization
Both Mb-A and Mb-B formulations were lyophilized with and without controlled nucleation during the freezing step. For freezing with controlled nucleation (LyoStar 3 with ControLyo®, SP Industries, Inc., Gardiner, NY), the vials were equilibrated at 5 °C for 30 min, followed by pressurization with argon gas to 28 psig and a decrease in temperature to −5 °C. A ramp rate of 1 °C/min was used and the vials were equilibrated at −5 °C for 60 min. At the end of this step, the chamber was rapidly depressurized to 1 psig to induce controlled nucleation. The temperature was further reduced to −45 °C at a ramp rate of 1 °C/min and held overnight to complete the freezing step. For freezing without controlled nucleation (LyoStar II, SP Industries), the vials were equilibrated at 5 °C for 60 min (ramp rate 1 °C/min) and then frozen at −45 °C overnight.
To minimize process variability, vials frozen with and without controlled nucleation were dried simultaneously in the LyoStar 3 lyophilizer. Vials frozen without controlled nucleation in LyoStar II were quickly transferred to LyoStar 3 and held at −45 °C for an additional 30 min. A vacuum of 70 mTorr was used and the shelf temperature was increased stepwise with a ramp rate of 1 °C/min (−35 °C for 600 min, −20 °C for 600 min, −5 °C for 360 min, 10 °C for 360 min). Product temperature was monitored during freezing and drying using 30 gauge Type T thermocouple sensors. Thermocouples were placed either inside the solution or taped to the outside of the vial. Upon ice nucleation, an increase in product temperature is detected associated with the latent heat of fusion; this change was used to establish the nucleation temperature. Chamber pressure was monitored using a capacitance manometer (CM) and Pirani gauge. The end point of each drying step was determined using a pre-set CM/Pirani gauge differential, wherein the cycle advanced to the next step if the differential was reached at the end of the previous step. Since the presence of thermocouples inside the solution may affect sample integrity, thermocouple-containing vials were not used for characterization studies.
X-ray Powder Diffraction
Samples were analyzed by X-ray powder diffraction to detect any crystallinity after lyophilization. Diffractograms were collected on a 2θ/θ scan from 7–35° 2θ with 0.02° increments using a SmartLab diffractometer (Rigaku Americas, TX).
Scanning Electron Microscopy (SEM)
Intact lyophilized cakes were removed from beakers and mounted on a sample holder with double-sided tape. The cakes were carefully sliced using a blade and sputter-coated with carbon graphite. Images were obtained using a JCM-6000 NeoScope benchtop instrument (JEOL USA, Peabody, MA) in the high vacuum, 15 kV mode.
Solid-State Fourier Transform Infrared (ssFTIR) Spectroscopy
FTIR spectra were acquired for all lyophilized samples using a Tensor 37 spectrometer (Bruker Optics, Billerica, MA), as described previously 29. 128 scans were obtained at 4 cm−1 resolution and spectra were processed using OPUS software (v. 6.5, Bruker Optics), by cutting around 1600–1700 cm−1, smoothing and baseline correcting before obtaining second derivative spectra.
Thermogravimetric Analysis (TGA)
Moisture sorption kinetics was measured using TGA (QA5000SA, TA Instruments, New Castle, DE) to study its effect on hydrogen-deuterium exchange kinetics. About one mg of lyophilized protein (with or without sucrose) was loaded onto a metallized quartz sample pan. The loosely bound water was removed by heating the sample to 40 °C, 0 % RH inside the sample chamber until the weight change was < 0.01 % and equilibrated for 1 h. The sample was then equilibrated at 5 °C, 0 % RH for 1 h, followed by moisture sorption at 5 °C, 43 % RH for 3 h inside the sample chamber. Initial moisture content was calculated from the weight change before and after equilibration at 40 °C, 0 % RH for 1 h.
Solid-state Hydrogen Deuterium Exchange- Mass Spectrometry (ssHDX-MS)
Lyophilized vials were uncapped and placed in a sealed desiccator equilibrated at 43 % RH over D2O (obtained with a saturated solution of potassium carbonate in D2O). HDX was allowed to proceed at 5 °C for 0.5, 2, 6, 12, 24, 48, 84 and 120 h. At each time point, samples were withdrawn, stoppered and flash-frozen in liquid N2 to quench the exchange reaction. The samples were stored at −80 °C until analysis.
HPLC-MS (1200 series HPLC, ESI-qTOF 6520, Agilent Technologies, Santa Clara, CA) was used to measure deuterium uptake at the intact level, as described previously 29, 30. Deuterated samples were reconstituted with 2 mL of ice-cold quench buffer (5 % methanol, 0.2 % formic acid in LC-MS-grade water, pH 2.5) and injected into a refrigerated box housing the HPLC valves, tubing and protein microtrap at ~ 0 °C to reduce back-exchange. The protein was eluted with a gradient mobile phase that increased from 30 % to 80 % acetonitrile over 3 min. Mass spectra for deuterated samples were deconvoluted using MassHunter software (Agilent Technologies), and the number of deuterons incorporated was calculated by subtracting the mass of the undeuterated protein from the mass of the deuterated protein. Values reported are not corrected for back exchange and peak widths of the deconvoluted intact protein spectra were measured at 20 % peak height.
Solid-state Photolytic Labeling- Mass Spectrometry (ssPL-MS)
Lyophilized Mb-A and Mb-B vials containing pLeu were uncapped and irradiated at 365 nm for 40 min using Stratalinker 2400 (Stratagene Corp., La Jolla, CA) as described previously 31. The cakes were then reconstituted with 500 μL ammonium bicarbonate (100 mM, pH 8.0), diluted to 20 pmol and analyzed at the intact protein level by LC-MS. The same elution parameters were used as described above for ssHDX-MS, but with analysis performed at room temperature since the pLeu label does not undergo back-exchange. The fractions of protein populations with 0–2 labels (F L=0, 1, 2) were calculated from peak heights observed on the extracted ion chromatogram (EIC), as follows:
To identify the sites of labeling at the peptide level, the labeled Mb formulations were digested with trypsin (1:10 ratio of trypsin to protein) at 60 °C for 16 h. Labeled peptides were analyzed by LC-MS using the method described previously 31 and identified with MassHunter, using a theoretical mass list of tryptic peptides with up to 2 labels.
Statistical Analysis
Process- and excipient effects on protein structure were compared statistically using GraphPad Prism software (GraphPad software, version 6; La Jolla, CA). One-way ANOVA followed by Tukey’s test was used for multiple comparisons (p = 0.05).
RESULTS
Effect of Freezing Step on Nucleation Temperature
Product temperatures for Mb-A (excipient-free formulation) and Mb-B (sucrose-containing formulation) frozen with and without controlled nucleation were recorded (Fig. 1 A, B). The point at which product temperature increased sharply to just below 0 °C was considered to be the nucleation temperature. Without controlled nucleation, nucleation temperatures ranged from −5.7 °C to −9.4 °C (mean ± SD, Fig. 1 A) and all the thermocouple-containing vials nucleated within 10 min of each other. With controlled nucleation, all the vials containing thermocouples inside the solution nucleated simultaneously at −5.3 ± 0.2 °C (Fig. 1 B), irrespective of formulation. In samples subjected to controlled nucleation with thermocouples taped to the outside of the vials, somewhat higher nucleation temperatures of −4.0 °C (Mb-A) and −4.4 °C (Mb-B) were observed (Fig 1 B). In samples without controlled nucleation (Fig. 1 A), differences in nucleation temperature due to the position of the thermocouple were less obvious, perhaps due to greater overall variability in the nucleation process.
Figure 1.

Product temperature profiles for excipient-free (Mb-A) and sucrose-containing (Mb-B) myoglobin lyophilized without controlled nucleation (panel A) and with controlled nucleation (panel B). Thermocouple probes (TC) were placed inside the vial (labeled Mb-A in, Mb-B in) or taped to the outside of the vial (labeled Mb-A out, Mb-B out). The shelf set point (shelf SP) temperature is represented by the black line in panels A and B.
Measurement of Supercooling during the Freezing Step
In the absence of ice nucleation sites, a solution can remain in a supercooled liquid state without undergoing phase transition into a solid as the temperature is lowered below its freezing point. To estimate the extent of supercooling in freezing with uncontrolled nucleation, thermocouples were taped to the outside of the vial to avoid thermocouple-related bias. However, this may introduce uncertainty as a thermal lag is expected for thermocouples placed on the outside of the vial. Hence thermocouples were placed both outside and inside the vial for 2 vials each for Mb-A and Mb-B. These thermocouples reported similar temperatures, suggesting that thermal lag was minimum and the nucleation temperature recorded was reproducible (Fig. 2 A, B). Mb-A showed supercooling to ~ −7.5 ± 0.4 °C and Mb-B showed supercooling to ~ −9.1 ± 0.4 °C, as measured by thermocouples placed both inside and outside the vial. Moreover, vials with thermocouples only in contact with the solution showed greater supercooling than vials with thermocouples only on the outside (Fig. 1A). The reason for this is unclear and the data are contrary to the expected result of increased nucleation temperature due to the presence of the thermocouple.
Figure 2.

Extent of supercooling for excipient-free (Mb-A, panel A) and sucrose-containing (Mb-B, panel B) myoglobin formulations lyophilized without controlled nucleation. Thermocouples were placed inside the vial in contact with the solution and also taped to the outside of the same vial. Mb-A showed supercooling to ~ −7.5 ± 0.4 °C and Mb-B showed supercooling to ~ −9.1 ± 0.4 °C as measured by thermocouples placed both inside and outside the vial.
Solid-State Characterization by X-ray Diffraction and FTIR
All the formulations were amorphous after freeze-drying and produced X-ray diffraction patterns consistent with amorphous materials (Supporting Information, Fig. S1). Both Mb-A and Mb-B retained some degree of alpha helicity, observed as a peak at about 1652 cm−1 in the second-derivative FTIR spectra (Fig. 3). Mb-B with and without controlled nucleation showed a more intense and narrower alpha helix peak than excipient-free Mb-A formulations, although there was no appearance of beta sheet peaks in any of the spectra (Fig. 3; beta sheet signals are usually observed at 1640–1625 cm−1 and 1695–1690 cm−1 34). Overall, the two processes appear to have affected peak intensity and position, but without the formation of non-native secondary structure.
Figure 3.

Second-derivative solid-state FTIR spectra for excipient-free (Mb-A) and sucrose-containing (Mb-B) lyophilized myoglobin formulations. Spectra were obtained for Mb-A and Mb-B formulations lyophilized with controlled (black and gray continuous curves respectively) and without controlled nucleation (black and gray dashed curves respectively).
Cake Morphology
SEM images showed porous cakes for all formulations. Mb-A and Mb-B lyophilized with controlled nucleation showed more uniform pore structure than the formulations lyophilized without controlled nucleation (Fig. 4, Supporting Information Fig. S2). Mb-A lyophilized with and without controlled nucleation showed large plate-like morphology (Supporting Information Fig. S2, panels A, B) and Mb-B lyophilized with and without controlled nucleation showed thinner plates (Supporting Information Fig. S2, panels C, D). The data are consistent with the degree of supercooling (Fig. 1), since the formulations lyophilized with controlled nucleation showed a lower degree of supercooling and larger pores than those lyophilized without controlled nucleation.
Figure 4.

SEM images of excipient-free (Mb-A; panels A, B) and sucrose-containing (Mb-B; panels C, D) lyophilized myoglobin formulations. Panels A, C: Formulations lyophilized with controlled nucleation; Panels B, D: Formulations lyophilized without controlled nucleation. The top and bottom of each image represent the top and bottom of the cake respectively. Scale bars are set at 1 mm.
Effects of Formulation and Process on Protein Backbone by ssHDX-MS
Deuterated intact protein mass spectra showed an increase in mass compared to the undeuterated protein (Fig. 5). Since sorption and diffusion of D2O from the vapor phase into the solid must precede the hydrogen-deuterium exchange reaction in the solid state, the observed ssHDX rate can be affected by the rate and extent of sorption 30. To determine the effect of D2O sorption on ssHDX kinetics, moisture uptake was measured using TGA to simulate D2O uptake at 43 % humidity. Moisture sorption at 43 % RH was complete within 1 h for both Mb-A and Mb-B formulations, irrespective of the type of freezing (Fig. S3). Since ssHDX continues over several hours, it is unlikely that sorption kinetics have a significant effect on ssHDX kinetics beyond 1 h.
Figure 5.

Deconvoluted mass spectra for excipient-free (Mb-A) and sucrose-containing (Mb-B) myoglobin formulations after 48 h of solid-state hydrogen-deuterium exchange at 5 °C, 43 % RH. Mass spectra were obtained for Mb-A and Mb-B lyophilized with controlled nucleation (black and gray continuous curves respectively) and without controlled nucleation (black and gray dashed curves respectively). The dashed and dotted curve represents the deconvoluted spectrum for undeuterated protein.
ssHDX was relatively rapid in both Mb-A and Mb-B formulations lyophilized with or without controlled nucleation up to ~ 24 h and slowed at ~ 84 h for all samples (Fig. 6). At each time point, sucrose-containing formulations showed significantly lower deuterium uptake than the excipient-free formulations, suggesting greater backbone protection in the solid state. Deuterium uptake in the Mb-A formulation was not significantly different (p > 0.05, one-way ANOVA with Tukey’s analysis) when the protein was frozen with or without controlled nucleation (Fig. 6, closed and open circles); similar results were observed for Mb-B with or without controlled nucleation (Fig. 6, closed and open triangles). The initial moisture content after lyophilization (without incubation over water or D2O) of the formulations as measured by TGA were as follows: 2.9 % (Mb-A, controlled nucleation), 4.0 % (Mb-A, uncontrolled nucleation), 3.4 % (Mb-B, controlled nucleation) and 3.1 % (Mb-B, uncontrolled nucleation). Using TGA to simulate D2O sorption and measure moisture sorption at 43 % RH, differences in moisture sorption were observed between Mb-A and Mb-B formulations, but not between controlled and uncontrolled nucleation. Mb-A lyophilized with and without controlled nucleation sorbed ~ 0.12 and 0.13 g water/g dry solid respectively (~ 12.3 % and 12.7 % moisture respectively), and Mb-B lyophilized with and without controlled nucleation sorbed ~ 0.09 g water/g dry solid respectively (~ 9.4 % moisture for both; Fig. S3) within 1 h of incubation. Hence the increased deuterium uptake for Mb-A may be related to the extent of moisture sorption, at least until 1 h.
Figure 6.
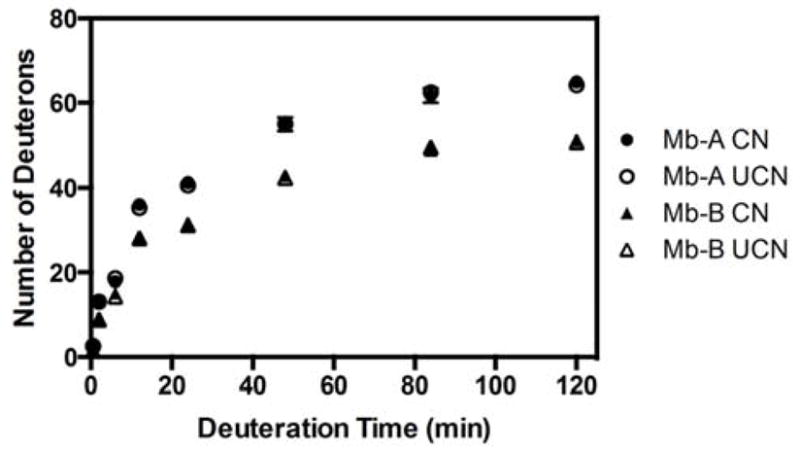
Deuterium uptake kinetics for excipient-free myoglobin (Mb-A) lyophilized with and without controlled nucleation (closed and open circles respectively) and myoglobin-sucrose formulation (Mb-B) lyophilized with and without controlled nucleation (closed and open triangles respectively). Each point represents the average number of deuterons (n = 3, ± SD) incorporated after incubation at 43 % RH, 5 °C for 0.5, 2, 6, 12, 24, 48, 84 and 120 h.
Comparison of peak widths at similar deuterium uptake levels can provide information on the conformational and/or spatial heterogeneity of protein in different formulations. The sucrose formulation lyophilized with or without controlled nucleation showed significantly narrower peak widths (p < 0.05, one-way ANOVA with Tukey’s analysis) than the excipient-free formulation at ~ 28 % deuteration (Fig. 5, Table 2). Peak widths for Mb-B were about 26 % less than those for Mb-A formulations, irrespective of the type of freezing. No significant differences in peak widths were observed between controlled and uncontrolled nucleation within each formulation.
Table 2.
ssHDX-MS peak widths for myoglobin formulations in the absence (Mb-A) and presence (Mb-B) of sucrose lyophilized with or without controlled nucleation. Peak widths at ~28 % deuteration were calculated from the deconvoluted mass spectra for each formulation at 20 % peak height.
| Formulation | Peak Width (Da) | |
|---|---|---|
| Controlled Nucleation | Uncontrolled Nucleation | |
| Mb-A a | 38.0 ± 1.0 | 38.3 ± 0.6 |
| Mb-B a | 28.0 ± 0.0 | 27.7 ± 0.6 |
Mb-A, myoglobin lyophilized without excipients; Mb-B, myoglobin lyophilized with sucrose
Effects of Formulation and Process on Protein Side-Chain by ssPL-MS
Up to 2 pLeu labels were detected for all formulations lyophilized with pLeu and irradiated with UV light (Fig. 7A). Mb-A lyophilized with and without controlled nucleation showed similar pLeu incorporation (Fig. 7B). About 7 (± 1) % and 6 (± 1) % of the protein population was labeled for Mb-A with and without controlled nucleation respectively, as detected by LC-MS. Similar pLeu incorporation (7 ± 1 %) was observed for Mb-B without controlled nucleation. The greatest pLeu incorporation was detected for Mb-B with controlled nucleation (11 ± 1 %). Comparing Mb-A and Mb-B formulations lyophilized with controlled nucleation, the fraction of intact protein labeled increased significantly for Mb-B. There was no significant difference in the fraction of labeled protein in Mb-A and Mb-B formulations lyophilized without controlled nucleation.
Figure 7.

(A) Deconvoluted mass spectra for unlabeled myoglobin (dotted line) and myoglobin labeled with photo-leucine (solid line). The spectrum for labeled myoglobin has been offset vertically to show differences. Peaks corresponding to the mass of unlabeled (0 L, ~ 16951 Da) and protein with 1 label (1 L, ~ 17066 Da) were detected. A peak for myoglobin labeled with 2 labels (~ 17182 Da) was also detected, but not shown here since the intensity was low. Similar spectra with up to 2 labels were obtained for excipient-free (Mb-A) and sucrose-containing (Mb-B) myoglobin formulations lyophilized with and without controlled nucleation. (B) Fraction of protein labeled with photo-leucine for Mb-A and Mb-B formulations lyophilized with controlled nucleation (CN) or without controlled nucleation (UCN). The fraction was calculated using peak heights of labeled protein on the extracted ion chromatogram (EIC) obtained by LC-MS. The bars show the mean (± SD) of three LC-MS injections. The following pairs showed significantly different means (p < 0.05, GraphPad Prism) using one-way ANOVA: Mb-A CN vs. Mb-B CN and Mb-B CN vs. Mb-B UCN.
At the peptide level, complete sequence coverage was obtained after tryptic digestion and LC-MS analysis. Since photolytic labeling is associated with some degree of variability due to promiscuity of the carbene reaction, matrix heterogeneity and ionization efficiencies of labeled and unlabeled peptides, only labeled peptides that were detected in at least 2 of triplicate LC-MS injections were considered. Mb-A lyophilized with controlled nucleation and Mb-A and Mb-B lyophilized without controlled nucleation were labeled at peptide His103-Lys118 (Fig. 8A). Mb-B lyophilized with controlled nucleation was labeled at peptides Leu32-Lys42 and His103-Lys118 (Fig. 8B).
Figure 8.

Peptide-level labeling with photo-leucine for (A) excipient-free (Mb-A) myoglobin lyophilized with controlled nucleation. (B) Sucrose-containing (Mb-B) myoglobin lyophilized with controlled nucleation Labeled peptides Leu32-Lys42 and Tyr103-Lys118 are represented in blue and the heme group is shown in red. Mb-A and Mb-B lyophilized without controlled nucleation showed the same labeling pattern on Tyr103-Lys118 as represented in panel (A). The crystal structure for holomyoglobin was obtained from the Protein Data Bank (www.rcsb.org; PDB ID 1WLA) and PyMOL was used to generate labeled ribbon diagrams (PyMOL Molecular Graphics System, Version 1.4.1, Schrödinger, LLC).
DISCUSSION
During scale-up in an aseptic environment, lyophilization vials are expected to supercool to a greater degree than in a laboratory environment where there are more particulates. This, combined with vial position effects and the stochastic nature of ice nucleation, produces heterogeneous nucleation temperatures and ice crystal sizes in the sterile environment, resulting in prolonged drying cycles. Controlled nucleation can help improve inter-vial and inter-batch homogeneity and reduce drying times. Lyophilization-induced structural changes may affect protein stability when a process is transferred from laboratory-scale to production, however, and these changes may not be detected using conventional, global methods such as ssFTIR and differential scanning calorimetry. Here, we report the use of high-resolution ssHDX-MS and ssPL-MS to detect conformational changes in lyophilized formulations with process and formulation differences.
ssHDX-MS results indicate that deuterium incorporation was affected significantly by formulation, but not the freezing step (Figs. 5, 6). Deuterium incorporation in the excipient-free formulation (Mb-A) was greater than in the formulation containing sucrose (Mb-B), consistent with greater structural perturbation and/or a decrease in matrix interactions in Mb-A (Fig. 5). Deuterium incorporation in both the excipient-free formulation and the sucrose-containing formulation was relatively unaffected by the freezing step (Fig. 5, black vs. grey continuous and dashed curves). That the type of freezing (controlled vs. uncontrolled nucleation) does not affect deuterium incorporation for both Mb-A and Mb-B suggests that the process does not significantly alter protein structure under these conditions. These findings are supported by ssHDX-MS kinetics (Fig. 6) and are consistent with trends in FTIR band position and band intensity (Fig. 3).
In analyzing deuterium uptake kinetics, the peak width provides a measure of protein structural heterogeneity resulting from the distribution of deuterated populations 35, 36. Small increases in mass due to deuteration may not be detected if the peaks are not sufficiently resolved. This can cause peak broadening, wherein multiple deuterated populations comprise a wider peak. Peak widths for the Mb-A formulation were significantly greater than for Mb-B for both processes, consistent with greater structural and/or spatial heterogeneity in Mb-A than in Mb-B (Table 2). Within Mb-A or Mb-B formulations, peak widths for samples from the two processes were not significantly different (Table 2), suggesting similar structural and/or spatial heterogeneity with controlled and uncontrolled nucleation.
Like ssHDX-MS, ssPL-MS provides qualitative and quantitative information on proteins in the solid state. Since the mass of a pLeu label (~ 115 Da) is much greater than that of a deuterium label, mass spectrometric peaks for unlabeled and singly labeled protein can be resolved easily and peak broadening is not observed. Assuming uniform pLeu distribution in the matrix, the fraction of protein labeled by pLeu quantifies the fraction of protein with side-chain exposure to pLeu. The fraction of labeled protein and map of the labeled regions (Figs. 7B, 8) provide information on pLeu exposure at the side-chain level. In the presence of sucrose in the lyophilized matrix, it is expected that pLeu labeling efficiency will be somewhat reduced, resulting in decreased labeling compared to an excipient-free formulation. However, pLeu labeling in the Mb-B formulation was similar to Mb-A (uncontrolled nucleation) or greater (controlled nucleation) (Fig. 7). Within Mb-A formulations, the fraction of labeled protein was similar (Fig. 7) and within Mb-B formulations, the fraction of labeled protein was greater for controlled nucleation than for uncontrolled nucleation, consistent with greater interactions with the matrix. This suggests that while uncontrolled nucleation results in equivalent side-chain matrix exposure in the presence or absence of sucrose, controlled nucleation affects side-chain exposure in the presence of sucrose.
Intact- and peptide-level pLeu labeling data indicate that side-chain exposure to pLeu is different for Mb-B lyophilized with controlled nucleation than for the other formulations, suggesting more favorable contacts between the protein and pLeu (Figs. 7, 8). The reasons for the increased fraction of labeled protein in Mb-B with controlled nucleation are not clear, but may be related to the distribution of pLeu and protein in the formulation and/or changes in protein conformation. Although the carbene species generated by photolysis of pLeu is non-specific in its reactivity and can react with any X-H bond (X = C, O, N, S) or C=C bond, greater labeling at carboxylate residues has been reported in solution 37. This has been attributed to electrostatically-driven pre-concentration of pLeu and limited carbene diffusion in the frozen state. In the current study, the specific amino acids that were labeled could not be confirmed; however, labeling was detected at no more than 2 peptides. This limited labeling may be due to pLeu sequestration and/or solvent accessibility and excipient effects. Hence further studies are warranted to understand the relationship between labeling and protein structure.
Inhomogeneity in the freeze-concentrated liquid after ice crystallization has also been reported previously 38–40. In addition, efficiency of UV light penetration may also affect protein labeling. Smaller fill volumes result in lower cake height and better labeling efficiency (Supporting Information, Figure S4). Hence, ssPL-MS may not be representative of protein structure across the entire cake. Moreover, the uniform and large pore structure for Mb-B lyophilized with controlled nucleation may permit more efficient irradiation and pLeu labeling. Differences in cake crystallinity may also affect UV light scattering and labeling efficiency, although this could not be probed in the amorphous system studied here. Labeling of sucrose by pLeu was not detected by LC-MS, but may also affect protein labeling. Previous ssPL-MS results in our lab showed greater protein labeling in the presence of sucrose compared to guanidine hydrochloride31. It is difficult to distinguish the effect of excipients from the effect of protein conformation on the nature of solid-state labeling observed, and stability studies are needed to correlate the fraction of labeled protein with structure retention and better interpret the side-chain labeling results.
Together, the results demonstrate that controlled nucleation did not significantly affect protein conformation in this study as determined by ssFTIR and ssHDX-MS (Figs. 5, 6, 7 and 8) and may offer the advantage of reduced drying time. A similar absence of structural changes has been reported for IgG lyophilized with and without controlled nucleation 26, although solution-state analytical methods were used. Formulation effects were more dominant than process effects. ssPL-MS results suggest that interactions between Mb side chains and the matrix are greater in formulations containing sucrose and subjected to controlled nucleation (Fig. 8). Thus, the ssHDX-MS and ssPL-MS results together suggest that protein conformation is similar in all formulations but that matrix contacts are somewhat greater in Mb-B with controlled nucleation. Additional studies on the effects of controlled nucleation on protein structure, as well as continued development of ssHDX-MS and ssPL-MS, are needed in order to extend these results to other proteins and excipient systems.
There were several unexpected observations in this study that merit further investigation. In preliminary controlled nucleation experiments using a fill volume of 200 μL and nitrogen as the gas for pressurization, nucleation did not take place at −5 °C. Instead, nucleation proceeded in an uncontrolled manner. Controlled nucleation at −5 °C did take place when a fill volume of 500 μL was used in combination with argon as the pressurization gas. Further investigation is needed in order to understand the role of vial size, relative fill volume, and pressurization gas on the robustness of the nucleation process using rapid depressurization. Controlled nucleation by rapid depressurization is highly directional, always proceeding from the top of the fill volume downward. For very small fill volumes, the dynamics of this top-down process is quickly interrupted. It would be useful to study the effect of relative fill volume on protein structure perturbation using controlled nucleation by rapid depressurization. Generally speaking, the vials containing thermocouples nucleate before the unmonitored vials. That did not happen when monitoring uncontrolled nucleation in this study. In fact, the vials containing thermocouples nucleated last. This could have been a random occurrence, but it may be useful to further examine the influence of thermocouples on nucleation when using very small fill volumes.
The smaller size and greater mobility of the deuterium label compared to pLeu may result in more labeling, allowing small differences in local structure to be better detected by ssHDX-MS. Previous ssHDX-MS studies in our lab have shown a correlation between deuterium incorporation in freshly lyophilized samples and aggregation during storage over a year, with greater stability for formulations showing lower deuterium incorporation 29. It is reasonable to expect a similar correlation for process-induced differences in ssHDX-MS, though extended storage stability studies were not conducted here. Based on this previous report and the ssHDX-MS results for intact Mb presented here (Fig. 5), stability would be expected to decrease in the order: (Mb-B without controlled nucleation) = (Mb-B with controlled nucleation) > (Mb-A without controlled nucleation) = (Mb-A with controlled nucleation). A similar trend in structure retention was observed by ssFTIR, although the data are qualitative. To our knowledge, the relationship between ssPL-MS results and storage stability has not yet been explored.
Conclusions
Two formulations of Mb (with or without sucrose) were lyophilized according to the same lyophilization cycle with or without controlled nucleation and the effects on Mb conformation in the lyophilized solids were assessed using ssFTIR, ssHDX-MS and ssPL-MS. Formulation effects were dominant, with formulations containing sucrose showing better retention of structure by all measures than formulations without sucrose. Samples lyophilized with controlled nucleation did not differ from those lyophilized without controlled nucleation by most measures of structure. ssPL-MS showed greater pLeu incorporation and the involvement of more regions of the Mb molecule in Mb lyophilized with controlled nucleation in the presence of sucrose than for other conditions, suggesting greater protein-matrix interactions. The data support the use of ssHDX-MS and ssPL-MS to study formulation and process-induced conformational changes in lyophilized proteins.
Supplementary Material
Acknowledgments
The authors are grateful for funding from NIH R01 GM08523 (PI: E. Topp) and thank Jing Ling and Lisa Hardwick for assistance with lyophilization, Ehab Moussa for assistance with X-ray diffraction and Dr. Na Li for assistance with TGA experiments.
Footnotes
This article contains supplementary material available from the authors upon request or via the Internet at http://onlinelibrary.wiley.com
Publisher's Disclaimer: This is a PDF file of an unedited manuscript that has been accepted for publication. As a service to our customers we are providing this early version of the manuscript. The manuscript will undergo copyediting, typesetting, and review of the resulting proof before it is published in its final citable form. Please note that during the production process errors may be discovered which could affect the content, and all legal disclaimers that apply to the journal pertain.
References
- 1.Bhatnagar BS, Bogner RH, Pikal MJ. Protein stability during freezing: separation of stresses and mechanisms of protein stabilization. Pharm Dev Technol. 2007;12(5):505–523. doi: 10.1080/10837450701481157. [DOI] [PubMed] [Google Scholar]
- 2.Anchordoquy TJ, Carpenter JF. Polymers protect lactate dehydrogenase during freeze-drying by inhibiting dissociation in the frozen state. Arch Biochem Biophys. 1996;332(2):231–238. doi: 10.1006/abbi.1996.0337. [DOI] [PubMed] [Google Scholar]
- 3.Schwegman JJ, Carpenter JF, Nail SL. Evidence of partial unfolding of proteins at the ice/freeze-concentrate interface by infrared microscopy. J Pharm Sci. 2009;98(9):3239–3246. doi: 10.1002/jps.21843. [DOI] [PubMed] [Google Scholar]
- 4.Luthra S, Obert JP, Kalonia DS, Pikal MJ. Investigation of drying stresses on proteins during lyophilization: differentiation between primary and secondary-drying stresses on lactate dehydrogenase using a humidity controlled mini freeze-dryer. J Pharm Sci. 2007;96(1):61–70. doi: 10.1002/jps.20758. [DOI] [PubMed] [Google Scholar]
- 5.Prestrelski SJ, Arakawa T, Carpenter JF. Separation of freezing- and drying-induced denaturation of lyophilized proteins using stress-specific stabilization. II. Structural studies using infrared spectroscopy. Arch Biochem Biophys. 1993;303(2):465–473. doi: 10.1006/abbi.1993.1310. [DOI] [PubMed] [Google Scholar]
- 6.Chang BS, Kendrick BS, Carpenter JF. Surface-induced denaturation of proteins during freezing and its inhibition by surfactants. J Pharm Sci. 1996;85(12):1325–1330. doi: 10.1021/js960080y. [DOI] [PubMed] [Google Scholar]
- 7.Pikal-Cleland KA, Carpenter JF. Lyophilization-induced protein denaturation in phosphate buffer systems: monomeric and tetrameric beta-galactosidase. J Pharm Sci. 2001;90(9):1255–1268. doi: 10.1002/jps.1078. [DOI] [PubMed] [Google Scholar]
- 8.Izutsu K, Kojima S. Excipient crystallinity and its protein-structure-stabilizing effect during freeze-drying. J Pharm Pharmacol. 2002;54(8):1033–1039. doi: 10.1211/002235702320266172. [DOI] [PubMed] [Google Scholar]
- 9.Cao W, Xie Y, Krishnan S, Lin H, Ricci M. Influence of process conditions on the crystallization and transition of metastable mannitol forms in protein formulations during lyophilization. Pharm Res. 2013;30(1):131–139. doi: 10.1007/s11095-012-0855-9. [DOI] [PubMed] [Google Scholar]
- 10.Kauppinen A, Toiviainen M, Aaltonen J, Korhonen O, Jarvinen K, Juuti M, Pellinen R, Ketolainen J. Microscale freeze-drying with Raman spectroscopy as a tool for process development. Anal Chem. 2013;85(4):2109–2116. doi: 10.1021/ac3027349. [DOI] [PubMed] [Google Scholar]
- 11.Kim AI, Akers MJ, Nail SL. The physical state of mannitol after freeze-drying: effects of mannitol concentration, freezing rate, and a noncrystallizing cosolute. J Pharm Sci. 1998;87(8):931–935. doi: 10.1021/js980001d. [DOI] [PubMed] [Google Scholar]
- 12.Breen ED, Curley JG, Overcashier DE, Hsu CC, Shire SJ. Effect of moisture on the stability of a lyophilized humanized monoclonal antibody formulation. Pharm Res. 2001;18(9):1345–1353. doi: 10.1023/a:1013054431517. [DOI] [PubMed] [Google Scholar]
- 13.Pikal MJ, Rigsbee D, Roy ML. Solid state stability of proteins III: calorimetric (DSC) and spectroscopic (FTIR) characterization of thermal denaturation in freeze dried human growth hormone (hGH) J Pharm Sci. 2008;97(12):5122–5131. doi: 10.1002/jps.21386. [DOI] [PubMed] [Google Scholar]
- 14.Jiang S, Nail SL. Effect of process conditions on recovery of protein activity after freezing and freeze-drying. Eur J Pharm Biopharm. 1998;45(3):249–257. doi: 10.1016/s0939-6411(98)00007-1. [DOI] [PubMed] [Google Scholar]
- 15.Schersch K, Betz O, Garidel P, Muehlau S, Bassarab S, Winter G. Systematic investigation of the effect of lyophilizate collapse on pharmaceutically relevant proteins, part 2: stability during storage at elevated temperatures. J Pharm Sci. 2012;101(7):2288–2306. doi: 10.1002/jps.23121. [DOI] [PubMed] [Google Scholar]
- 16.Fitzpatrick K, Kendrick B, Santos C, Green P, Zhang B, Hunt D, Ronk M, Luo Y. Freeze-Dry Mediated Formation of 5-(Hydroxylmethyl)furfural. Developments in Biotechnology and Bioprocessing. 2013;1125:129–145. [Google Scholar]
- 17.Kasper JC, Friess W. The freezing step in lyophilization: physico-chemical fundamentals, freezing methods and consequences on process performance and quality attributes of biopharmaceuticals. Eur J Pharm Biopharm. 2011;78(2):248–263. doi: 10.1016/j.ejpb.2011.03.010. [DOI] [PubMed] [Google Scholar]
- 18.Hottot A, Vessot S, Andrieu J. A Direct Characterization Method of the Ice Morphology. Relationship Between Mean Crystals Size and Primary Drying Times of Freeze-Drying Processes. Drying Technology. 2004;22(8):2009–2021. [Google Scholar]
- 19.Rambhatla S, Tchessalov S, Pikal MJ. Heat and mass transfer scale-up issues during freeze-drying, III: control and characterization of dryer differences via operational qualification tests. AAPS PharmSciTech. 2006;7(2):E39. doi: 10.1208/pt070488. [DOI] [PMC free article] [PubMed] [Google Scholar]
- 20.Eckhardt BM, Oeswein JQ, Bewley TA. Effect of freezing on aggregation of human growth hormone. Pharm Res. 1991;8(11):1360–1364. doi: 10.1023/a:1015888704365. [DOI] [PubMed] [Google Scholar]
- 21.Kreilgaard L, Jones LS, Randolph TW, Frokjaer S, Flink JM, Manning MC, Carpenter JF. Effect of Tween 20 on freeze-thawing- and agitation-induced aggregation of recombinant human factor XIII. J Pharm Sci. 1998;87(12):1597–1603. doi: 10.1021/js980126i. [DOI] [PubMed] [Google Scholar]
- 22.Nakagawa K, Hottot A, Vessot S, Andrieu J. Influence of controlled nucleation by ultrasounds on ice morphology of frozen formulations for pharmaceutical proteins freeze-drying. Chemical Engineering and Processing: Process Intensification. 2006;45(9):783–791. [Google Scholar]
- 23.Rambhatla S, Ramot R, Bhugra C, Pikal MJ. Heat and mass transfer scale-up issues during freeze drying: II. Control and characterization of the degree of supercooling. AAPS PharmSciTech. 2004;5(4):e58. doi: 10.1208/pt050458. [DOI] [PMC free article] [PubMed] [Google Scholar]
- 24.Passot S, Trelea IC, Marin M, Galan M, Morris GJ, Fonseca F. Effect of controlled ice nucleation on primary drying stage and protein recovery in vials cooled in a modified freeze-dryer. J Biomech Eng. 2009;131(7):074511. doi: 10.1115/1.3143034. [DOI] [PubMed] [Google Scholar]
- 25.Konstantinidis AK, Kuu W, Otten L, Nail SL, Sever RR. Controlled nucleation in freeze-drying: effects on pore size in the dried product layer, mass transfer resistance, and primary drying rate. J Pharm Sci. 2011;100(8):3453–3470. doi: 10.1002/jps.22561. [DOI] [PubMed] [Google Scholar]
- 26.Awotwe-Otoo D, Agarabi C, Read EK, Lute S, Brorson KA, Khan MA, Shah RB. Impact of controlled ice nucleation on process performance and quality attributes of a lyophilized monoclonal antibody. Int J Pharm. 2013;450(1–2):70–78. doi: 10.1016/j.ijpharm.2013.04.041. [DOI] [PubMed] [Google Scholar]
- 27.Parker A, Rigby-Singleton S, Perkins M, Bates D, Le Roux D, Roberts CJ, Madden-Smith C, Lewis L, Teagarden DL, Johnson RE, Ahmed SS. Determination of the influence of primary drying rates on the microscale structural attributes and physicochemical properties of protein containing lyophilized products. J Pharm Sci. 2010;99(11):4616–4629. doi: 10.1002/jps.22185. [DOI] [PubMed] [Google Scholar]
- 28.Lewis LM, Johnson RE, Oldroyd ME, Ahmed SS, Joseph L, Saracovan I, Sinha S. Characterizing the freeze-drying behavior of model protein formulations. AAPS PharmSciTech. 2010;11(4):1580–1590. doi: 10.1208/s12249-010-9530-9. [DOI] [PMC free article] [PubMed] [Google Scholar]
- 29.Moorthy BS, Schultz SG, Kim SG, Topp EM. Predicting protein aggregation during storage in lyophilized solids using solid state amide hydrogen/deuterium exchange with mass spectrometric analysis (ssHDX-MS) Mol Pharm. 2014;11(6):1869–1879. doi: 10.1021/mp500005v. [DOI] [PMC free article] [PubMed] [Google Scholar]
- 30.Sophocleous AM, Zhang J, Topp EM. Localized hydration in lyophilized myoglobin by hydrogen-deuterium exchange mass spectrometry. 1. Exchange mapping. Mol Pharm. 2012;9(4):718–726. doi: 10.1021/mp3000088. [DOI] [PMC free article] [PubMed] [Google Scholar]
- 31.Iyer LK, Moorthy BS, Topp EM. Photolytic labeling to probe molecular interactions in lyophilized powders. Mol Pharm. 2013;10(12):4629–4639. doi: 10.1021/mp4004332. [DOI] [PMC free article] [PubMed] [Google Scholar]
- 32.Roy ML, Pikal MJ. Process control in freeze drying: determination of the end point of sublimation drying by an electronic moisture sensor. J Parenter Sci Technol. 1989;43(2):60–66. [PubMed] [Google Scholar]
- 33.Patel SM, Doen T, Pikal MJ. Determination of end point of primary drying in freeze-drying process control. AAPS PharmSciTech. 2010;11(1):73–84. doi: 10.1208/s12249-009-9362-7. [DOI] [PMC free article] [PubMed] [Google Scholar]
- 34.Kong J, Yu S. Fourier transform infrared spectroscopic analysis of protein secondary structures. Acta Biochim Biophys Sin (Shanghai) 2007;39(8):549–559. doi: 10.1111/j.1745-7270.2007.00320.x. [DOI] [PubMed] [Google Scholar]
- 35.Sophocleous AM, Topp EM. Localized hydration in lyophilized myoglobin by hydrogen-deuterium exchange mass spectrometry. 2. Exchange kinetics. Mol Pharm. 2012;9(4):727–733. doi: 10.1021/mp2004093. [DOI] [PMC free article] [PubMed] [Google Scholar]
- 36.Weis DD, Wales TE, Engen JR, Hotchko M, Ten Eyck LF. Identification and characterization of EX1 kinetics in H/D exchange mass spectrometry by peak width analysis. J Am Soc Mass Spectrom. 2006;17(11):1498–1509. doi: 10.1016/j.jasms.2006.05.014. [DOI] [PubMed] [Google Scholar]
- 37.Jumper CC, Bomgarden R, Rogers J, Etienne C, Schriemer DC. High-resolution mapping of carbene-based protein footprints. Anal Chem. 2012;84(10):4411–4418. doi: 10.1021/ac300120z. [DOI] [PubMed] [Google Scholar]
- 38.Dong J, Hubel A, Bischof JC, Aksan A. Freezing-induced phase separation and spatial microheterogeneity in protein solutions. J Phys Chem B. 2009;113(30):10081–10087. doi: 10.1021/jp809710d. [DOI] [PubMed] [Google Scholar]
- 39.Heller MC, Carpenter JF, Randolph TW. Manipulation of lyophilization-induced phase separation: implications for pharmaceutical proteins. Biotechnol Prog. 1997;13(5):590–596. doi: 10.1021/bp970081b. [DOI] [PubMed] [Google Scholar]
- 40.Izutsu K, Kojima S. Freeze-concentration separates proteins and polymer excipients into different amorphous phases. Pharm Res. 2000;17(10):1316–1322. doi: 10.1023/a:1026412107574. [DOI] [PubMed] [Google Scholar]
Associated Data
This section collects any data citations, data availability statements, or supplementary materials included in this article.