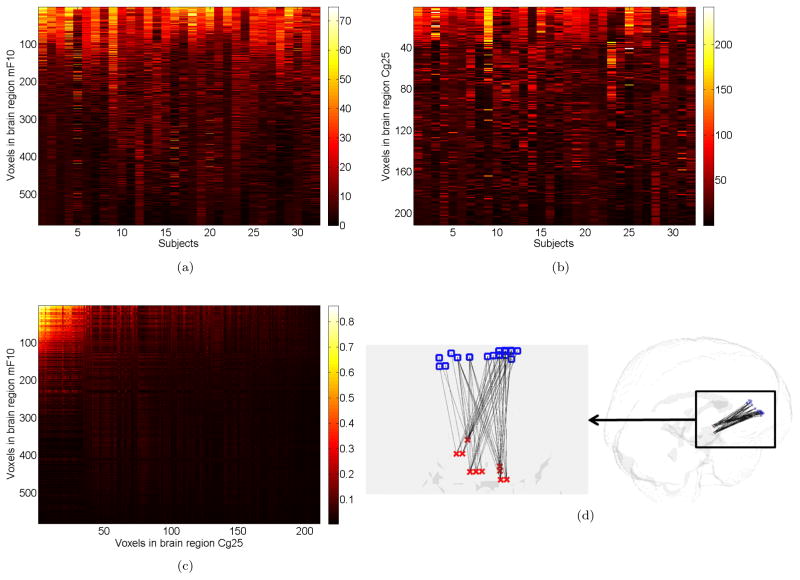
Figure 4.
Voxel pair connectivity inferences:(a) the heatmap intensity reflects the number of functionally connected voxels in Cg25 to each voxel (row) of brain region mF10 across subjects (columns). (b) shows the number of functionally connected voxels in mF10 to each voxel (row) in Cg25 across 32 Subjects. The regional voxels (rows) in (a) and (b) are ordered such that the voxel with the most connections is listed first and the voxel with the least connections is listed last. Note that some voxels in mF10 and Cg25 consistently show a large number of connections to voxels in the other region across the 32 subjects. These highly connected voxels serves as neural processing hubs since they reveal coherent activity with many other voxels. (c) is a heatmap showing voxel pairs that are highly connected between mF10 and Cg25 and the intensity is the average posterior probability that a cross-region voxel pair is connected (averaged across subjects). (d)right is a 3D plot showing voxel pairs connected with high probabilities (Pg̈(v̈) > 0.9 for across subject average) falling in regions Mf10 and Cg25. The squares and crosses represent the voxels in mF10 and Cg25 respectively. (d) left is enlarged and rotated for better visualization of links between voxels. This figure appears in color in the electronic version of this article.

