

Abstract
Spreading depolarizations (SDs) are recognized as actors in neurological disorders as diverse as migraine and traumatic brain injury (TBI). Migraine aura involves sensory percepts, suggesting that sensory cortices might be intrinsically susceptible to SDs. We used optical imaging, MRI, and field potential and potassium electrode recordings in mice and electrocorticographic recordings in humans to determine the susceptibility of different brain regions to SDs. Optical imaging experiments in mice under isoflurane anesthesia showed that both cortical spreading depression and terminal anoxic depolarization arose preferentially in the whisker barrel region of parietal sensory cortex. MRI recordings under isoflurane, ketamine/xylazine, ketamine/isoflurane, and urethane anesthesia demonstrated that the depolarizations did not propagate from a subcortical source. Potassium concentrations showed larger increases in sensory cortex, suggesting a mechanism of susceptibility. Sensory stimulation biased the timing but not the location of depolarization onset. In humans with TBI, there was a trend toward increased incidence of SDs in parietal/temporal sensory cortex compared with other regions. In conclusion, SDs are inducible preferentially in primary sensory cortex in mice and most likely in humans. This tropism can explain the predominant sensory phenomenology of migraine aura. It also demonstrates that sensory cortices are vulnerable in brain injury.
SIGNIFICANCE STATEMENT Spreading depolarizations (SDs) are involved in neurologic disorders as diverse as migraine and traumatic brain injury. In migraine, the nature of aura symptoms suggests that sensory cortex may be preferentially susceptible. In brain injury, SDs occur at a vulnerable time, during which the issue of sensory stimulation is much debated. We show, in mouse and human, that sensory cortex is more susceptible to SDs. We find that sensory stimulation biases the timing but not the location of the depolarizations. Finally, we show a relative impairment of potassium clearance in sensory cortex, providing a potential mechanism for the susceptibility. Our data help to explain the sensory nature of the migraine aura and reveal that sensory cortices are vulnerable in brain injury.
Keywords: anoxic depolarization, cortical spreading depression, migraine, sensory cortex, traumatic brain injury
Introduction
Spreading depolarizations (SDs) are slowly propagating waves of near-complete neuro-glial depolarization that are increasingly recognized as important agents of neurological disease (Pietrobon and Moskowitz, 2014; Dreier and Reiffurth, 2015). They include cortical spreading depression (CSD), which is thought to be responsible for the migraine aura. SDs also occur in stroke, subarachnoid hemorrhage, and traumatic brain injury (TBI) along a continuum of pathology with the related phenomena of anoxic depolarization (AD) (Charles and Brennan, 2009; Pietrobon and Moskowitz, 2014). Suppression of SDs is a likely mechanism of migraine-preventive drugs and is advanced as a way to prevent the damage that these depolarizations exert in brain injury patients (Ayata et al., 2006; Hertle et al., 2012). However, many basic characteristics of SDs, including their relative susceptibility in different regions of the brain, remain unclear. Defining the susceptibility of different brain regions to SDs could help in our understanding of the clinical phenomenology of the migraine aura and could identify regions at risk of compromise during brain injury.
The fact that migraine aura occurs in awake patients has allowed the opportunity to study the psychophysical characteristics of SDs (Lashley, 1941; Schott, 2007). The majority of aura symptoms are sensory, with visual symptoms the most common, followed by somatosensory symptoms (e.g., numbness, tingling; Russell and Olesen, 1996; Kelman, 2004). The reasons for this phenomenology are unknown, but they suggest that primary sensory cortices are more susceptible to SDs.
The discovery of SDs in brain injury patients (Mayevsky et al., 1996; Strong et al., 2002) has elevated these waves from a curiosity to a medical urgency. The fact that SDs are associated with worsened outcome in brain injury (Hartings et al., 2011a) makes their suppression a high priority. An understanding of where and why they occur can help us to stratify risk and potentially enable treatment decisions.
The intrinsic susceptibility to SDs is thus compelling for the understanding and treatment of a broad spectrum of neurologic disorders. We used a combination of in vivo physiological approaches in rodent and human to examine the susceptibility of different brain regions to SDs. We found that SDs showed a consistent tropism for sensory cortex, supporting the idea that sensory cortices are the likely origin of CSD in migraine and suggesting that, in other disorders involving SDs, sensory cortices are a vulnerable territory.
Materials and Methods
Methodological considerations
The ultimate triggers of SDs in vivo are obscure. For stroke and subarachnoid hemorrhage, it is hypothesized that ischemia-mediated breakdown of ionic homeostasis is responsible for SD ignition. For TBI, cellular lysis, as well as ischemic mechanisms, is proposed (Dreier, 2011; Dreier and Reiffurth, 2015). For migraine, the potential mechanisms are much more elusive because most stimuli that cause SDs in model systems are injurious and there is no overt injury associated with the migraine attack (Charles and Brennan, 2009; Pietrobon and Moskowitz, 2013, 2014). Whatever the ultimate mechanism, modeling of SD initiation should be maximally realistic for each clinical scenario. In addition, if relative susceptibility is to be determined, then the induction technique must not bias the outcome. We chose KCl-induced CSD and anoxia-induced AD because they met both of these criteria. K+ thresholds allowed for the generation of CSD with the minimum necessary stimulus and, in so doing, allowed the isolation of the most susceptible region. On the other end of the injury continuum, global anoxia both delivers a uniform stimulus to the whole brain and simulates the energetic failure encountered in stroke, subarachnoid hemorrhage, and brain trauma. Although it was appealing to model these conditions more directly, for example, with occlusion- or photothrombosis-induced stroke (López-Valdés et al., 2014), cisternal blood (Cetas et al., 2009), or induced trauma (Xiong et al., 2013), none of these models allowed assessment of relative susceptibility.
Animals, anesthesia, and maintenance
Adult male C57BL/6J mice (10–15 weeks old) were used in craniotomy (n = 30) and intact skull preparations (n = 26). All experiments were conducted in accordance with the National Institutes of Health's Guide for the Care and Use of Laboratory Animals and were approved by the Institutional Animal Care and Use Committee at the University of Utah.
For most experiments (40/48), anesthesia was induced with 2% isoflurane in a 1:1 nitrogen:oxygen mixture. Surgery was performed at 1.2–1.5% isoflurane (suppression of corneal and hindpaw withdrawal reflexes). Anesthesia was reduced to 0.6–0.9% (positive corneal and hindpaw reflexes) for experimental recordings and was adjusted continuously so that the respiratory rate was within 100–120 breaths/min. Reflex responses, respiratory rate, heart rate, and pulse oxygenation were monitored continuously and maintained in a normal range (heart rate 400–700, pulse oxygenation 95–100%). In experiments designed to control for anesthesia-induced effects, ketamine/xylazine (100/10 mg/kg; n = 3), ketamine/isoflurane (100 mg/kg/0.75%; n = 1), and urethane (0.75 mg/kg; n = 4) anesthesia were used in the intact skull preparation. Body temperature was maintained at 37°C during each experiment using a circulating water bath and heating blanket. To induce AD, isoflurane was increased to 5% and oxygen was replaced with nitrogen.
Craniotomy preparation
The animal was fixed in a stereotaxic frame with an anesthetic nose cone (Models 962, 923B; David Kopf Instruments). Craniotomy was performed with a diamond-burr-tipped dental drill. Craniotomies were first defined by the sutures of the parietal bone, exposing frontal, motor, somatosensory, visual, and retrosplenial cortex (n = 22) and then shifted 2 mm laterally, exposing the barrel cortex, S2, auditory cortex, and primary and lateral secondary visual cortex (n = 5; Fig. 1A). A dental cement well with an inlet at bregma and an outlet at the caudal end was built for superfusion. The cranial window was covered with a glass coverslip and sealed with the dental cement.
Figure 1.

Craniotomy preparations. A, Preparation of superfused cranial window. B, Standard (medial) and lateral craniotomies. C, Dye mixing in well. Plots (highly overlapping) show the introduction and mixing of a contrast agent into a cranial well. Vertical lines show the time to 95% of the fully mixed state (<30 s for regions of interest above hindlimb, whisker, and visual cortex). Inset shows a time-to-95% image. The entire well is fully mixed in <60 s. Scale bar, 1 mm. Side plot shows that all three ROI are 95% fully mixed within 5 s of each other. D, Potassium mixing in well. With a K+-sensitive electrode positioned inside the well but outside of the cortex, it took 60.1 s for the well to be 95% mixed after switching from 12 to 120 mm KCl. E, In vivo diffusion of fluorescein sodium salt into the cortex as measured by two-photon microscopy (top) and simulated diffusion of potassium into the cortex (bottom). In vivo percentages are of the maximum pixel intensity taken from the surface of the cortex. Simulated percentages are of a 12 mm surface [K+] concentration. F, Onset of CSD relative to change [K+] (steps in plot). Open circles are CSD from the lateral craniotomy preparation; closed circles are from medial crantiotomies. Vertical lines are positioned 60 s after each concentration change to indicate the fully mixed state. G, Origin and propagation of CSD and AD from the same animal. Contours are at 1, 5, and 20 s after onset. CCD, Charge-coupled device; M, motor cortex; HL, hindlimb cortex; B, bregma; BF, barrel field; S2, secondary somatosensory cortex; V, visual cortex.
CSD thresholding
A cortex buffer consisting of warmed physiologic saline was used for superfusion during baseline; [K+] was increased by substituting the respective molarity of NaCl with KCl. Saline was used rather than artificial CSF (ACSF) to isolate the effects of [K+] on CSD induction (both Ca2+ and Mg2+ can affect CSD threshold; Mody et al., 1987). However, in pilot experiments, the effects of cortex buffer and ACSF containing the following (in mm): 125 NaCl, 3 KCl, 1.25 NaH2PO4, 2 CaCl2, 1 MgCl2, 25 NaHCO3, and 11 glucose were compared and no difference in SD location, threshold, or propagation was seen (n = 5; data not shown). The cortical bath was kept at room temperature for surgery to reduce swelling and then heated to 30–34°C during experimental recordings. The preparation was allowed to recover for 60 min after completion of surgery.
Preselected steps of [K+] elevation were 8, 10, 12, 14, 16, 18, 20, 25, 30, 40, 50, 60, and 120 mm; however, the threshold never exceeded 50 mm. Of the 27 thresholding experiments, 15 had onset of SDs at 12 mm, 6 were at 15 mm, 1 was at 16 mm, 2 were at 18 mm, 2 were at 40 mm, and 1 was at 50 mm (see also Fig. 1F). The duration of exposure of the cortex to K+ at each concentration was 12 min. Superfusion was driven by gravity, flow rate was 1–2 ml/min, tubing volume was 1 ml, and bath volume was ∼16 mm3. With these parameters, it took 10–20 s to replace one bath volume. Superfusion parameters and mixing times were verified with dye (crystal violet, 0.1%, n = 2) and K+ electrode recordings (n = 3). For both dye and K+ recordings, 95% equilibration time never exceeded 1 min. In contrast, 24/27 CSD inductions occurred at or after 1 min of elevated K+ perfusion (Fig. 1F). Moreover, for visualized dye recordings, no bias toward perfusion of barrel cortex was observed compared with other regions. Therefore, we concluded that the necessary mixing involved in our thresholding paradigm did not bias the location or timing of CSD onset.
The likely depth of penetration of K+ solution into cortex was also characterized. Two-photon microscopy (Sutter Movable Objective Microscope with two Hamamatsu R6357 photomultiplier tubes; Zeiss 20×/1.0 numerical aperture water-immersion objective; Spectra Physics MaiTai Titanium:Sapphire laser, pulse width ≈100 fs, excitation 900 nm, emission 535/50 nm green, 617/75 nm red; field of view 300*300 μm; image acquisition 2–4 Hz.) was used to image volumes of cortex from the cortical surface to ∼240 μm depth during superfusion (z-stacks of 15 planes at 16 μm increments, from 0 to 240 μm, collected every 7.9 s). In pilot experiments (J. Mendez, University of Utah, unpublished data), it was found that commercially available K+ fluorophores could not be used for this purpose, so this study used an indirect approach.
The craniotomy was incubated with sulforhodamine 101 (SR101; 200 μm) for 3–5 min and then washed. This labeled astrocytes uniformly throughout the cortical thickness (Nimmerjahn et al., 2004), which allowed correction for fluorescence decay by depth (Helmchen and Denk, 2005). Fluorescein sodium salt (750 μm) was then superfused with identical perfusion flow rate and timing to the thresholding experiments. Fluorescence intensity in each image plane in the z-stack was corrected for depth (Tang et al., 2014), averaged over each plane, and stacks were then concatenated, producing an image of fluorescence intensity over depth and time (Fig. 1E, top). Because the molecular weight of fluorescein is significantly different from that of K+, fluorescein measurements could not be used directly to estimate subcortical K+ transport. Instead, the experimentally derived fluorescein diffusion parameters, combined with fluorescein's known diffusivity in water (Periasamy and Verkman, 1998), were used to estimate an effective tortuosity by fitting optically measured temporal concentration profiles with theoretical predictions. This effective tortuosity, and known values of K+ diffusivity and tortuosity (Tang et al., 2014), were then used to model K+ transport. To predict temporal diffusion profiles, the transient 1D mass diffusion equation was solved (Bergman et al., 2011). The initial condition was set as C (x, t = 0) = C0. The value of C0 was assumed to be 3.5 mm for K+. The boundary condition at the cortical surface was set as C (x = 0, t) = Cs, where Cs is the concentration at the cortical surface: 12 mm for K+.
We found that, relative to mixing, simulated intracortical K+ diffusion was slow, approaching equilibration only toward the end of the 11 min time frame allotted for each K+ step (Fig. 1). In contrast to mixing timing (see above), timing of CSD onset coincided more closely with the kinetics of simulated subcortical K+ accumulation. Moreover, simulated K+ accumulation was relatively superficial. To the 12 mm surface concentration that most frequently induced CSD, the 90% concentration line (10.8 mm; a likely minimum necessary concentration to induce CSD (Matsuura and Bures, 1971; Heinemann and Lux, 1977; Tang et al., 2014) was located only 50 μm below the cortical surface. This is consistent with data showing preferential propagation of CSD in superficial cortical layers (Basarsky et al., 1998).
Optical imaging
Reflectance optical intrinsic signal imaging allowed recording of sensory maps and the hemodynamic correlates of CSD. A 12-bit CCD camera (MiCAM02; SciMedia) captured cortical reflectance from white light emitting diodes (Luxeon 5500K; Phillips) at 1 Hz for 660 frames (11 min; Fig. 1).
ImageJ (Rasband, 1997) was used for initial image processing, including contrast enhancement and delineation of CSD and AD origin. CSD and AD origins were identified as a region of local alteration in light reflectance (both >2% change from baseline), which propagated outward concentrically (Fig. 1). Centroid of CSD or AD origin was determined and distance relative to bregma was computed. A 3D-rendered surface of murine brain with outlines of the cortical areas was created using SPM8 software (http://www.fil.ion.ucl.ac.uk/spm/software/spm8/) implemented in MATLAB (The MathWorks). The 3D 1T MRI scan of the mouse head in vivo was taken from the Mouse Brain Database (http://brainatlas.mbi.ufl.edu/) and manually normalized to a 3D version of the Allen Mouse Brain Reference Atlas, 2011 Segmentation (www.3dbar.org). Locations of origin of CSD and AD were plotted onto the 3D rendering with MriCron (Rorden et al., 2007). If not otherwise specified, coordinates are given in the imaging plane 20° from the vertical axis.
Electrophysiology
In selected experiments (n = 8), in addition to optical signal, field potential and potassium-sensitive electrodes were used. Borosilicate glass capillaries (WPI, outer diameter/inner diameter = 1.5/0.84 mm 100 mm length) were pulled with a vertical puller (Sutter Instruments P-30) to give a tip taper >1 cm long with a diameter of 20–40 μm at 400–500 μm from the tip. A microforge was used to achieve a tip size of ∼5 μm. K+-sensitive electrodes were front-filled for 1–2 cm with silanizing solution (Sigmacote R; Sigma-Aldrich), baked for 30 min at 200°C, and then front-filled with 120 mm KCl and 34 mm NaCl, followed by 600–1000 μm of potassium ionophore (Fluka Cocktail A; Sigma-Aldrich). The reference/local field potential electrode was bent ∼30° with a gas torch to allow closer apposition and then front-filled with 120 mm KCl and 34 mm NaCl. Both micropipettes were then back-filled with 120 mm KCl and 34 mm NaCl. A binocular microscope was used to align and glue the electrodes so that the tips were within 20–40 μm of each other. Ag/AgCl wires were inserted into both electrodes and the assembly was connected to the head stages of two Axopatch 1D amplifiers (Molecular Devices). The K+ electrode was calibrated before and after each experiment and a response of 54 mV/decade was verified or the electrode was discarded.
A notch was drilled into the coverslip covering the well around the craniotomy and the electrodes were inserted at 30° to ∼300 μm depth. A ground electrode consisting of Ag/AgCl wire inserted into a plastic tube filled with saline was inserted into the occipital musculature.
Signal from both recording electrodes was amplified 100× and digitized at 1 KHz (PCI-6221; National Instruments). Electrodes were calibrated before and after each experiment with 12 and 120 mm [K+] solutions. Experimental [K+] was computed using standard methods (Lothman et al., 1975).
Sensory stimulation protocol
In selected experiments (n = 12), visual and somatosensory stimulation were applied during baseline and CSD induction to determine whether sensory stimulation biased CSD threshold, location, or timing. For visual stimulation, an LED light source (peak emission 466 nm; 0.3–0.6mW) was positioned 1 cm in front of the contralateral eye and 100 ms pulses were delivered at 2 Hz for 30 s. For whisker stimulation, stainless steel stimulating electrodes (A-M Systems) were placed subcutaneously anterior to the C1 and E1 whiskers of the contralateral whisker pad and 2 ms bipolar pulses of 1 mA were delivered at 5 Hz for 30 s via a stimulus isolator (A365; WPI). Visual and whisker stimulation blocks were alternated each minute, controlled by a Master8 stimulator (A.M.P.I.; see Fig. 4).
Figure 4.
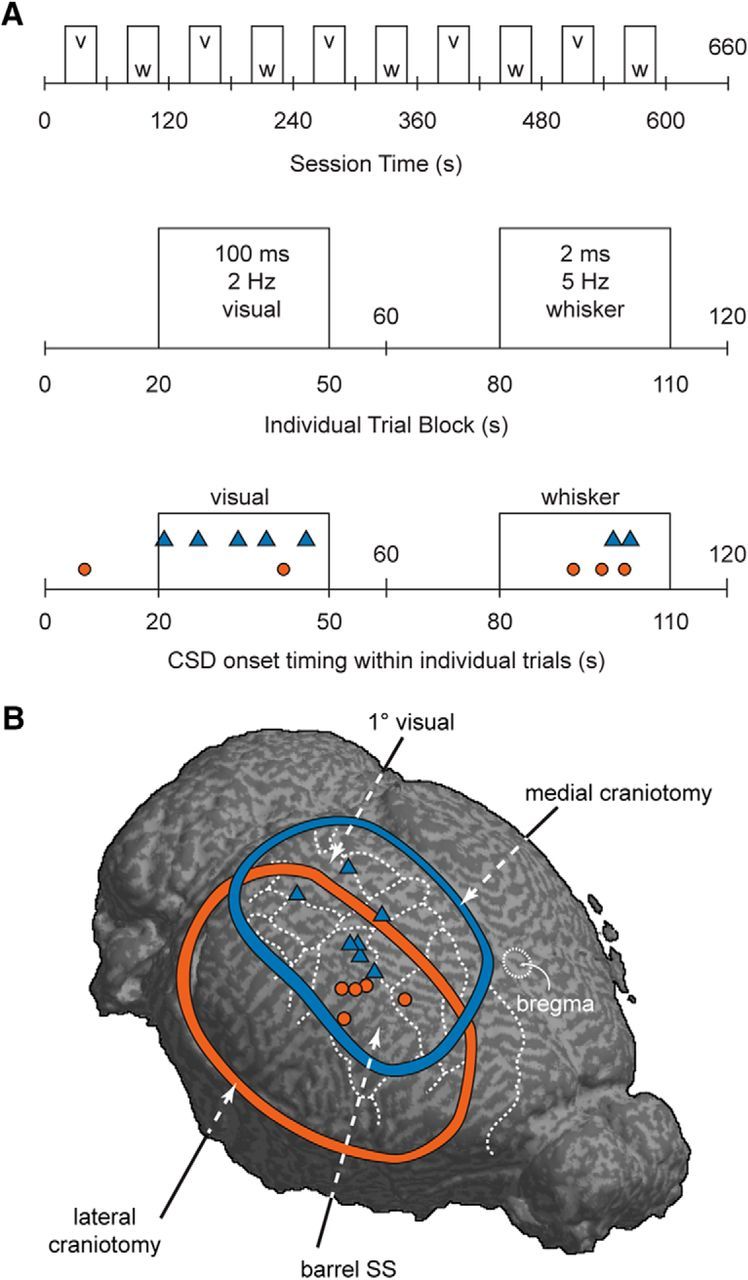
CSD was more likely to be initiated during sensory stimulation regardless of sensory modality stimulated. A, Schematic of sensory stimulation paradigm. Bottom shows incidence of CSD induction (medial craniotomy: blue triangles; lateral craniotomy: red circles). Eleven of 12 CSD inductions occurred during sensory stimulation. B, Map of CSD onset locations in sensory stimulation experiments. Blue and red boundaries and icons denote medial and lateral craniotomy experiments, respectively.
Intact skull preparation
Optical imaging.
Mice (n = 8) were held in place with a combination of a supportive platform and the bite-bar/anesthetic nose cone apparatus used in the stereotaxic frame (923-B; David Kopf Instruments) Neither ear bars nor zygoma bars were used to avoid the possibility of exerting pressure on the skull or underlying brain. The scalp was carefully dissected, 1% lidocaine was applied to all incisions, and silicone oil was used to keep the skull translucent. No other surgical interventions were made. After establishment of stable baseline anesthesia and imaging characteristics, AD was induced as above.
MRI.
An additional group of animals (n = 13) was used for intact skull preparation MRI experiments. Animals were gently restrained in a custom MRI frame. Anesthetic parameters were identical to above. No ear bars or zygoma bars were used and no surgical interventions were made. Mice were monitored using an MR-compatible physiological monitoring system (SA Instruments).
Imaging experiments were performed on a 7T Biospec MRI scanner (Bruker) interfaced with a 12 cm actively shielded gradient insert capable of producing a magnetic field gradient up to 600 mT/m. Mice were placed in a 72 mm volume coil for signal transmission and a quadrature surface coil was placed on the head for signal reception. After T2 anatomical scans, diffusion-weighted imaging scans were acquired using a single-shot echoplanar-imaging pulse sequence (TR 2000 ms, TE 31 ms, 8 coronal 1-mm-thick slices covering cerebrum from olfactory bulb to cerebellum; field of view 2 × 2 cm; in-plane resolution 156 × 156 μm). Diffusion encoding was applied in the slice direction (perpendicular to the coronal section) with diffusion sensitivities (b-values) of 200, 500, 700, and 1000 s/mm2 in addition to the reference (b = 0) image. The entire acquisition was repeated 120 times with a temporal resolution of 10 s per full brain volume. After AD scanning, the T2 anatomical scan was repeated. Postprocessing was performed in MATLAB. Linear least-square fitting of the diffusion-induced signal attenuation was performed to estimate the apparent diffusion coefficient (ADC) on a pixel-by-pixel basis. ADC maps were uniformly thresholded at ¼ of the ADC range to identify foci of AD and generate propagation contours; thresholded maps were registered to pre- and post-AD anatomical scans and compared with the Allen Mouse Reference Atlas (http://mouse.brain-map.org/static/atlas) for localization.
Clinical study
Patients (n = 136) with acute TBI were enrolled prospectively at five academic neurosurgical centers (University of Cincinnati, Virginia Commonwealth University, University of Pittsburgh, King's College London, and University of Miami). Research was approved by the institutional review boards and was conducted in accordance with the Declaration of Helsinki. Written informed consent was obtained from legally authorized representatives before the start of study procedures. Inclusion criteria were the clinical decision for neurosurgical treatment (lesion evacuation and/or decompression), surgery <7 d after trauma, and age ≥18 years. Patients with fixed, dilated pupils were excluded.
Methods for electrocorticographic (ECoG) monitoring of SDs have been described previously in detail (Hartings et al., 2011b, 2014). Briefly, recordings were obtained from a six-contact subdural electrode strip (10 mm spacing between contacts; Wyler, Ad-Tech Medical) placed at the end of neurosurgical procedures. As much as possible, the strip was placed along a single gyrus and targeted to viable cortex near the injury focus given the constraints of the craniotomy location and considerations for exteriorization of the electrode lead. The location of strip was reported by the neurosurgeon postoperatively as inferior frontal, middle frontal, superior frontal, precentral, postcentral, inferior parietal, superior temporal, middle temporal, inferior temporal, or occipital. Continuous ECoG was then performed after transfer to the intensive care unit for a maximum of 7 d, after which the electrode strip was removed at the bedside. Recordings were scored for SD activity offline.
Statistical analysis
Descriptive and inferential statistical analysis was performed in MATLAB and Statistica 6.0 (Dell Statsoft). Unless otherwise noted, populations are summarized as mean ± SEM.
Results
SDs begin predominantly in sensory cortex
We used a wide craniotomy to expose a broad region of mouse cortex to small steps of increasing [K+] to achieve the minimum necessary conditions for CSD induction (Petzold et al., 2008; Tang et al., 2014) and to determine (with intrinsic signal imaging) the location of maximum susceptibility (Fig. 1). The majority of thresholded CSDs (11/15) began in whisker barrel cortex, a primary sensory cortex in mouse (Fig. 2, Table 1) The other locations were the medial border of neck/trunk area (n = 3) and retrosplenial cortex (n = 1). ADs induced subsequently in the same animals also started from barrel cortex: 14/15 ADs began in barrel cortex (the remaining AD was on the caudolateral border of forelimb area).
Figure 2.

Preferential induction of CSD and AD in parietal cortex of mouse. Barrel cortex has increased susceptibility to CSD and AD under either craniotomy or intact skull preparations. A, CSD and AD in medial craniotomy. B, CSD and AD in lateral craniotomy. C, AD in intact skull preparation. CSD and AD foci are consistently located in parietal sensory (predominantly barrel) cortex.
Table 1.
Anatomical coordinates of CSD and AD
| Distance to bregma (mm) |
||
|---|---|---|
| Lateral | Posterior | |
| Medial craniotomy CSD (n = 22) (20°) | 2.9 ± 0.2*** | 2.1 ± 0.1*** |
| Medial craniotomy AD (n = 22) (20°) | 3.7 ± 0.1*** | 1.1 ± 0.1*** |
| Lateral craniotomy CSD (n = 5) (45°) | 3.2 ± 0.2 | 1.2 ± 0.2 |
| Lateral craniotomy AD (n = 5) (45°) | 3.5 ± 0.3 | 0.7 ± 0.2 |
| Medial craniotomy primary AD (n = 7) (20°) | 3.4 ± 0.1 | 1.2 ± 0.1* |
| Intact skull primary AD (n = 8) (0°) | 3.3 ± 0.1 | 0.6 ± 0.2* |
| Medial craniotomy secondary AD (n = 7) (20°) | 0.6 ± 0.1 | 1.8 ± 0.1 |
| Intact skull secondary AD (n = 8) (0°) | 0.7 ± 0.1 | 1.8 ± 0.1 |
| Medial craniotomy CSD unstimulated (n = 15) (20°) | 2.9 ± 0.2 | 2.0 ± 0.1 |
| Medial craniotomy CSD stimulated (n = 7) (20°) | 2.9 ± 0.2 | 2.5 ± 0.2 |
Rotation of the imaging plane is indicated in parentheses after the number of subjects. Values are mean ± SEM. Comparisons are made between onset locations: pairs compared are in italicized or boldface rows.
***p < 0.001, paired t test;
*p < 0.05, independent-samples t test.
To verify that our craniotomy preparation was not biasing the location of CSD induction, we performed a significantly more lateral craniotomy in which barrel cortex was distant from the craniotomy margins. Despite the different conditions, CSDs still started predominantly in barrel cortex (4/5 inductions from within barrel cortex boundaries and 1 on the border of barrel/forelimb cortex). Four of 5 AD origins were in barrel cortex (the fifth was just inside forelimb cortex; Fig. 2).
To control completely for potentially biasing effects of craniotomy surgery, we performed AD experiments in an intact skull preparation (under these conditions, CSD induction was not possible). Six of 8 ADs began from barrel cortex; the other two were in close proximity (on the border between the barrel and the forepaw somatosensory cortex; Fig. 2).
Finally, we used ADC MRI (de Crespigny et al., 1998; Eikermann-Haerter et al., 2011) to take a whole-brain approach to the origins of ADs (Fig. 3). Three separate regions, barrel cortex, ventral thalamus/hypothalamus, and midbrain, showed foci of ADC decrease that began simultaneously (at least within the temporal resolution of our scans) but separately. Given the clear spatial separation of these foci, there was no plausible subcortical source of the AD-associated changes that we observed in barrel cortex.
Figure 3.

AD in mouse begins separately in barrel cortex, thalamus/hypothalamus, and midbrain. Panels show ADC maps (units mm2/s) before and during anoxia. A, ADC time sequence from a section through midbrain −3 mm from anterior commissure (AC, precision ±500 μm due to MRI slice thickness), showing large AD focus. B, Time sequence of ADC maps from a section −1100 μm from anterior commissure. Discrete foci of ADC decrease are seen at 100 s after anoxia in barrel cortex and ventral thalamus/hypothalamus (white arrows); cortical changes are clearly seen to spread. C, Contours of B overlaid on an anatomical scan. For clarity, noncontiguous contours of <25 px2 (1.6 mm2) were not drawn). Lower images show a linear region of interest along cortex and the resulting trace of that line over time (kymograph). AD onset occurs at both barrel fields (horizontal dotted line) and AD propagates along the surface of the cortex. Speed of spread can be determined by the slope of darkening on the kymograph. D, AD susceptibility is not artifactual to anesthetic. Sections through barrel cortex from animals with isoflurane (n = 5, 2 shown in D, 1 shown in A), ketamine/isoflurane (n = 1, data not shown), ketamine/xylazine (n = 3; 2 shown), and urethane (n = 4; 2 shown) anesthesia all show identical AD patterns. Open arrows denote anoxia; closed arrows denote AD onset.
It is possible that our use of isoflurane anesthesia (n = 5) biased our results, for example, via differential susceptibility to this drug in different cortical regions. To control for this possibility, we used three distinct anesthesia protocols in the MRI preparation in addition to isoflurane: ketamine/xylazine (n = 3), ketamine/isoflurane (n = 1; to control for possible xylazine effect), and urethane (n = 4). We saw no difference in the pattern or spread of AD foci (Fig. 3). We concluded that our results were not artifactual to the anesthesia used.
Sensory stimulation affects timing but not location of SDs
To determine whether SD susceptibility could be affected by sensory stimulation, we alternated visual and somatosensory (whisker) stimulation during CSD thresholding (12 animals; 7 with medial craniotomy; 5 with lateral craniotomy). Neither threshold nor location of CSD origins was affected by sensory stimulation (Table 1). The majority of CSDs in both the medial (4/7) and lateral (4/5) preparations began in barrel cortex regardless of the sensory modality stimulated; other locations for induction were as follows: visual (2/7), posterior parietal association (1/7), and forelimb somatosensory (1/5) cortical areas (Fig. 4). However, sensory stimulation significantly affected the timing of CSD induction: the majority of CSDs (11/12) began during blocks of sensory stimulation (p < 0.03, Monte Carlo simulation, 100,000 iterations, assuming equal probability of CSD occurring in visual stimulation, whisker stimulation, or rest blocks). Interestingly, there was no consistent relation between the modality of the stimulation (visual or somatosensory) and the origin of CSD; CSD was more likely in barrel cortex whether whisker or visual stimulation was presented (Fig. 4).
Altered extracellular potassium dynamics near SD focus
We recorded extracellular potassium ([K+]e) with the rationale that it might provide mechanistic insight into why different cortices had different susceptibility to CSD (six animals without, two with sensory stimulation). Due to space constraints particular to each experiment, the location of the electrode in the cortex varied substantially relative to barrel cortex where CSD usually began. This distribution of locations allowed us to compare [K+]e characteristics in areas close to and farther from the site of CSD induction.
Pre-CSD increases in [K+]e induced by K+ superfusion were significantly larger for electrodes closer to CSD onset location (Pearson's r: −0.71, [K+]e amplitude by distance, n = 8, p < 0.05; separately confirmed with Monte Carlo simulation; Fig. 5). This was likely due to a higher [K+]e level just before CSD onset (Pearson's r: −0.79, pre-CSD [K+]e by distance, n = 8, p < 0.05) because there was no significant difference in baseline [K+]e (Pearson's r = 0.21, baseline [K+]e by distance, n = 8, p = 0.62). [K+]e rise time during the CSD wave was also significantly shorter closer to the mean onset location (Pearson's r = 0.85, rise time by distance, n = 7, p < 0.05). We interpreted these data as being consistent with a relative failure of potassium reuptake in barrel cortex due either to greater release or relatively deficient reuptake.
Figure 5.

Extracellular potassium increase is larger in mouse parietal cortex. A, [K+]e and direct current (DC) field potential over the course of an experiment, showing increasing levels of K+ perfusion resulting in cortical [K+]e increases until CSD threshold is reached; K+ superfusion is then normalized for recovery and the change from oxygen/nitrogen mixture to 100% nitrogen induces AD. B, Pre-CSD elevations in [K+]e. C, Correlation between [K+]e electrode distance from mean CSD onset site and pre-CSD [K+]e increase (r = −0.71, p < 0.05). D, Monte Carlo simulation by random permutations (10,000 iterations) of the values of pre-CSD increase of [K+]e confirms correlation between greater [K+]e rise and location closer to mean CSD onset location.
Higher incidence of SDs in human sensory cortex
To investigate whether different regions of human cerebral cortex have greater susceptibility to SDs, we analyzed data from a multicenter clinical study of TBI. In 136 patients, the occurrence of SDs was monitored by ECoG in the intensive care unit after neurosurgical treatment.
Placement of electrode strips near the site of primary injury under constraints of the craniotomy location resulted in recordings from diverse regions of cortex. The incidence of SDs, scored as present or absent regardless of the number of events, varied by the location of the electrode strip as follows in decending order (Fig. 6): occipital (1/1, 100%), parietal (8/11, 72.7%), superior temporal (15/22, 68.2%), precentral (6/10, 60.0%), middle frontal (19/32, 59.4%), inferior frontal (29/49, 59.2%), superior frontal (3/6, 50%), and middle temporal (1/5, 20%). Regions with the highest incidence were all primary sensory areas. Grouping patients with recordings from these regions together, we found with 84% probability that SD is more likely to be present in sensory cortex (24/34 or 70.5% incidence) than in other areas (58/102, or 56.9% incidence; χ2, p = 0.16). Although the null hypothesis of equal SD incidence between sensory and nonsensory cortex cannot be rejected, the statistical test is underpowered at only 28% for this effect size, making it 72% likely that the result is a false negative (type II error).
Figure 6.

Higher incidence of SDs in human sensory cortex. Schematic diagram of the human brain shows the principal regions in which single electrode strips, as shown on the postcentral gyrus, were placed for CSD monitoring after surgical treatment of TBI (n = 136 patients). A higher percentage of patients exhibited CSDs when recordings were made from the parietal lobe or superior temporal sulcus. A relatively uniform likelihood of CSDs was observed throughout the frontal lobe. Only one patient was monitored occipitally, so SD incidence (100%) is not shown for this region. Traumatic contusions requiring surgery typically occur at the anterior and inferior aspects of the frontal and temporal lobes, where the brain is compressed against the anterior and middle fossae. Subarachnoid hemorrhage and subdural hematomas most commonly occur over the cerebral convexity.
To test whether sensory cortex was more severely injured and thus biased our results, we computed the probability of poor outcome for each patient based on seven variables at hospital admission using a validated outcome prediction model (Hartings et al., 2011b). The groups did not differ significantly in this summary measure [median (interquartile range): sensory cortex: 0.55 (0.32–0.71) vs nonsensory: 0.54 (0.37–0.74); Mann–Whitney U test, p = 0.41] or in individual components such as Glasgow Coma Scale motor score at hospital admission [sensory: 5.0 (3.8–6.0) vs nonsensory: 5.0 (2.8–6.0); Mann–Whitney U test, p = 0.67] or age [sensory: 42 (28–59 years) vs nonsensory: 48 (30–64); Mann–Whitney U test, p = 0.27]. Moreover, computed tomography scans before surgery and monitoring were similar for the groups, as measured by midline shift [sensory: 7.0 mm (4.5–11.5) vs nonsensory: 7.3 mm (4.0–10.3); Mann–Whitney U test, p = 0.76] and Rotterdam CT score [both groups: 4 (4–5); Mann–Whitney U test, p = 0.41]. We concluded that the predilection of SD for sensory cortex in humans was not a result of experimental bias.
Discussion
Our principal finding is that SDs begin preferentially in primary sensory cortex in rodents and most likely in humans. This susceptibility can explain the predominantly sensory nature of the migraine aura and highlights the potential vulnerability of sensory cortex to injury-associated depolarizations. The susceptibility may be mediated by slower clearance of extracellular potassium in these densely populated and metabolically active regions.
Sensory cortex is preferentially susceptible to SDs
In his pioneering work, Leao (1944) found that it was difficult to elicit CSD in retrosplenial cortex. In the case of ischemic and anoxic depolarizations, both global anoxia (Farkas et al., 2010) and forebrain ischemia (Bere et al., 2014) experiments have suggested a possible origin in the frontolateral parietal cortex or anterior striatum; however, the experiments were not designed to determine the location and the origin was outside of the imaging field of view. Overall, there have been no attempts to determine systematically the susceptibility of different cortices to SD.
We used a variety of nonoverlapping techniques to address this problem. We began with wide-field craniotomy preparations in mouse that allowed us to expose the cortex to the minimum conditions expected to generate CSD (Petzold et al., 2008; Tang et al., 2014) and thus maximize our chances of detecting differences in susceptibility. We found that both CSD and subsequent AD began predominantly in the barrel region of parietal cortex in two different craniotomies designed to control for any surgical biasing of results.
To eliminate any possible effect of surgical preparation on SD susceptibility, we took two more approaches. First, we used intact skull optical imaging to test AD susceptibility. This preparation had the advantage of exposing the whole hemisphere, including the olfactory bulb, which was not imaged before. Once again, the first focus of AD was in barrel cortex. Next, we used MRI to examine the whole brain exposed to AD and control for the possibility that subcortical sources were the generator of our cortical findings. Here, we confirmed again the barrel cortex origin of AD. Although we found subcortical AD foci (in ventral thalamus/hypothalamus and midbrain), these foci were too distant to have served as a point of spread to barrel cortex. We also controlled for possible confounding effects of anesthesia, showing the same pattern of AD foci with GABA agonist (isoflurane), NMDA antagonist (ketamine), and mixed mechanism (urethane) anesthetics.
Finally, we examined recordings from 136 brain-injured patients with CT-delineated lesion anatomy and subdural strip electrode location. In an extremely variable clinical population, we found a robust trend toward higher incidence of SDs in the sensory cortex than in other regions. There were no differences between these groups in the most validated measures of TBI lesion severity and prognosis, suggesting that higher SD incidence is attributable to a higher innate susceptibility of sensory cortex, as demonstrated in rodent experiments.
Sensory stimulation affects CSD timing but not location
In mouse experiments, the susceptibility of barrel cortex to CSD was consistent and its location did not vary depending on peripheral sensory stimulation. However, there was a facilitating effect of sensory stimulation on the timing of CSD induction: CSD was significantly more likely during stimulation blocks of either visual or barrel somatosensory stimulation.
We suspect that global arousal mechanisms contributed to this nonspecific sensory facilitation of CSD ignition. Sensory stimuli can cause relative arousal even under anesthesia and both cholinergic and noradrenergic arousal mechanisms persistently depolarize cortical sensory neurons (Constantinople and Bruno, 2011; Polack et al., 2013). A sensory-induced, arousal-mediated membrane depolarization could bring large regions of cortex closer to SD threshold while preserving the predilection of the most susceptible region to start the process.
Local differences in [K+]e elevation and mechanism of differential SD susceptibility.
Pre-CSD increases in [K+]e tended to be larger in barrel cortex and CSD-associated rise time in [K+]e was also faster in this region. The implication is that either production or clearance of [K+]e (or both) is affected in this region. Astrocytes are primarily responsible for local clearance of [K+]e (Wang et al., 2012) and the ratio of neurons to glia is frequently invoked to explain differences in susceptibility to CSD (Fujita et al., 2016). However, simple neuron/glia ratio differences are unlikely to explain either our [K+]e findings or the susceptibility differences that we observed in parietal cortex. In both rodents and primates, visual cortex has the highest neuronal density and somatosensory cortex has the second highest (Collins et al., 2010; Herculano-Houzel et al., 2013); glial density is relatively constant, so the neuron/glia ratio is determined primarily by neuronal density (Herculano-Houzel et al., 2013). If a simple neuron/glia ratio accounted for SD susceptibility, then the area of greatest susceptibility would be visual rather than parietal cortex.
The concept of neuron/glia ratio, although useful, simplifies away structural and functional variation that might be relevant to SD susceptibility. Structurally, the most behaviorally relevant sensory cortices in all mammals tend to be the most complex (Kaas, 2012). In rodents, whisker barrel cortex is arguably the most complex: neurons and glia are densely grouped in cylindrical structures surrounded by relatively cell poor septae. Metabolic activity (Harley and Bielajew, 1992; Hevner et al., 1995), astrocyte connectivity (Houades et al., 2008), and vascular territories (Wu et al., 2016) all conform to barrel architecture. This compartmentalization might favor communication within a barrel, but under conditions of excitation or metabolic compromise, this same specialization could hinder redistribution of K+ or other mediators relevant to SD.
Similar anatomical specializations occur in primates. The most familiar are in visual cortex, where a columnar structure was classically demonstrated with both electrophysiology and cytochrome oxidase staining (Hubel and Wiesel, 1969; Horton and Hubel, 1981). However, parietal somatosensory cortex has similar features (Sur et al., 1981; Tootell et al., 1985): cell-poor septae separate more densely populated columns, suggesting structural/functional compartmentalization. The compartmentalization of both primary visual and somatosensory cortices in primates may contribute to greater SD susceptibility in both.
Finally, functional features of primary sensory cortices may also be relevant. Differences in the repertoire of excitatory and inhibitory conductances, as well as pumps and transporters (e.g., Na+/K+ ATPase; Kir4.1 in astrocytes), could contribute to the SD susceptibility phenotype that we observed.
Implications for neurologic disease
Our data shed light on a longstanding question in migraine pathophysiology. We show that the sensory predominance of migraine aura is likely due to a greater susceptibility of primary sensory cortex to CSD. One question that arises is how to reconcile the susceptibility of parietal cortex with the known visual predominance of migraine aura (Russell and Olesen, 1996; Kelman, 2004). Our use of a lissencephalic (mouse) SD model and only one visual cortex recording in our human subjects limits our ability to be definitive. However, we suspect that our results are actually consistent with the visual predominance of migraine aura. Unlike primates, rodents do not have column-like anatomical specializations in visual cortex (Kaas, 2012). If SD susceptibility indeed is associated with cortical complexity rather than pure neuronal density (highest in visual cortex in both rodent and primate (Collins et al., 2010; Herculano-Houzel et al., 2013), then one would not expect primary SD foci in rodent visual cortex. Conversely, given the ethological relevance, neuronal density, and structural complexity of both visual and somatosensory cortex in the primate, one would expect these regions to be the primary sites of SD ignition in human. Definitive resolution of this issue will have to await susceptibility recordings in humans or other primates.
Our data also have clear and direct implications for the care of patients with SDs due to stroke, subarachnoid hemorrhage, or TBI. The strong agreement between our animal and human data clearly identifies primary sensory cortices, especially the parietal cortex, as regions at risk for SDs. Our finding that sensory input increased the likelihood of SD in this region agrees nicely with recent work identifying sensory-induced SD in animals and humans with stroke (von Bornstädt et al., 2015). Together, these converging datasets argue for reduced stimulation environments in SD-vulnerable patients.
Footnotes
This work was supported by the International Headache Society (Research Fellowship to V.B.B.), the National Institutes of Health (Grant NS 085413), US Army Congressionally Directed Medical Research Programs (CDMRP) Peer Reviewed Medical Research Program (Grants PR100060 and PR130373 to K.C.B. and Psychological Health/Traumatic Brain Injury Research Program Grant to J.A.H.). We thank David O. Okonkwo, Clemens Pahl, M. Ross Bullock, Bruce Mathern, and Norberto Andaluz (Co-Operative Study on Brain Injury Depolarizations) for contributing clinical data, and we thank the members of the Headache Physiology Laboratory for helpful discussions on experimental design, analysis, and review of the manuscript.
The authors declare no competing financial interests.
References
- Ayata C, Jin H, Kudo C, Dalkara T, Moskowitz MA. Suppression of cortical spreading depression in migraine prophylaxis. Ann Neurol. 2006;59:652–661. doi: 10.1002/ana.20778. [DOI] [PubMed] [Google Scholar]
- Basarsky TA, Duffy SN, Andrew RD, MacVicar BA. Imaging spreading depression and associated intracellular calcium waves in brain slices. J Neurosci. 1998;18:7189–7199. doi: 10.1523/JNEUROSCI.18-18-07189.1998. [DOI] [PMC free article] [PubMed] [Google Scholar]
- Bere Z, Obrenovitch TP, Bari F, Farkas E. Ischemia-induced depolarizations and associated hemodynamic responses in incomplete global forebrain ischemia in rats. Neuroscience. 2014;260:217–226. doi: 10.1016/j.neuroscience.2013.12.032. [DOI] [PubMed] [Google Scholar]
- Bergman TL, Lavine AS, Incropera FP. Fundamentals of heat and mass transfer. Ed 7. New York: Wiley; 2011. [Google Scholar]
- Cetas JS, Lee DR, Alkayed NJ, Wang R, Iliff JJ, Heinricher MM. Brainstem control of cerebral blood flow and application to acute vasospasm following experimental subarachnoid hemorrhage. Neuroscience. 2009;163:719–729. doi: 10.1016/j.neuroscience.2009.06.031. [DOI] [PMC free article] [PubMed] [Google Scholar]
- Charles A, Brennan K. Cortical spreading depression–new insights and persistent questions. Cephalalgia. 2009;29:1115–1124. doi: 10.1111/j.1468-2982.2009.01983.x. [DOI] [PMC free article] [PubMed] [Google Scholar]
- Collins CE, Airey DC, Young NA, Leitch DB, Kaas JH. Neuron densities vary across and within cortical areas in primates. Proc Natl Acad Sci U S A. 2010;107:15927–15932. doi: 10.1073/pnas.1010356107. [DOI] [PMC free article] [PubMed] [Google Scholar]
- Constantinople CM, Bruno RM. Effects and mechanisms of wakefulness on local cortical networks. Neuron. 2011;69:1061–1068. doi: 10.1016/j.neuron.2011.02.040. [DOI] [PMC free article] [PubMed] [Google Scholar]
- de Crespigny A, Röther J, van Bruggen N, Beaulieu C, Moseley ME. Magnetic resonance imaging assessment of cerebral hemodynamics during spreading depression in rats. J Cereb Blood Flow Metab. 1998;18:1008–1017. doi: 10.1097/00004647-199809000-00010. [DOI] [PubMed] [Google Scholar]
- Dreier JP. The role of spreading depression, spreading depolarization and spreading ischemia in neurological disease. Nat Med. 2011;17:439–447. doi: 10.1038/nm.2333. [DOI] [PubMed] [Google Scholar]
- Dreier JP, Reiffurth C. The stroke-migraine depolarization continuum. Neuron. 2015;86:902–922. doi: 10.1016/j.neuron.2015.04.004. [DOI] [PubMed] [Google Scholar]
- Eikermann-Haerter K, Yuzawa I, Qin T, Wang Y, Baek K, Kim YR, Hoffmann U, Dilekoz E, Waeber C, Ferrari MD, van den Maagdenberg AM, Moskowitz MA, Ayata C. Enhanced subcortical spreading depression in familial hemiplegic migraine type 1 mutant mice. J Neurosci. 2011;31:5755–5763. doi: 10.1523/JNEUROSCI.5346-10.2011. [DOI] [PMC free article] [PubMed] [Google Scholar]
- Farkas E, Bari F, Obrenovitch TP. Multi-modal imaging of anoxic depolarization and hemodynamic changes induced by cardiac arrest in the rat cerebral cortex. Neuroimage. 2010;51:734–742. doi: 10.1016/j.neuroimage.2010.02.055. [DOI] [PubMed] [Google Scholar]
- Fujita S, Mizoguchi N, Aoki R, Cui Y, Koshikawa N, Kobayashi M. Cytoarchitecture-dependent decrease in propagation velocity of cortical spreading depression in the rat insular cortex revealed by optical imaging. Cereb Cortex. 2016;26:1580–1589. doi: 10.1093/cercor/bhu336. [DOI] [PubMed] [Google Scholar]
- Harley CA, Bielajew CH. A comparison of glycogen phosphorylase a and cytochrome oxidase histochemical staining in rat brain. J Comp Neurol. 1992;322:377–389. doi: 10.1002/cne.903220307. [DOI] [PubMed] [Google Scholar]
- Hartings JA, Bullock MR, Okonkwo DO, Murray LS, Murray GD, Fabricius M, Maas AI, Woitzik J, Sakowitz O, Mathern B, Roozenbeek B, Lingsma H, Dreier JP, Puccio AM, Shutter LA, Pahl C, Strong AJ, Co-Operative Study on Brain Injury Depolarisations Spreading depolarisations and outcome after traumatic brain injury: a prospective observational study. Lancet Neurol. 2011a;10:1058–1064. doi: 10.1016/S1474-4422(11)70243-5. [DOI] [PubMed] [Google Scholar]
- Hartings JA, Watanabe T, Bullock MR, Okonkwo DO, Fabricius M, Woitzik J, Dreier JP, Puccio A, Shutter LA, Pahl C, Strong AJ, Co-Operative Study on Brain Injury Depolarizations Spreading depolarizations have prolonged direct current shifts and are associated with poor outcome in brain trauma. Brain. 2011b;134:1529–1540. doi: 10.1093/brain/awr048. [DOI] [PubMed] [Google Scholar]
- Hartings JA, Wilson JA, Hinzman JM, Pollandt S, Dreier JP, DiNapoli V, Ficker DM, Shutter LA, Andaluz N. Spreading depression in continuous electroencephalography of brain trauma. Ann Neurol. 2014;76:681–694. doi: 10.1002/ana.24256. [DOI] [PubMed] [Google Scholar]
- Heinemann U, Lux HD. Ceiling of stimulus induced rises in extracellular potassium concentration in the cerebral cortex of cat. Brain Res. 1977;120:231–249. doi: 10.1016/0006-8993(77)90903-9. [DOI] [PubMed] [Google Scholar]
- Helmchen F, Denk W. Deep tissue two-photon microscopy. Nat Methods. 2005;2:932–940. doi: 10.1038/nmeth818. [DOI] [PubMed] [Google Scholar]
- Herculano-Houzel S, Watson C, Paxinos G. Distribution of neurons in functional areas of the mouse cerebral cortex reveals quantitatively different cortical zones. Front Neuroanat. 2013;7:35. doi: 10.3389/fnana.2013.00035. [DOI] [PMC free article] [PubMed] [Google Scholar]
- Hertle DN, Dreier JP, Woitzik J, Hartings JA, Bullock R, Okonkwo DO, Shutter LA, Vidgeon S, Strong AJ, Kowoll C, Dohmen C, Diedler J, Veltkamp R, Bruckner T, Unterberg AW, Sakowitz OW, Cooperative Study of Brain Injury Depolarizations (COSBID) Effect of analgesics and sedatives on the occurrence of spreading depolarizations accompanying acute brain injury. Brain. 2012;135:2390–2398. doi: 10.1093/brain/aws152. [DOI] [PubMed] [Google Scholar]
- Hevner RF, Liu S, Wong-Riley MT. A metabolic map of cytochrome oxidase in the rat brain: histochemical, densitometric and biochemical studies. Neuroscience. 1995;65:313–342. doi: 10.1016/0306-4522(94)00514-6. [DOI] [PubMed] [Google Scholar]
- Horton JC, Hubel DH. Regular patchy distribution of cytochrome oxidase staining in primary visual cortex of macaque monkey. Nature. 1981;292:762–764. doi: 10.1038/292762a0. [DOI] [PubMed] [Google Scholar]
- Houades V, Koulakoff A, Ezan P, Seif I, Giaume C. Gap junction-mediated astrocytic networks in the mouse barrel cortex. J Neurosci. 2008;28:5207–5217. doi: 10.1523/JNEUROSCI.5100-07.2008. [DOI] [PMC free article] [PubMed] [Google Scholar]
- Hubel DH, Wiesel TN. Anatomical demonstration of columns in the monkey striate cortex. Nature. 1969;221:747–750. doi: 10.1038/221747a0. [DOI] [PubMed] [Google Scholar]
- Kaas JH. Evolution of columns, modules, and domains in the neocortex of primates. Proc Natl Acad Sci U S A. 2012;109:10655–10660. doi: 10.1073/pnas.1201892109. [DOI] [PMC free article] [PubMed] [Google Scholar]
- Kelman L. The aura: a tertiary care study of 952 migraine patients. Cephalalgia Int J Headache. 2004;24:728–734. doi: 10.1111/j.1468-2982.2004.00748.x. [DOI] [PubMed] [Google Scholar]
- Lashley KS. Patterns of cerebral integration indicated by the scotomas of migraine. Arch Neurol Psychiatry. 1941;46:331–339. doi: 10.1001/archneurpsyc.1941.02280200137007. [DOI] [Google Scholar]
- Leao AA. Spreading depression of activity in the cerebral cortex. J Neurophysiol. 1944;7:359–390. doi: 10.1152/jn.1947.10.6.409. [DOI] [PubMed] [Google Scholar]
- López-Valdés HE, Clarkson AN, Ao Y, Charles AC, Carmichael ST, Sofroniew MV, Brennan KC. Memantine enhances recovery from stroke. Stroke. 2014;45:2093–2100. doi: 10.1161/STROKEAHA.113.004476. [DOI] [PMC free article] [PubMed] [Google Scholar]
- Lothman E, Lamanna J, Cordingley G, Rosenthal M, Somjen G. Responses of electrical potential, potassium levels, and oxidative metabolic activity of the cerebral neocortex of cats. Brain Res. 1975;88:15–36. doi: 10.1016/0006-8993(75)90943-9. [DOI] [PubMed] [Google Scholar]
- Matsuura T, Bures J. The minimum volume of depolarized neural tissue required for triggering cortical spreading depression in rat. Exp Brain Res. 1971;12:238–249. doi: 10.1007/BF00237916. [DOI] [PubMed] [Google Scholar]
- Mayevsky A, Doron A, Manor T, Meilin S, Zarchin N, Ouaknine GE. Cortical spreading depression recorded from the human brain using a multiparametric monitoring system. Brain Res. 1996;740:268–274. doi: 10.1016/S0006-8993(96)00874-8. [DOI] [PubMed] [Google Scholar]
- Mody I, Lambert JD, Heinemann U. Low extracellular magnesium induces epileptiform activity and spreading depression in rat hippocampal slices. J Neurophysiol. 1987;57:869–888. doi: 10.1152/jn.1987.57.3.869. [DOI] [PubMed] [Google Scholar]
- Nimmerjahn A, Kirchhoff F, Kerr JN, Helmchen F. Sulforhodamine 101 as a specific marker of astroglia in the neocortex in vivo. Nat Methods. 2004;1:31–37. doi: 10.1038/nmeth706. [DOI] [PubMed] [Google Scholar]
- Periasamy N, Verkman AS. Analysis of fluorophore diffusion by continuous distributions of diffusion coefficients: application to photobleaching measurements of multicomponent and anomalous diffusion. Biophys J. 1998;75:557–567. doi: 10.1016/S0006-3495(98)77545-9. [DOI] [PMC free article] [PubMed] [Google Scholar]
- Petzold GC, Haack S, von Bohlen Und Halbach O, Priller J, Lehmann TN, Heinemann U, Dirnagl U, Dreier JP. Nitric oxide modulates spreading depolarization threshold in the human and rodent cortex. Stroke. 2008;39:1292–1299. doi: 10.1161/STROKEAHA.107.500710. [DOI] [PubMed] [Google Scholar]
- Pietrobon D, Moskowitz MA. Pathophysiology of migraine. Annu Rev Physiol. 2013;75:365–391. doi: 10.1146/annurev-physiol-030212-183717. [DOI] [PubMed] [Google Scholar]
- Pietrobon D, Moskowitz MA. Chaos and commotion in the wake of cortical spreading depression and spreading depolarizations. Nat Rev Neurosci. 2014;15:379–393. doi: 10.1038/nrn3770. [DOI] [PubMed] [Google Scholar]
- Polack PO, Friedman J, Golshani P. Cellular mechanisms of brain state-dependent gain modulation in visual cortex. Nat Neurosci. 2013;16:1331–1339. doi: 10.1038/nn.3464. [DOI] [PMC free article] [PubMed] [Google Scholar]
- Rasband WS. ImageJ. Bethesda: National Institutes of Health; 1997. Available from: http://imagej.nih.gov/ij/ [Google Scholar]
- Rorden C, Karnath HO, Bonilha L. Improving lesion-symptom mapping. J Cogn Neurosci. 2007;19:1081–1088. doi: 10.1162/jocn.2007.19.7.1081. [DOI] [PubMed] [Google Scholar]
- Russell MB, Olesen J. A nosographic analysis of the migraine aura in a general population. Brain. 1996;119:355–361. doi: 10.1093/brain/119.2.355. [DOI] [PubMed] [Google Scholar]
- Schott GD. Exploring the visual hallucinations of migraine aura: the tacit contribution of illustration. Brain. 2007;130:1690–1703. doi: 10.1093/brain/awl348. [DOI] [PubMed] [Google Scholar]
- Strong AJ, Fabricius M, Boutelle MG, Hibbins SJ, Hopwood SE, Jones R, Parkin MC, Lauritzen M. Spreading and synchronous depressions of cortical activity in acutely injured human brain. Stroke. 2002;33:2738–2743. doi: 10.1161/01.STR.0000043073.69602.09. [DOI] [PubMed] [Google Scholar]
- Sur M, Wall JT, Kaas JH. Modular segregation of functional cell classes within the postcentral somatosensory cortex of monkeys. Science. 1981;212:1059–1061. doi: 10.1126/science.7233199. [DOI] [PubMed] [Google Scholar]
- Tang YT, Mendez JM, Theriot JJ, Sawant PM, López-Valdés HE, Ju YS, Brennan KC. Minimum conditions for the induction of cortical spreading depression in brain slices. J Neurophysiol. 2014;112:2572–2579. doi: 10.1152/jn.00205.2014. [DOI] [PMC free article] [PubMed] [Google Scholar]
- Tootell RB, Hamilton SL, Silverman MS. Topography of cytochrome oxidase activity in owl monkey cortex. J Neurosci. 1985;5:2786–2800. doi: 10.1523/JNEUROSCI.05-10-02786.1985. [DOI] [PMC free article] [PubMed] [Google Scholar]
- von Bornstädt D, Houben T, Seidel JL, Zheng Y, Dilekoz E, Qin T, Sandow N, Kura S, Eikermann-Haerter K, Endres M, Boas DA, Moskowitz MA, Lo EH, Dreier JP, Woitzik J, Sakadžić S, Ayata C. Supply-demand mismatch transients in susceptible peri-infarct hot zones explain the origins of spreading injury depolarizations. Neuron. 2015;85:1117–1131. doi: 10.1016/j.neuron.2015.02.007. [DOI] [PMC free article] [PubMed] [Google Scholar]
- Wang F, Smith NA, Xu Q, Fujita T, Baba A, Matsuda T, Takano T, Bekar L, Nedergaard M. Astrocytes modulate neural network activity by Ca(2)+-dependent uptake of extracellular K+ Sci Signal. 2012;5:ra26. doi: 10.1126/scisignal.2002334. [DOI] [PMC free article] [PubMed] [Google Scholar]
- Wu J, Guo C, Chen S, Jiang T, He Y, Ding W, Yang Z, Luo Q, Gong H. Direct 3D analyses reveal barrel-specific vascular distribution and cross-barrel branching in the mouse barrel cortex. Cereb Cortex. 2016;26:23–31. doi: 10.1093/cercor/bhu166. [DOI] [PubMed] [Google Scholar]
- Xiong Y, Mahmood A, Chopp M. Animal models of traumatic brain injury. Nat Rev Neurosci. 2013;14:128–142. doi: 10.1038/nrn3407. [DOI] [PMC free article] [PubMed] [Google Scholar]