Abstract
A portion of osteoarthritis (OA) patients with total knee arthroplasty (TKA) had monocondylar destruction in medial femoral condyle, but healthy-appearant cartilage in lateral side. However, there is limited information concerning functional differences of cartilage derived mesenchymal stem cell (CMSC) between these two locations in the same donor and its possible role in the pathogenesis of OA. Cells isolated from the degraded cartilage in medial condyle and normal cartilage in lateral side from OA patients were identified with co-expressed markers CD105 and CD166 and confirmed as CMSCs by immunophenotype. The relative percentage, proliferation activity, multi-lineage differentiation potential and miRNA expression profile of CMSCs in two groups were compared by flow cytometry, CCK-8 assay, cytochemical staining, immunohistochemistry, real-time PCR and miRNA microarray analysis. Our study suggested that the percentage (10.61±6.97% vs. 18.44±9.97%, P<0.05) and proliferation rate (P<0.01) of CD105+/CD166+ CMSCs from the degraded cartilage were significantly reduced compared with those from the normal cartilage. CMSCs from the degraded cartilage also showed stronger osteogenic (P<0.05), weaker adipogenic (P<0.01), and comparable chondrogenic potential (P>0.05) during differentiation. MiR-31-5p and miR-424-5p were down regulated in CMSCs from the degraded cartilage. In conclusion, altered function such as reduced percentage and proliferation ability, as well as changes in differentiation profile of CMSC contributed to homeostasis imbalance, leading to OA-related cartilage erosion. Furthermore, regulatory networks of multiple miRNAs may be partially responsible for the dysfunction of CMSCs.
Keywords: Osteoarthritis, cartilage derived mesenchymal stem cell, multi-lineage differentiation potential, miR-31-5p, miR-424-5p
Introduction
Osteoarthritis (OA) is one of the most common degenerative disorders in joints worldwide. It is characterized by slowly progressive destruction and loss of the articular cartilage that mainly affects hips and knees [1]. The prevalence of symptomatic knee OA in China is about 8.1% in the over 45 years population and 10.3% in women, which is higher than the 6.7% and 7.2% in the Framingham OA report, respectively [2,3]. To date, OA is associated with multiple risk factors such as age, genetic susceptibility, environment, mechanical stress and articular injuries in terms of etiology [4], but its specific pathogenesis remains elusive. In 2006, Rando [5] suggested that a decline in tissue regenerative potential was probably due to the intrinsic aging of stem cells or its function impairment in degenerative diseases. Subsequent studies then revealed reduced chondrogenic and adipogenic activity in bone marrow derived MSCs (BMSCs), indicating that OA may result from functional disturbance of mesenchymal stem cells (MSC) or MSC-like cells [6]. The surface zone of articular cartilage containing a progenitor or stem cell population was considered to be an important signaling center for cartilage proliferation, differentiation and matrix deposition [7], and multi-potential mesenchymal progenitor cells have also been identified in OA articular cartilage [8]. Cartilage derived MSCs (CMSCs) showed a transient proliferative response in early OA and became gradual quiet as OA process [9], and it was reported that CMSCs in OA patients held a enhanced osteogenic but decreased adipogenic potential in vitro [10]. Interestingly, a portion of OA patients present monocondylar degeneration, in which medial condyle of the femur shows degenerative cartilage lesions accompanied by healthy-appearance in lateral side. Given the possible roles of MSCs in the pathogenesis of OA, we hypothesize that differences in CMSC function may also exist between medial and lateral condyles from the same donor with OA.
MicroRNAs (MiRNAs) are a type of small non-coding RNA molecules of 20-22 nucleotides in length, which play important roles in a number of physiological and pathological processes. A group of miRNAs were discovered to change their expression in OA tissue, including miR-33a, miR-24, miR-125b, miR-155, miR-146a, and miR-34a [11-15]. This might lead to advancement in our understanding of miRNAs involvement in OA pathogenesis. Recently, numerous evidences have implicated the regulatory effects of miRNAs on MSC multi-lineage differentiation. For instance, miR-125b, miR-140, miR-204, miR-211 and miR-31 have been considered to inhibit osteogenic differentiation of MSC [16-19], while miR-141, miR-155, miR-194, miR-200a, miR-21 and miR-29a play roles in promotion [20-24]. Despite this, little is known about the correlations between MSCs function and miRNAs in OA environment.
In this study, we initially isolated CMSCs from medial and lateral condyles of OA articular cartilage, and compared differences in their function and miRNA expression profile. Furthermore, possible regulatory functions of miRNA on CMSC were also discussed in OA pathogenesis.
Materials and methods
Sample collection
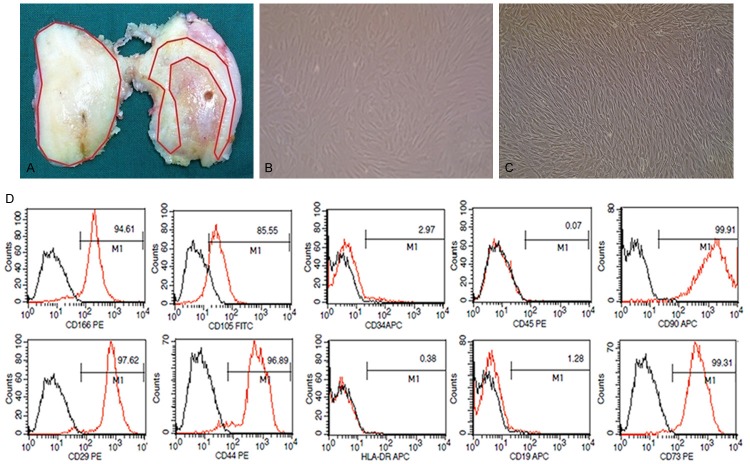
Twelve patients (four males, eight females, median age 67.8 years, range 47-79 years) diagnosed as late-stage OA according to the criteria of American College of Rheumatology [25] were enrolled from Nov. 2013 to Jan. 2014 in Peking Union Medical College Hospital (PUMCH). They suffered degenerative lesions in medial femoral condyle but healthy-appearance in lateral side based on X-ray examination and gross observation during total knee arthroplasty (TKA). Cartilage obtained from the distal femur was divided into normal and degraded groups: the degraded cartilage was from area around fibrosis or lesions in medial condyle (range 0.5-1 cm), and the normal cartilage was from macroscopically healthy-appearing area in lateral condyle (Figure 1A). Written informed consent was obtained from all the patients prior to inclusion, and this study was approved by the Ethics Committee of PUMCH.
Figure 1.
Location of osteoarthritis cartilage specimen, cultivation and identification of cartilage-derived mesenchymal stem cells. A. Image of a representative distal femur of osteoarthritis patient who undergo a total joint replacement surgery. Locations used for the harvesting of cartilage are indicated by red lines: the normal cartilage sample is from healthy-appearing areas in lateral condyle, and the degraded cartilage sample is isolated from 0.5 to 1 cm areas around fibrosis or lesions in medial condyle. B. Chondrocytes on passage 1 are isolated from cartilage specimen (×100). C. CD105+/CD166+ cells on passage 2 are isolated by fluorescence-activated cell sorting (×100). D. Cell surface antigen expression of selected markers on CD105+/CD166+ cells, which met the immune-phenotype criteria of MSC.
Isolation of CMSC
Isolated chondrocytes from medial and lateral condyles were cultured in Dulbecco’s modified eagle medium (DMEM, HyClone, USA) supplemented with 10% fetal bovine serum (FBS, Gibco, USA) and 1% penicillin/streptomycin (Gibco, USA), followed by medium change every 2 to 3 days. After treatment with 0.25% trypsin (Gibco, USA), chondrocytes at passage 2 were adjusted into a concentration of 1×10⁷ cells/mL and double-stained at 4°C for 30 min with antibodies including CD166-PE (mouse anti-human, BD, USA) and CD105-FITC (mouse anti-human, BD, USA) or the respective IgG1 isotype controls. By using double channel fluorescence activated cell sorting (FACS), CD105+/CD166+ cell sub-population was then selected and cultured in mesenchymal stem cell expansion media (MSCEM, ScienCel, USA).
Flow cytometry
CD105+/CD166+ cells at passage 3 were collected and incubated with fluorescence (APC, FITC, or PE)-labeled monoclonal antibodies to CD29, CD44, CD73, CD90, CD105, CD166, CD19, CD34, CD45 and HLA-DR (mouse anti-human, BD, USA) at a concentration of 1×10⁵ cells/mL. Isotype IgG was used as control in each case. Data were collected using a FACScan flow cytometer (Becton Dickinson, USA) and analyzed with Cell Quest software.
Cell proliferation assay
CD105+/CD166+ cell suspension at passage 3 was seeded (2000 cells per well) in a 96-well plate, and incubated for 1, 2, 3, 4 and 5 days, respectively. At each time point, each well was added with 10 µl CCK-8 solution (Dojindo, Japan). The absorbance at 450 nm was measured using a Synergy H1 microplate reader (BioTek, USA).
Multi-lineage differentiation
For osteogenic and adipogenic differentiation, CD105+/CD166+ cells at passage 3 were inoculated (6×10⁴ cells per well)in a 24-well plate, expanded to 80% confluence, and then incubated in osteogenic medium (10 nM dexamethasone, 10 µM L-VitC, 20 mM β-glycerophosphate, 10% FBS, 1 × L-Glucose in low glucose DMEM) or adipogenic medium (1 µM dexamethasone, 0.5 mM IBMX, 200 µM indomethacin, 10% FBS, 1 × L-Glucose in high glucose DMEM) for 21 days, respectively. Cells in controls remained incubating with MSCEM. For chondrogenic differentiation, 1×10⁶ CD105+/CD166+ cells at passage 3 were placed into a 15 mL polypropylene tube, centrifuged, and grown as high-density pellets in chondrogenic medium (77.5 nM dexamethasone, 1% ITS plus culture supplement, 50 μM L-VitC, 10 ng/mL TGF-β1 and 10% FBS in low glucose DMEM) for 28 days. Medium was changed every 3 to 4 days. After differentiation, cells or pellets were harvested and fixed with 4% paraformaldehyde for cytological or histological evaluation.
Cytochemical staining and immunohistochemistry
Differentiated cells undergoing osteogenic and adipogenic differentiation were stained by Alizarin Red and Oil-Red-O, respectively. The chondrogenic pellets were embedded with paraffin, cut into 5 μm-thick sections and processed for immunohisochemical staining after deparaffinization and rehydration. The rabbit anti-human primary antibodies against Sox-9, collagen 2 and aggrecan (Bioworld Technology, USA) were dropped on the sections and incubated overnight at 4°C, with PBS as negative control. After washing, incubation with horseradish peroxidase-goat anti-rabbit secondary antibody (Zhongshan Gold Bridge, China) was performed for 30 min at room temperature. Reaction was visualized using DAB detection system. Evaluation was carried out by a Leica TCS SP2 microscope (LEICA, German).
Quantitative real-time PCR
Total RNA was extracted using Trizol (Invitrogen, USA), and 1 µg RNA was reversely-transcribed into cDNA with Reverse Transcription System Kit (Promega, USA). Real-time PCR was performed on an ABI7900HT machine (ABI, USA) using SYBR FAST qPCR Kit (KAPA Biosystems, USA). Primers designed by Primer Premier 5.0 were shown in Table 1. Gene expression was calculated by an equation of 2ΔΔCt, and h-actin was served as the reference gene.
Table 1.
Primers for mRNA sequences
| Primer sequence (5’-3’) | ||
|---|---|---|
|
|
||
| Primer name | Forward | Reverse |
| PPAR-γ2 | ACCAAAGTGCAATCAAAGTGGA | ATGAGGGAGTTGGAAGGCTCT |
| LPL | AGGATGTGGCCCGGTTTATC | CCAAGGCTGTATCCCAAGAGAT |
| runx-2 | TGTCATGGCGGGTAACGAT | AAGACGGTTATGGTCAAGGTGAA |
| aggrecan | AGTGGAATGATGTTCCCTGC | GGTCCTGGCATGCTCCAC |
| collagen 2 | AACCAGATTGAGAGCATCCG | GGGTCAATCCAGTAGTCTCCAC |
| h-actin | AGCACAATGAAGATCAAGATCAT | ACTCGTCATACTCCTGCTTGC |
miRNA microarray analysis
Total RNA (>5 μg) was filtered by NanoSep100K to obtain miRNA, isolated miRNA was labeled with Cy5 fluorescent dyes using miRNA ULSTM Labeling kit (Kreatech Diagnostics, Netherlands), and then hybridized onto the Human miRNA OneArray v4 (Phalanx Biotech Group, Taiwan), which contained probes for 1921 human miRNAs (Sanger miRBase18.0). Each sample was performed in triplicate. The fluorescence intensities of each spot were analyzed using GenePix 4.0 software (Molecular Devices, USA). The normalized spot was set as log2 |Fold change|≥0.8 and P<0.05 to determine the differentially expressed miRNAs. Real-time PCR was performed for validation using miRcute miRNA qPCR Detection Kit (SYBR Green) (TIANGEN, China) after polyadenylation and reverse transcription (miRcute miRNA First-Strand cDNA Synthesis Kit, TIANGEN, China). miRNA primers were shown in Table 2. The target miRNAs were amplified by 40 cycle (95°C for 15 s, 60°C for 20 s, 72°C for 15 s), following an initial denaturation step (95°C for 3 min). miRNA expression was normalized to U6 and measured by 2ΔΔCt method. Cluster 3.0 was employed for Gene Ontology (GO) Clustering.
Table 2.
Primers for miRNA sequences
| miRNA | Sequence |
|---|---|
| hsa-miR-31-5p | CTGGAGGCAAGATGCTGGC |
| hsa-miR-424-5p | TCTGGCAGCAGCAATTCATGT |
| hsa-miR-100-5p | CGAGGAACCCGTAGATCCGAA |
| hsa-miR-30a-5p | TGTCCTTGGTGTAAACATCCTCG |
| hsa-miR-23b-3p | CGGATCACATTGCCAGGGATTA |
| hsa-miR-199a-5p | CGGCCCAGTGTTCAGACTAC |
| hsa-miR-375 | GTTTGTTCGTTCGGCTCGC |
| U6 | ACGCAAATTCGTGAAGCGTTC |
Statistical analysis
The SPSS 19.0 software was used for statistical analysis. Data were expressed as median (range) or mean ± standard error. Paired t-test was employed to analyze statistical significance between degraded and normal groups. Particularly, statistical difference of proliferation rate between two groups was calculated with linear regression analysis and Chi-square test using the Stata 11.1 software. Differences were considered to be statistically significant when P<0.05.
Results
CD105+/CD166+ CMSCs in the Degraded and Normal cartilage
Chondrocytes from all twelve patients were successfully cultured (Figure 1B), and CD105+/CD166+ CMSCs from 10 patients exhibiting long-spindle shape were successfully identified and expanded (Figure 1C).
The percentage of CD105+/CD166+ CMSCs in chondrocytes from the degraded and normal cartilage was 10.61±6.97% (range 0.01-22.90%) and 18.44±9.97% (range 4.34-35.46%), respectively (n=10) by flow cytometry analysis. Significantly lower numbers of CD105+/CD166+ CMSCs were found in degraded group (t=2.709, P=0.024) (Table 3, Figure 2A).
Table 3.
Percentage of CD105+/CD166+ CMSCs isolated from degraded and normal cartilages
| No. of patients | Sex/Age | Normal (%) | Degraded (%) |
|---|---|---|---|
| 1# | M/47 yr | 35.46 | 8.60 |
| 2# | F/66 yr | 9.71 | 9.17 |
| 3# | F/80 yr | 4.34 | 0.01 |
| 4# | F/66 yr | 18.80 | 11.60 |
| 5# | F/75 yr | 29.60 | 20.00 |
| 6# | F/73 yr | 7.33 | 6.09 |
| 7# | F/63 yr | 17.60 | 22.90 |
| 8# | M/73 yr | 26.20 | 17.10 |
| 9# | M/73 yr | 10.00 | 3.20 |
| 10# | F/57 yr | 25.40 | 7.40 |
Figure 2.
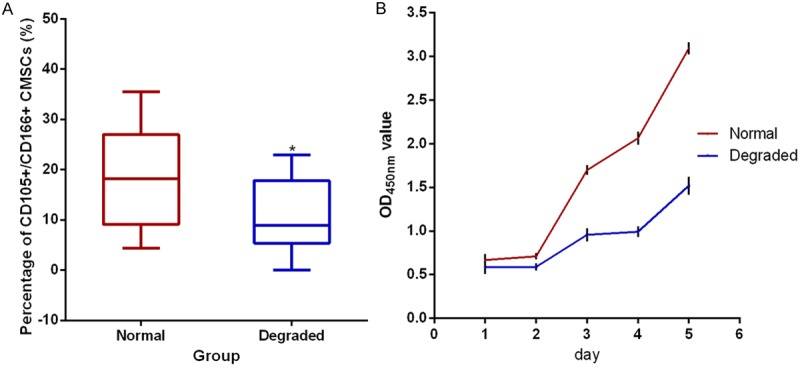
The percentage (A) and proliferation rate (B) of CD105+/CD166+ cartilage-derived mesenchymal stem cells (CMSCs) in the degraded and normal cartilage. (A) The percentage of CD105+/CD166+ CMSCs is analyzed by fluorescence-activated cell sorting (n=10) and compared by paired t-test. Data are presented as the median (horizontal bar), 25th and 75th percentiles (boxes), extrema (error bars), *P<0.05. (B) The proliferation rate of CD105+/CD166+ CMSCs tested by CCK-8 assay (n=5) and presented as the mean ± SEM.
Cell surface antigen pattern of CD105+/CD166+ CMSCs
Immunophenotype assessment by flow cytometry (Figure 1D) demonstrated that CD105+/CD166+ CMSCs were positive for CD29 (97.62%), CD44 (96.89%), CD90 (99.91%), CD73 (99.31%), CD105 (85.55%) and CD166 (94.61%), while almost negative for CD19 (1.28%), CD34 (2.97%), CD45 (0.07%) and HLA-DR (0.38%), which fulfilled the general immunophenotype criteria to define MSC according to the International Society for Cellular Therapy (ISCT) [26].
Proliferation rate of CD105+/CD166+ CMSCs
CCK-8 array showed that the proliferation rate of CMSCsin the degraded group (n=5) was significantly reduced compared with that in the normal cartilage (Χ2=109.43, P<0.01). OD value at each time point was depicted (Figure 2B).
Multi-lineage differentiation potential of CD105+/CD166+ CMSCs
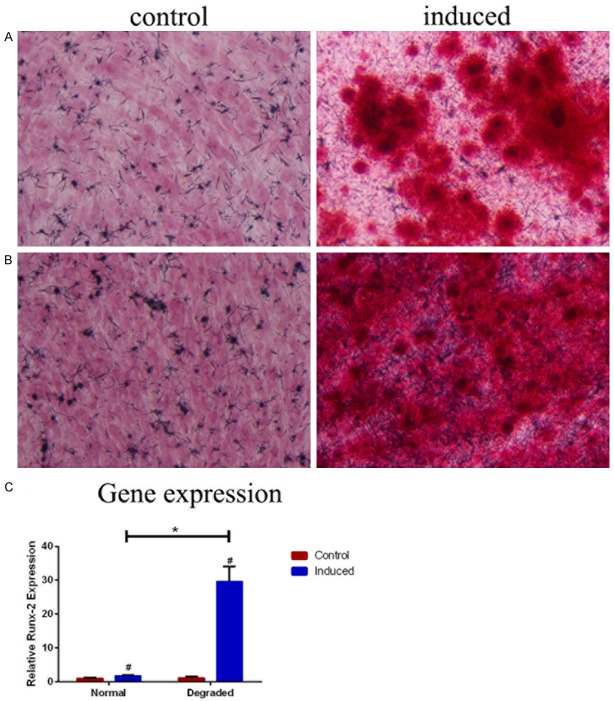
After 21 days of osteogenic differentiation, calcium deposits were observed obviously around differentiated cells in both degraded and normal groups (n=3) but not in the controls (Figure 3A). Alizarin red staining showed more and larger scattered red calcium nodules in cells from the degraded cartilage compared to the normal cartilage. Results of real-time PCR revealed a significantly increased expression of Runx-2 (t=-10.14, P=0.010) in the degraded group (n=3) (Figure 3B). Therefore a stronger osteogenic potential of CD105+/CD166+ CMSC was demonstrated in the degraded cartilage compared with the normal cartilage.
Figure 3.
Osteogenic differentiations of CD105+/CD166+ cartilage-derived mesenchymal stem cells (CMSCs) in normal (A) and degraded (B) cartilage. (A and B) Osteogenic differentiation cells are induced using osteogenic induction medium (right image), control cells are cultured in MSC growth medium (left image), and cells are stained by Alizarin Red after 21 days (n=3, ×200). (C) The expression of Runx-2 mRNA is analyzed by RT-PCR (n=3). #P<0.05 compared with control cells from the same group, *P<0.05 compared with induced cells from the normal group. Data are presented as the mean ± SEM.
After 21 days of adipogenic differentiation, adipocytes with typical appearances and multilocular lipid droplets were observed in both groups (n=3), but cells in the degraded group contained less lipid vacuoles (Figure 4A). Significantly lower expression of PPAR-γ2 (t=11.28, P<0.001), but equivalent expression of LPL (t=-1.89, P=0.13) were shown in the degraded group (n=3) (Figure 4B) by real-time PCR. This result indicated CD105+/CD166+ CMSC had a relatively weaker adipogenic capacity in the degraded cartilage compared with that in the normal cartilage.
Figure 4.
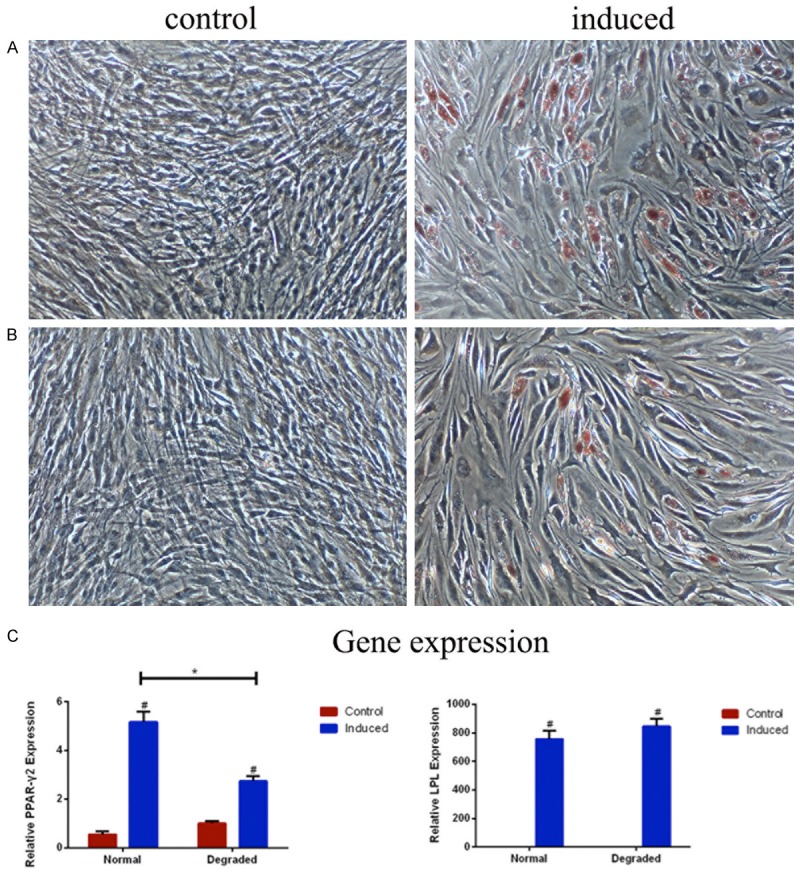
Adipogenic differentiation of CD105+/CD166+ cartilage-derived mesenchymal stem cells (CMSCs) in normal (A) and degraded (B) cartilage. (A and B) Adipogenic differentiation cells are induced using adipogenic induction medium (right imgae ×100), control cells are cultured in MSC growth medium (left image ×100), and cells are stained by oil-red-O after 21 days (n=3). (C) The expressions of PPAR-γ2 and LPL mRNA are analyzed by RT-PCR (n=3). #P<0.05 compared with control cells from the same group, *P<0.05 compared with induced cells from the normal group. Data are presented as the mean ± SEM.
After 28 days of chondrogenic differentiation, immune staining of cell pellets for Sox-9, Collagen 2 and aggrecan was detected within cytoplasm and extracellular matrix in both groups (n=3) with no significant difference, but only a few of positive cells could be observed singlely in controls (Figure 5A-C). Real-time PCR showed no statistical differences in the expression of Collagen 2 (t=-1.27, P=0.331) and aggrecan (t=-1.41, P=0.294) between the two groups (n=3) (Figure 5D). This result confirmed that CMSC in the degraded cartilage exhibited a comparable chondrogenic potential to that in the normal cartilage.
Figure 5.
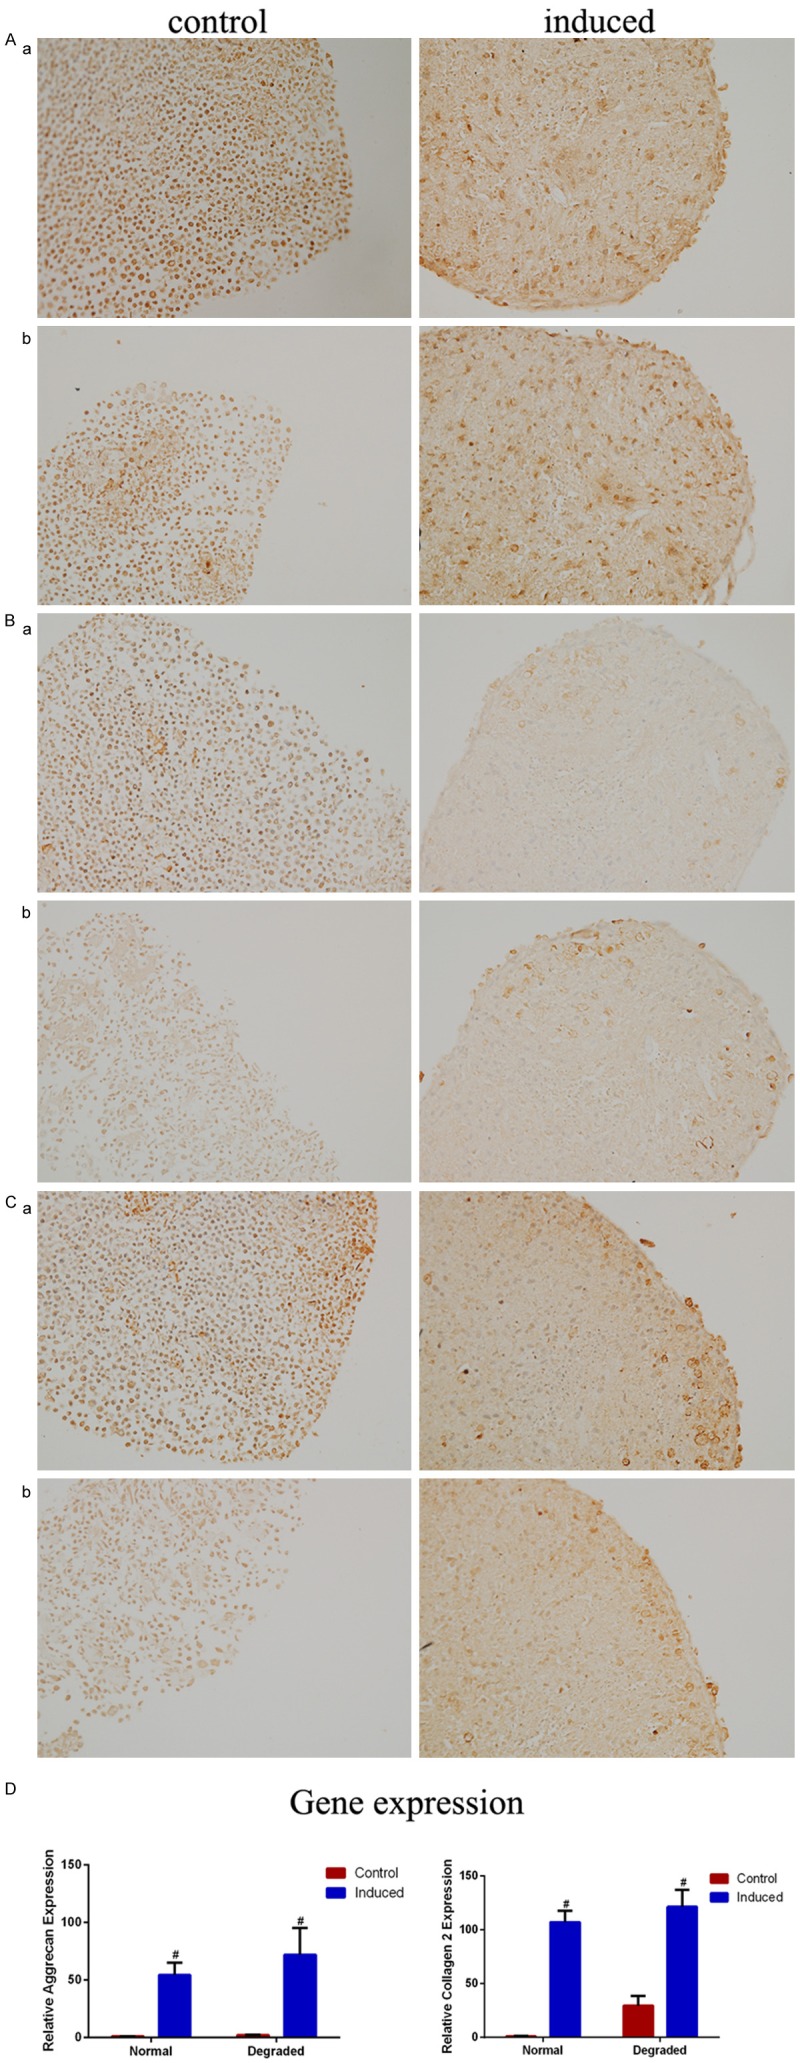
Chondrogenic differentiation of CD105+/CD166+ cartilage-derived mesenchymal stem cells (CMSCs) in normal (a) and degraded cartilage (b). Chondrogenic differentiation cells are induced using chondrogenic induction medium (right image ×200), control cells are cultured in MSC growth medium (left image ×200), and immunostained for (A) Aggrecan (B) Collagen 2 (C) Sox-9 after 28 days of induction (n=3). (D) The expressions of Collagen 2 and Aggrecan mRNA are analyzed by RT-PCR (n=3), no statistical differences are shown between degraded and normal group after chondrogenic differentiation, #P<0.05 compared with control cells from the same group. Data are presented as the mean ± SEM.
miRNA expression profile of CD105+/CD166+ CMSCs
A total of ten significantly differentially expressed miRNAs were identified in the miRNA microarray analysis (Table 4). Seven up-regulated (miR-574-5p, miR-30a, miR-100, miR-23b, miR-375, miR-1273f and miR-5096) and three down-regulated (miR-31, miR-424 and miR-199a-5p) miRNAs were detected in CMSCs from the degraded group compared to those from the normal group (n=3). Unsupervised hierarchical clustering of normal and degraded groups revealed that miR31 was the most differentially expressed one with a fold change of 7.2 (Figure 6A).
Table 4.
The differentially expressed genesin CD105+/CD166+ CMSC isolated from the degraded cartilage compared to the normal cartilage (log2 |Fold change|≥0.8, P<0.05)
| Normalized intensity | |||||
|---|---|---|---|---|---|
|
|
|||||
| ID | miRNA | normal | degraded | log2 (Ratio) | P |
| (a) Up-regulated miRNAs | |||||
| PH_mr_0000379 | hsa-miR-574-5p | 427.896997 | 1176.260072 | 1.458872 | 0.024 |
| PH_mr_0001891 | hsa-miR-30a | 215.896931 | 500.458753 | 1.212908 | 0.007 |
| PH_mr_0000017 | hsa-miR-100 | 870.227429 | 1862.915277 | 1.098098 | 0.028 |
| PH_mr_0002528 | hsa-miR-23b | 529.219343 | 1123.809346 | 1.086460 | 0.007 |
| PH_mr_0000029 | hsa-miR-375 | 481.852345 | 1010.129185 | 1.067877 | 0.002 |
| PH_mr_0004874 | hsa-miR-1273f | 186.763498 | 336.108864 | 0.847716 | 0.043 |
| PH_mr_0004876 | hsa-miR-5096 | 113.539104 | 203.826506 | 0.844152 | 0.046 |
| (b) Down-regulated miRNAs | |||||
| PH_mr_0000014 | hsa-miR-31 | 1171.109304 | 162.299989 | -2.851141 | <0.001 |
| PH_mr_0003339 | hsa-miR-424 | 225.961144 | 114.246381 | -0.983926 | 0.021 |
| PH_mr_0001948 | hsa-miR-199a-5p | 738.698744 | 407.850774 | -0.856945 | 0.040 |
Figure 6.
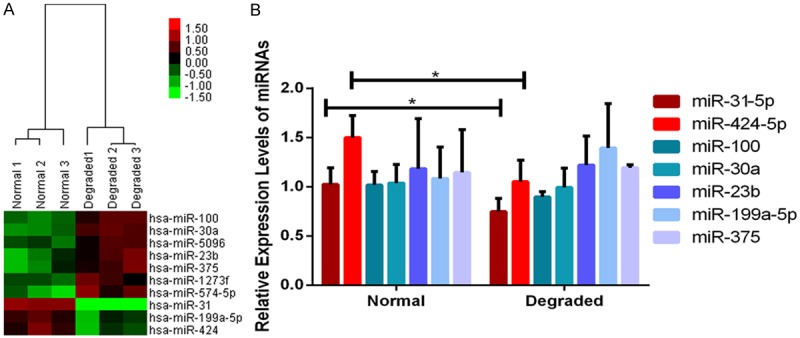
Clustering analysis (A) and validation (B) of significantly differentially expressed miRNAs in cartilage-derived mesenchymal stem cells (CMSCs) between Normal and Degraded cartilage. (A) Two-dimensional cluster diagram of 10 significantly differentially expressed miRNAs. Columns represent individual donor samples, and each row represents individual assayed miRNA. Down-regulation of miRNAs is in green, and up-regulation of miRNAs is in red. (B) Validation of 7 candidate miRNAs (n=3). Significantly lower expression of miR-31-5p and miR-424-5p in CMSC from the Degraded cartilage are confirmed by real-time PCR, *P<0.05, data are presented as the mean ± SEM.
Validation of miRNA
Seven candidate miRNAs (miR-30a, miR-100, miR-23b, miR-375, miR-31, miR-424 and miR-199a-5p) were selected for miRNA expression validation using real-time PCR (n=3). Significantly down-regulated expression of miR-31-5p (t=6.92, P=0.020) and miR-424-5p (t=58.68, P<0.001) were observed in CMSCs from the degraded group compared to those from the normal group, however, no statistical differences were detected in other miRNAs (Figure 6B).
Discussion
In this study, we isolated and identified CD105+/CD166+ CMSCs from the degraded cartilage in medial condyle and normal cartilage in lateral side from OA patients. Compared with CMSC from the normal cartilage, CMSC from the degraded cartilage showed a significantly lower percentage, and a significantly reduced proliferation rate. In terms of differentiation profile, CMSCs from the degraded cartilage demonstrated stronger osteogenic, weaker adipogenic, and comparable chondrogenic potential. Besides, miR-31-5p and miR-424-5p related to osteogenic differentiation were down regulated in CMSCs from the degraded cartilage.
Techniques for isolation of CMSCs have been established and widely applied since chondrocyte subpopulation with progenitor-like characteristics was firstly identified in 2004 [7]. Recently, it has been reported that multi-potential CMSCs with co-expression of CD105 and CD166 markers were isolated from OA articular cartilage [8,27], and markers like CD9+/CD90+/CD166+ [28], CD146 [29] and Notch-1 [30] were also employed as candidates for CMSC purification. In the present study, we isolated CD105+/CD166+ cells by FACS from the degraded and normal cartilage of OA patients, and confirmed them as MSCs based on their multi-lineage differentiation potential, growth pattern as well as immunophenotype.
Previous study showed the percentage of CD105+/CD166+ cells in OA cartilage was significantly higher than that in normal cartilage (3.49±1.93%), but did not differ between normal-appearing and degraded OA cartilage from the same donor [8]. However, our study revealed that degraded cartilage contained significantly lower numbers of CD105+/CD166+ CMSCs than normal cartilage in OA (10.61±6.97%/18.44±9.97%, respectively). Cartilage collection strategy may contribute to this discrepancy. Because in our study, all the degraded cartilage samples were obtained from medial condyle of late-stage OA patients. In addition, the wearing cartilage with different degree embraced different percentage of CMSCs [10,27]. Therefore, irreversible degenerative alterations of medial condyle were probably due to loss of cartilage repair capacity and reduced percentage of CMSCs in the degraded cartilage, which can be confirmed by its significantly reduced proliferation rate in our study. Accordingly, Murphy described earlier that OA patient-derived BMSC exhibited a significantly reduced proliferation activity [6]. Moreover, high percentage of CD105+/CD166+ CMSC (18.44±9.97%, range 4.34-35.46%) was found in OA normal-appearing cartilage, which was consistent with earlier reports indicating a relatively higher percentage in mild to moderate changed OA cartilage and normal cartilage (16.7±2.1%/15.3±2.3%, respectively) [27]. All these findings suggested a yet unexplored capacity for regeneration in the normal cartilage of OA.
The differentiation profile of MSCs has been reported to be changed in OA patients. In this study, CMSC from the degraded cartilage had a stronger osteogenic but a weaker adipogenic potential, as well as a comparable chondrogenic potential compared with CMSCs from normal cartilage. Heterogeneity in the adipogenesis and osteogenesis was observed in many studies [10,31,32]. Runx2, as an osteogenic key transcription factor, was involved in regulating the reciprocal differentiation pathways of osteoblast and adipocyte lineages. Knockout of Runx-2 resulted in adipogenic differentiation of chondrocytes in mice [33]. Regarding a remarkably increased expression of Runx-2 in the degraded group in our study, it was likely that regulation of Runx-2 played an important role in reduced adipogenic but enhanced osteogenic differentiation potential of CMSCs in the degraded cartilage. As for chondrogenic capacity, an earlier study reported declined potential of CMSCs from OA patients [6], while later studies showed similar chondrogenic potential of MSCs between OA patients and donors with a femoral fracture [34,35]. Our study confirmed no difference in chondrogenic potential of CMSCs between normal and degraded cartilage from the same donor with OA, after restricting sampling criteria. Combined with previous reports [10,36,37], we speculate that the primary defect in OA is likely bone-associated, and osteogenic process of CMSC may play a key role in the occurrence and development of OA accompanied by relatively restrained chondrogenesis rather than absolutely impaired chondrogenesis.
Recently, a group of miRNAs were discovered to be down-regulated during osteogenic induction [16-24]. Here two significantly down-regulated miRNAs, miR-31-5p and miR-424-5p, were identified in CMSCs from OA degraded cartilage, and potentially associated with regulation of osteogenic differentiation. Runx-2 directly bound to the promoter regions of the miR-31 and controlled its expression precisely. MiR-31 inhibited osteogenesis of MSC by affecting the expression of SATB-2 and Osterix, two significant osteogenesis-related genes [19,38,39]. MiR-31 could also enhance cell proliferation during differentiation via negatively regulation of CEBPA expression [40]. Thus, loss of inhibition due to significant down-regulation expression may contribute to the enhanced osteogenic potential and declined proliferation activity of CMSC in OA degraded cartilage observed in our study. MiR-424 was also reported to be down-regulated in the osteogenesis of hBMSC accompanied with miR-31, and predicted to inhibit osteogenic differentiation of MSC by BMP receptor signaling pathways [41,42]. Further studies should focus on miR-31 and miR-424 to reveal their exact regulation mechanism in CMSCs from OA patients.
In summary, our study showed that CD105+/CD166+ CMSCs from degraded cartilage in medial condyle of OA patients had a reduced proliferation activity, a weaker adipogenic but stronger osteogenic potential, as well as two differentially expressed miRNAs (miR-31-5p and miR-424-5p) compared to OA normal-appearing cartilage from lateral condyle. Our findings supported that reduced activity in proliferation and changes in differentiation profile of CMSC contributed to homeostasis imbalance and led to OA-related erosion of cartilage. The regulatory networks of multiple miRNAs may be partially responsible for the altered function of CMSCs which needed further study for its possible targets. This study opens new possibilities to achieve intrinsic cartilage repair and adds a novel aspect to the pathogenesis of cartilage degradation in OA.
Acknowledgements
The work has been partly supported by National Natural Science Foundation of China (81472045, 81472046, 81130034, 81271942 and 81501852), Beijing Natural Science Foundation (7144235), and Distinguished Young Scholars of Peking Union Medical College Hospital (JQ201506).
Disclosure of conflict of interest
None.
References
- 1.Tsezou A. Osteoarthritis Year in Review 2014: genetics and genomics. Osteoarthritis Cartilage. 2014;22:2017–2024. doi: 10.1016/j.joca.2014.07.024. [DOI] [PubMed] [Google Scholar]
- 2.Felson DT, Naimark A, Anderson J, Kazis L, Castelli W, Meenan RF. The prevalence of knee osteoarthritis in the elderly. The Framingham Osteoarthritis Study. Arthritis Rheum. 1987;30:914–918. doi: 10.1002/art.1780300811. [DOI] [PubMed] [Google Scholar]
- 3.Tang X, Wang S, Zhang Y, Niu J, Tao K, Lin J. The prevalence of symptomatic knee osteoarthritis in China: Results from China Health and Retirement Longitudinal Study. Osteoarthritis Cartilage. 2015:A176–A177. doi: 10.1002/art.39465. [DOI] [PubMed] [Google Scholar]
- 4.Karlson EW, Mandl LA, Aweh GN, Sangha O, Liang MH, Grodstein F. Total hip replacement due to osteoarthritis: the importance of age, obesity, and other modifiable risk factors. Am J Med. 2003;114:93–98. doi: 10.1016/s0002-9343(02)01447-x. [DOI] [PubMed] [Google Scholar]
- 5.Rando TA. Stem cells, ageing and the quest for immortality. Nature. 2006;441:1080–1086. doi: 10.1038/nature04958. [DOI] [PubMed] [Google Scholar]
- 6.Murphy JM, Dixon K, Beck S, Fabian D, Feldman A, Barry F. Reduced chondrogenic and adipogenic activity of mesenchymal stem cells from patients with advanced osteoarthritis. Arthritis Rheum. 2002;46:704–713. doi: 10.1002/art.10118. [DOI] [PubMed] [Google Scholar]
- 7.Dowthwaite GP, Bishop JC, Redman SN, Khan IM, Rooney P, Evans DJ, Haughton L, Bayram Z, Boyer S, Thomson B. The surface of articular cartilage contains a progenitor cell population. J Cell Sci. 2004;117:889–897. doi: 10.1242/jcs.00912. [DOI] [PubMed] [Google Scholar]
- 8.Alsalameh S, Amin R, Gemba T, Lotz M. Identification of mesenchymal progenitor cells in normal and osteoarthritic human articular cartilage. Arthritis Rheum. 2004;50:1522–1532. doi: 10.1002/art.20269. [DOI] [PubMed] [Google Scholar]
- 9.Tong W, Geng Y, Huang Y, Shi Y, Xiang S, Zhang N, Qin L, Shi Q, Chen Q, Dai K. In Vivo Identification and Induction of Articular Cartilage Stem Cells by Inhibiting NF-κB Signaling in Osteoarthritis. Stem Cells. 2015;33:3125–3137. doi: 10.1002/stem.2124. [DOI] [PubMed] [Google Scholar]
- 10.Salamon A, Jonitz-Heincke A, Adam S, Rychly J, Müller-Hilke B, Bader R, Lochner K, Peters K. Articular cartilage-derived cells hold a strong osteogenic differentiation potential in comparison to mesenchymal stem cells in vitro. Exp Cell Res. 2013;319:2856–2865. doi: 10.1016/j.yexcr.2013.09.008. [DOI] [PubMed] [Google Scholar]
- 11.Kostopoulou F, Malizos KN, Papathanasiou I, Tsezou A. MicroRNA-33a regulates cholesterol synthesis and cholesterol efflux related genes in osteoarthritic chondrocytes. Arthritis Res Ther. 2015;17:42. doi: 10.1186/s13075-015-0556-y. [DOI] [PMC free article] [PubMed] [Google Scholar]
- 12.Matsukawa T, Sakai T, Yonezawa T, Hiraiwa H, Hamada T, Nakashima M, Ono Y, Ishizuka S, Nakahara H, Lotz MK. MicroRNA-125b regulates the expression of aggrecanase-1 (ADAMTS-4) in human osteoarthritic chondrocytes. Arthritis Res Ther. 2013;15:R28. doi: 10.1186/ar4164. [DOI] [PMC free article] [PubMed] [Google Scholar]
- 13.Kurowska-Stolarska M, Alivernini S, Ballantine LE, Asquith DL, Millar NL, Gilchrist DS, Reilly J, Ierna M, Fraser AR, Stolarski B. MicroRNA-155 as a proinflammatory regulator in clinical and experimental arthritis. Proc Natl Acad Sci U S A. 2011;108:11193–11198. doi: 10.1073/pnas.1019536108. [DOI] [PMC free article] [PubMed] [Google Scholar]
- 14.Li X, Gibson G, Kim J, Kroin J, Xu S, Van Wijnen AJ, Im H. MicroRNA-146a is linked to pain-related pathophysiology of osteoarthritis. Gene. 2011;480:34–41. doi: 10.1016/j.gene.2011.03.003. [DOI] [PMC free article] [PubMed] [Google Scholar]
- 15.Abouheif MM, Nakasa T, Shibuya H, Niimoto T, Kongcharoensombat W, Ochi M. Silencing microRNA-34a inhibits chondrocyte apoptosis in a rat osteoarthritis model in vitro. Rheumatology. 2010;49:2054–2060. doi: 10.1093/rheumatology/keq247. [DOI] [PubMed] [Google Scholar]
- 16.Huang K, Fu J, Zhou W, Li W, Dong S, Yu S, Hu Z, Wang H, Xie Z. MicroRNA-125b regulates osteogenic differentiation of mesenchymal stem cells by targeting Cbfβ in vitro. Biochimie. 2014;102:47–55. doi: 10.1016/j.biochi.2014.02.005. [DOI] [PubMed] [Google Scholar]
- 17.Hwang S, Park S, Lee HY, Kim SW, Lee JS, Choi EK, You D, Kim C, Suh N. miR-140-5p suppresses BMP2-mediated osteogenesis in undifferentiated human mesenchymal stem cells. FEBS Lett. 2014;588:2957–2963. doi: 10.1016/j.febslet.2014.05.048. [DOI] [PubMed] [Google Scholar]
- 18.Huang J, Zhao L, Xing L, Chen D. MicroRNA-204 regulates Runx2 protein expression and mesenchymal progenitor cell differentiation. Stem Cells. 2010;28:357–364. doi: 10.1002/stem.288. [DOI] [PMC free article] [PubMed] [Google Scholar]
- 19.Xie Q, Wang Z, Bi X, Zhou H, Wang Y, Gu P, Fan X. Effects of miR-31 on the osteogenesis of human mesenchymal stem cells. Biochem Biophys Res Commun. 2014;446:98–104. doi: 10.1016/j.bbrc.2014.02.058. [DOI] [PubMed] [Google Scholar]
- 20.Sangani R, Periyasamy-Thandavan S, Kolhe R, Bhattacharyya MH, Chutkan N, Hunter M, Isales C, Hamrick M, Hill WD, Fulzele S. MicroRNAs-141 and 200a regulate the SVCT2 transporter in bone marrow stromal cells. Mol Cell Endocrinol. 2015;410:19–26. doi: 10.1016/j.mce.2015.01.007. [DOI] [PMC free article] [PubMed] [Google Scholar]
- 21.Wu T, Xie M, Wang X, Jiang X, Li J, Huang H. miR-155 modulates TNF-α-inhibited osteogenic differentiation by targeting SOCS1 expression. Bone. 2012;51:498–505. doi: 10.1016/j.bone.2012.05.013. [DOI] [PubMed] [Google Scholar]
- 22.Jeong BC, Kang IH, Hwang YC, Kim SH, Koh JT. MicroRNA-194 reciprocally stimulates osteogenesis and inhibits adipogenesis via regulating COUP-TFII expression. Cell Death Dis. 2014;5:e1532. doi: 10.1038/cddis.2014.485. [DOI] [PMC free article] [PubMed] [Google Scholar]
- 23.Meng YB, Li X, Li ZY, Zhao J, Yuan XB, Ren Y, Cui ZD, Liu YD, Yang XJ. microRNA-21 promotes osteogenic differentiation of mesenchymal stem cells by the PI3K/β-catenin pathway. J Orthop Res. 2015;33:957–64. doi: 10.1002/jor.22884. [DOI] [PubMed] [Google Scholar]
- 24.Wang FS, Chung PC, Lin CL, Chen MW, Ke HJ, Chang YH, Chen YS, Wu SL, Ko JY. MicroRNA-29a protects against glucocorticoid-induced bone loss and fragility in rats by orchestrating bone acquisition and resorption. Arthritis Rheum. 2013;65:1530–1540. doi: 10.1002/art.37948. [DOI] [PubMed] [Google Scholar]
- 25.Altman R, Asch E, Bloch D, Bole G, Borenstein D, Brandt K, Christy W, Cooke TD, Greenwald R, Hochberg M. Development of criteria for the classification and reporting of osteoarthritis: classification of osteoarthritis of the knee. Arthritis Rheum. 1986;29:1039–1049. doi: 10.1002/art.1780290816. [DOI] [PubMed] [Google Scholar]
- 26.Dominici M, Le Blanc K, Mueller I, Slaper-Cortenbach I, Marini FC, Krause DS, Deans RJ, Keating A, Prockop DJ, Horwitz EM. Minimal criteria for defining multipotent mesenchymal stromal cells. The International Society for Cellular Therapy position statement. Cytotherapy. 2006;8:315–317. doi: 10.1080/14653240600855905. [DOI] [PubMed] [Google Scholar]
- 27.Pretzel D, Linss S, Rochler S, Endres M, Kaps C, Alsalameh S, Kinne RW. Relative percentage and zonal distribution of mesenchymal progenitor cells in human osteoarthritic and normal cartilage. Arthritis Res Ther. 2011;13:R64. doi: 10.1186/ar3320. [DOI] [PMC free article] [PubMed] [Google Scholar]
- 28.Fickert S, Fiedler J, Brenner RE. Identification of subpopulations with characteristics of mesenchymal progenitor cells from human osteoarthritic cartilage using triple staining for cell surface markers. Arthritis Res Ther. 2004;6:R422–32. doi: 10.1186/ar1210. [DOI] [PMC free article] [PubMed] [Google Scholar]
- 29.Su X, Zuo W, Wu Z, Chen J, Wu N, Ma P, Xia Z, Jiang C, Ye Z, Liu S. CD146 as a new marker for an increased chondroprogenitor cell sub-population in the later stages of osteoarthritis. J Orthop Res. 2015;33:84–91. doi: 10.1002/jor.22731. [DOI] [PubMed] [Google Scholar]
- 30.Hiraoka K, Grogan S, Olee T, Lotz M. Mesenchymal progenitor cells in adult human articular cartilage. Biorheology. 2006;43:447–454. [PubMed] [Google Scholar]
- 31.Kang H, Hata A. The role of microRNAs in cell fate determination of mesenchymal stem cells: balancing adipogenesis and osteogenesis. BMB Rep. 2014;48:319–23. doi: 10.5483/BMBRep.2015.48.6.206. [DOI] [PMC free article] [PubMed] [Google Scholar]
- 32.Martin EC, Qureshi AT, Dasa V, Freitas MA, Gimble JM, Davis TA. MicroRNA regulation of stem cell differentiation and diseases of the bone and adipose tissue: Perspectives on miRNA biogenesis and cellular transcriptome. Biochimie. 2016;124:98–111. doi: 10.1016/j.biochi.2015.02.012. [DOI] [PubMed] [Google Scholar]
- 33.Enomoto H, Furuichi T, Zanma A, Yamana K, Yoshida C, Sumitani S, Yamamoto H, Enomoto-Iwamoto M, Iwamoto M, Komori T. Runx2 deficiency in chondrocytes causes adipogenic changes in vitro. J Cell Sci. 2004;117:417–425. doi: 10.1242/jcs.00866. [DOI] [PubMed] [Google Scholar]
- 34.Dudics V, Kunstár A, Kovács J, Lakatos T, Géher P, Gömör B, Monostori Ė, Uher F. Chondrogenic potential of mesenchymal stem cells from patients with rheumatoid arthritis and osteoarthritis: measurements in a microculture system. Cells Tissues Organs. 2009;189:307–316. doi: 10.1159/000140679. [DOI] [PubMed] [Google Scholar]
- 35.Liu Y, Buckley CT, Almeida HV, Mulhall KJ, Kelly DJ. Infrapatellar fat pad-derived stem cells maintain their chondrogenic capacity in disease and can be used to engineer cartilaginous grafts of clinically relevant dimensions. Tissue Eng Part A. 2014;20:3050–3062. doi: 10.1089/ten.tea.2014.0035. [DOI] [PMC free article] [PubMed] [Google Scholar]
- 36.Li B, Aspden RM. Composition and mechanical properties of cancellous bone from the femoral head of patients with osteoporosis or osteoarthritis. J Bone Miner Res. 1997;12:641–651. doi: 10.1359/jbmr.1997.12.4.641. [DOI] [PubMed] [Google Scholar]
- 37.Dequeker J, Mokassa L, Aerssens J, Boonen S. Bone density and local growth factors in generalized osteoarthritis. Microsc Res Tech. 1997;37:358–371. doi: 10.1002/(SICI)1097-0029(19970515)37:4<358::AID-JEMT10>3.0.CO;2-L. [DOI] [PubMed] [Google Scholar]
- 38.Deng Y, Wu S, Zhou H, Bi X, Wang Y, Hu Y, Gu P, Fan X. Effects of a miR-31, Runx2, and Satb2 regulatory loop on the osteogenic differentiation of bone mesenchymal stem cells. Stem Cells Dev. 2013;22:2278–2286. doi: 10.1089/scd.2012.0686. [DOI] [PubMed] [Google Scholar]
- 39.Baglìo SR, Devescovi V, Granchi D, Baldini N. MicroRNA expression profiling of human bone marrow mesenchymal stem cells during osteogenic differentiation reveals Osterix regulation by miR-31. Gene. 2013;527:321–331. doi: 10.1016/j.gene.2013.06.021. [DOI] [PubMed] [Google Scholar]
- 40.Sun F, Wang J, Pan Q, Yu Y, Zhang Y, Wan Y, Wang J, Li X, Hong A. Characterization of function and regulation of miR-24-1 and miR-31. Biochem Biophys Res Commun. 2009;380:660–665. doi: 10.1016/j.bbrc.2009.01.161. [DOI] [PubMed] [Google Scholar]
- 41.Gao J, Yang T, Han J, Yan K, Qiu X, Zhou Y, Fan Q, Ma B. MicroRNA expression during osteogenic differentiation of human multipotent mesenchymal stromal cells from bone marrow. J Cell Biochem. 2011;112:1844–1856. doi: 10.1002/jcb.23106. [DOI] [PubMed] [Google Scholar]
- 42.Vimalraj S, Selvamurugan N. MicroRNAs expression and their regulatory networks during mesenchymal stem cells differentiation toward osteoblasts. Int J Bio Macromol. 2014;66:194–202. doi: 10.1016/j.ijbiomac.2014.02.030. [DOI] [PubMed] [Google Scholar]


