Abstract
Keloids are abnormally raised fibroproliferative lesions that usually occur following cutaneous traumas. Recently, a large-scale genome-wide association study (GWAS) has identified multiple single nucleotide polymorphisms (SNPs) in three genetic loci that are associated with keloids in Japanese population. Subsequently, two reported loci 1q41 (rs873549 and rs1442440) and 15q21.3 (rs2271289) for keloids were confirmed in selected Chinese population. The association of these SNPs with clinical features of keloids, has not yet been studied. To explore the role of these SNPs in the pathogenesis of keloids, we performed a case-controlled study in another independent Chinese Han population to analyze the correlation between 4 SNPs (rs873549, rs2118610, rs1511412, rs2271289) and keloids phenotypes. 309 keloids patients and 1080 control subjects were included. The results showed that, in the dominant mode of inheritance, the minor allele T of SNP rs2271289 had significantly higher odd ratios (ORs) in the severe keloid group compared with both the controls and the mild keloid group. The ORs were maintained after Bonferroni’s correction (OR: 4.09, 95% CI: 1.78-9.37, P-value 3.25E-04). The ratio of the severe: mild OR for rs2271289 (dominant model) is (4.73/1.84=2.57). Similar associations in SNP rs2271289 were seen for groups with no family history and multiplesite compared with the control groups. No associations between keloid number, family history or severity relative to the controls were observed for the other three SNPs. Our data support that rs2271289 is strongly associated with severe keloids and might contribute to the complexity of clinical features of keloids.
Keywords: Keloids, NEDD4, SNP rs2271289, association study
Introduction
Keloids are defined as a scar growing continuously and invasively beyond the confines of the original wound. Pathologically, keloids arecharacterized by excessive fibroblast proliferation and deposition of extracellular matrix and collagen fibers [1]. Keloids can be familial and occur more commonly in ethnic groups with darker skin [2,3]. The highest incidence of keloids is found in the black population, which affects approximately 4-6% and up to 16% of black Africans [4]. The etiology and mechanism of keloids formation is currently largely unknown [5,6]. However, the increased familial aggregation, a higher prevalence in certain races, parallelism in identical twins, as well as alterations in gene expression, support an obvious contribution of genetic risk factors to development of keloids [7].
Previous studies of linkage analyses have indicated that keloids are autosomal recessive [8]. The susceptibility lociof keloids have been localized to chromosomes 7p11, 2q23, and 18q21.1 in African-American, Japanese, and Chinese ethnic origins, respectively for several years [9,10]. However, the results of multiple keloids genetic studies have not yet identified a single gene that is responsible for keloids pathogenesis. In 2010, Nakashima et al. performed a multistage genome wide association study of keloids in a Japanese population and identified 4candidate single nucleotide polymorphisms (SNPs): rs873549, rs2118610, rs1511412 and rs2271289 [11]. These SNPs are in 3 new chromosomal regions. Two of the reported loci, 1q41 and 15q21.3, were confirmed by a subsequent replication study of keloids in selected Chinese population [12]. Nonetheless, whether these SNPs associate with clinical features of keloids has not yet been studied. To explore the role of these SNPs in keloids, we carried out a case control study in an independent Chinese populationto assess the association between all 4 SNPs with keloids phenotypes, so as to provide evidence of the susceptibility locus in keloids pathogenesis.
Materials and methods
Patients and control subjects
A total of 309 patients with keloids and 1080 control subjects were consecutively recruited from the outpatients at the Department of Dermatology, Anhui Provincial Hospital. All patients were carefully examined by dermatologists in the outpatient clinic, and patients with a hypertrophic scar and some syndromes of keloids (e.g., Rubinstein-Taybi syndrome) were excluded from our study. The diagnosis was made clinically based on the criterion that the scars escaped the boundaries of the original wound and continue to grow over time. These scars did not regress spontaneously following excision and have been present for a minimum of one year. Controls were healthy individuals without autoimmune and systemic disorders and no family history of keloids (including first-, second- and third-degree relatives). All patients and controls were recruited using uniform criteria, and their clinical and demographic information was collected using the same questionnaire. After written informed consent was obtained, peripheral blood samples were collected from all patients and age- and gender-matched healthy control subjects. The study was approved by the Ethical Committee of the Anhui Provincial Hospital and was performed according to the Declaration of Helsinki Principles.
Definitions
Patients were categorized as the following: keloid number (multiple vs single), according to the study published by Bayat et al. [3]. Keloid severity was classified as previously described: mild-moderate (≤10 points) or severe (>10 points) [13]. Family history was considered positive if the patient’s first-, second-, and/or third-degree relatives had keloids. Otherwise, the family history would be considered negative.
Genomic DNA extraction and SNP genotyping
Genomic DNA was isolated from peripheral blood samples of the patients’ as well as 1080 healthy controls using a Qiagen kit (Hilden, Germany). Only SNPs in keloids-related genes with minor allele frequencies >0.05 in Chinese were selected from the HapMap database. The SNPs effect size in the references, the minor allele frequencies of Chinese, and the sample size were used to calculate the power for detection of a positive association. SNPs with the power less than 0.20 were excluded from this study. Four SNPs, rs873549, rs2118610, rs1511412 and rs2271289, meet the selection criteria and were genotyped using the SequenomiPlex platform.
Statistical analysis
The clinical characteristics of the study groups were analyzed using proportions or mean and standard deviation (SD). Hardy Weinberg equilibrium tests of the genotyping data were performed using PLINK (version 1.07). The power of the study population was estimated using a web-based power calculator program for genome-wide association studies (http://www.sph.umich.edu/csg/abecasis/CaTS/). Forallelic association between a SNP and keloids, the p-value and corresponding odds ratio (OR) with a 95% confidence interval were computed using Chi-square tests and Pearson’s 2×2 contingency tables as implemented in PLINK version 1.07. For the stratified analysis, differences between the cases and controls in terms of the genotype frequency were tested using the Chi Squared test and by calculating the odds ratios (ORs) and 95% confidence intervals (CIs).
Results
Subject characteristics
In this study, 309 cases and 1080 controls are unrelated genetically and matched for ethnicity, culture and geographical locations. The mean (SD) age of controls and cases was 29.38±8.63 and 28.72±12.78 years respectively. A slightly higher proportion of males than females were present in case group due to the properties of keloids (Table 1).
Table 1.
Description of the studied populations
| Case | Control | |
|---|---|---|
| Number | 309 | 1080 |
| Age, year, mean ± SD | 28.72±12.78 | 29.38±8.63 |
| Gender (male/female) | 115/194 | 462/618 |
Abbreviations: SD, stand error.
Associations between keloid number, family-history or severity and single-nucleotide polymorphisms
We used a case-controlled population to determine whether SNP rs873549, rs2118610, rs1511412 and rs2271289 are associated with keloids in a Chinese population.Sequenomi Plexplatform was used to genotype these four SNPs. The results of each of the genotyping cluster are acceptable and Figure 1 shows representative cluster of SNP rs2271289. The primers that were designed for sequencing of the SNPs are shown in Table 2. The allele distribution and minor allele frequency of SNP rs873549, rs2118610, rs1511412 and rs2271289 for the patients and controls in this study are shown in Figure 2. The genotypes of all the four SNPs in the controls were consistent with Hardy-Weinberg equilibrium. We also confirmed that SNP rs873549, which we used as a control SNP, is significantly associated with keloid as previously reported by several studies. The power of study population for each SNPs was estimated (data not shown).
Figure 1.
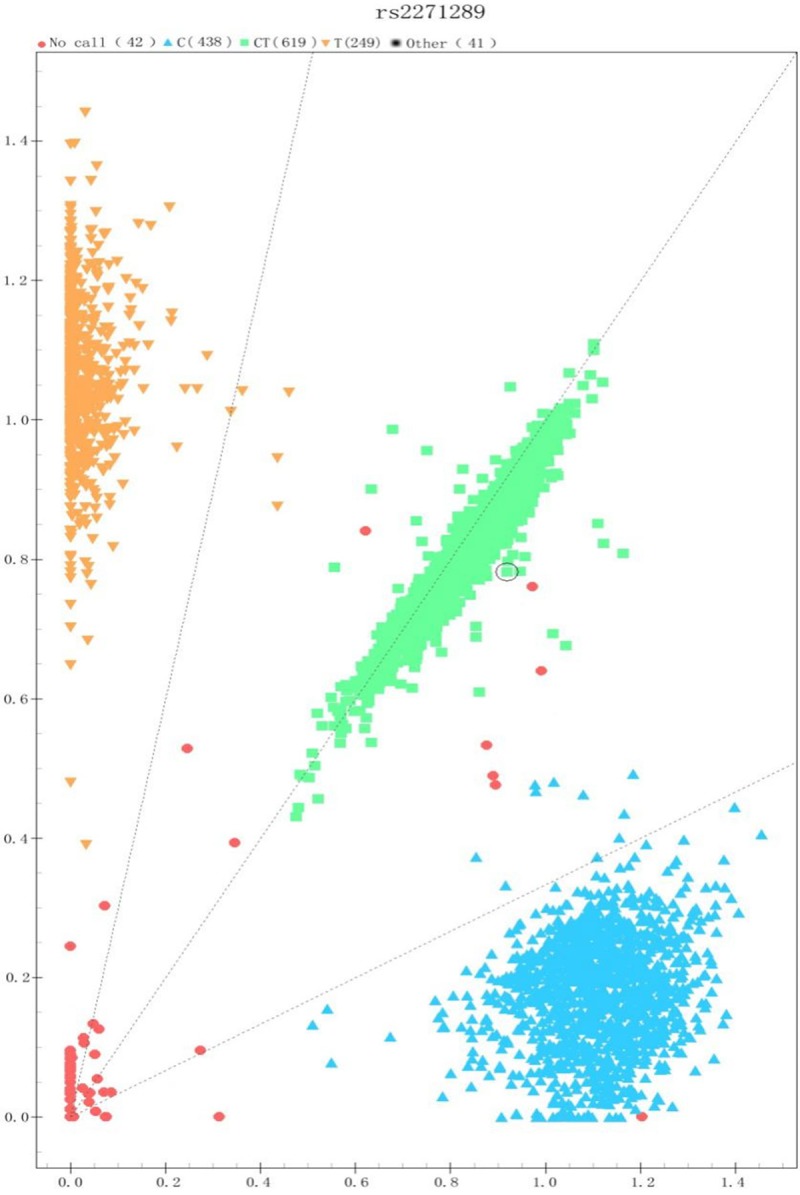
The genotyping cluster of rs2271289. The sample cluster of rs2271289 is obviously divided into three group, and the call rate value is more than 99 percent.
Table 2.
Primer sequences of amplification and extension
| SNP | Amplification primer sequences | Primer sequences of extension |
|---|---|---|
| rs873549 | 1) ACGTTGGATGCCAATTAAGGGCATAGACAC | ttAAAGTGCAACAGCATATTA |
| 2) ACGTTGGATGGCCTTAGCTGTTGGCTATTC | ||
| rs1511412 | 1) ACGTTGGATGAGACTCAGATGAGACACCAC | TCAACTGCATCATCTGGC |
| 2) ACGTTGGATGTCCTCACACTTTTCAACTGC | ||
| rs2118610 | 1) ACGTTGGATGTCTTCTCGCTCCCGTTTCAC | GCTGGGAAGGACACACACCA |
| 2) ACGTTGGATGATTCTAGCTGGGAAGGACAC | ||
| rs2271289 | 1) ACGTTGGATGGAAATATGAAGTAAGGGTACA | ctACTTCCCCTGGCTGCTC |
| 2) ACGTTGGATGCAAATCCCAGACTGCTTACC |
Figure 2.
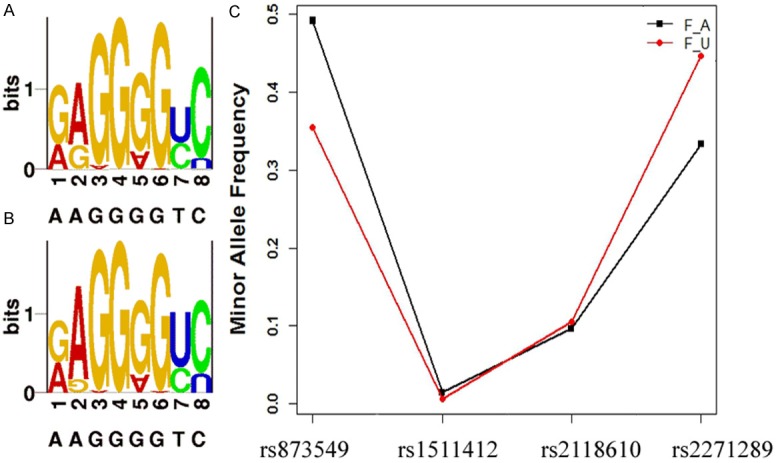
Allele distribution and minor allele frequency of 4 SNPs in the study patients and controls. A and B are SNP LOGO of 309 blood-unrelated Chinese patients and 1080 healthy controls respectively. (1, 3, 5, 7, 9 shows the minor allele proportion of four SNPs, and 2, 4, 6, 8, 10 shows the major one). C. Minor allele frequency of five SNPs in patients (F_A) and controls (F_U).
Using stratified analysis, we further analyzed association between clinical severity with keloids in above four SNPs. Assessment of rs2271289 revealed that in the dominant mode of inheritance, the severe keloid group had significant ORs compared with both the controls and the mild keloids group. The ORs were maintained after Bonferroni’s correction (OR: 4.09, 95% CI: 1.78-9.37, P-value 3.25E-04). The ratio of the severe: mild OR for rs2271289 (dominant model) is (4.73/1.84=2.57), Similar associations in SNP rs2271289 were seen for groups with no family history and multiplesite compared with the control groups. Associations between keloid number, family-history or severity relative to the controls were not observed for the other three SNPs (Tables 3, 4 and 5).
Table 3.
Associations between single-nucleotide polymorphisms and keloid susceptibility in the Chinese population relative to the controls
| SNP | Allele (risk) | Mode | Odds ratio (95% CI) | P-value | Power |
|---|---|---|---|---|---|
| 1) Mild-moderate keloid vs control | |||||
| rs873549 | A/G (G) | Dominant | 3.415 (1.826-6.385) | 4.40E-05 | 100 |
| Recessive | 3.159 (1.887-5.287) | 4.03E-06 | 100 | ||
| Allele | 2.428 (1.728-3.414) | 1.38E-07 | 100 | ||
| rs1511412 | G/A (A) | Dominant | 1.108 (1.151-8.134) | 0.92 | 5 |
| Recessive | NaN | NaN | NaN | ||
| Allele | 1.107 (0.1519-8.068) | 0.9201 | 5 | ||
| rs2118610 | A/G (G) | Dominant | Inf | 1 | NaN |
| Recessive | 1.04 (0.565-1.913) | 0.9 | 7 | ||
| Allele | 1.111 (0.624-1.976) | 0.7211 | 12 | ||
| rs2271289 | T/C (C) | Dominant | 1.713 (0.596-4.927) | 0.312 | 100 |
| Recessive | 1.088 (0.507-02.333) | 0.829 | 16 | ||
| Allele | 1.212 (0.721-2.036) | 0.4679 | 45 | ||
| 2) Severe keloids vs control | |||||
| rs873549 | A/G (G) | Dominant | 1.447 (1.096-1.909) | 9.00E-03 | 99 |
| Recessive | 2.482 (1.836-3.357) | 1.17E-09 | 100 | ||
| Allele | 1.599 (1.327-1.925) | 6.33E-07 | 100 | ||
| rs1511412 | G/A (A) | Dominant | 2.581 (1.211-5.504) | 0.011 | 91 |
| Recessive | NaN | NaN | NaN | ||
| Allele | 2.554 (1.205-5.414) | 0.01119 | 29 | ||
| rs2118610 | A/G (G) | Dominant | 1.532 (0.37-6.34) | 0.553 | 18 |
| Recessive | 1.084 (0.774-1.518) | 0.64 | 12 | ||
| Allele | 1.097 (0.803-1.5) | 0.5606 | 11 | ||
| rs2271289 | T/C (C) | Dominant | 4.085 (1.781-9.372) | 3.25E-04 | 100 |
| Recessive | 1.67 (1.114-2.504) | 1.20E-02 | 100 | ||
| Allele | 1.7718 (1.3063-2.4033) | 0.0001953 | 100 | ||
Abbreviations: CI, confidence interval; SNP, single-nucleotide polymorphism.
Table 4.
Associations between single-nucleotide polymorphisms and keloid susceptibility in the Chinese population relative to the controls
| SNP | Allele (risk) | Mode | Odds ratio (95% CI) | P-value | Power |
|---|---|---|---|---|---|
| 1) Family-history keloid vs control | |||||
| rs873549 | A/G (G) | Dominant | 1.536 (0.922-2.559) | 0.097 | 100 |
| Recessive | 1.875 (1.05-3.348) | 0.031 | 100 | ||
| Allele | 1.48 (1.055-2.079) | 0.02255 | 100 | ||
| rs1511412 | G/A (A) | Dominant | 2.215 (0.528-9.288) | 0.24 | 73 |
| Recessive | NA | NA | NA | ||
| Allele | 2.198 (0.5296-9.118) | 0.2659 | 37 | ||
| rs2118610 | A/G (G) | Dominant | 0.883 (0.12-6.489) | 0.594 | 6 |
| Recessive | 1.296 (0.677-2.481) | 0.433 | 68 | ||
| Allele | 1.2324 (0.6789-2.238) | 0.4915 | 34 | ||
| rs2271289 | T/C (C) | Dominant | 2.548 (0.773-8.391) | 0.111 | 100 |
| Recessive | 1.919 (0.954-3.86) | 0.063 | 100 | ||
| Allele | 1.777 (1.045-3.022) | 0.03152 | 100 | ||
| 2) No-family-history keloid vs control | |||||
| rs873549 | A/G (G) | Dominant | 1.761 (1.321-2.347) | 9.45E-05 | 100 |
| Recessive | 2.869 (2.14-3.847) | 2.39E-13 | 100 | ||
| Allele | 1.844 (1.532-2.221) | 5.91E-11 | 100 | ||
| rs1511412 | G/A (A) | Dominant | 2.259 (1.014-5.033) | 0.041 | 76 |
| Recessive | NA | NA | NA | ||
| Allele | 2.24 (1.001-4.963) | 0.04129 | 40 | ||
| rs2118610 | A/G (G) | Dominant | 3.065 (0.421-22.293) | 0.365 | 71 |
| Recessive | 1.02 (0.732-1.422) | 0.905 | 6 | ||
| Allele | 1.0664 (0.7825-1.4539) | 0.6843 | 8 | ||
| rs2271289 | T/C (C) | Dominant | 3.388 (1.562-7.349) | 0.001 | 100 |
| Recessive | 1.401 (0.925-2.122) | 0.11 | 98 | ||
| Allele | 1.5667 (1.1589-2.1178) | 0.003274 | 100 | ||
Abbreviations: CI, confidence interval; SNP, single-nucleotide polymorphism.
Table 5.
Associations between single-nucleotide polymorphisms and keloid susceptibility in the Chinese population relative to the controls
| SNP | Allele (risk) | Mode | Odds ratio (95% CI) | P-value | Power |
|---|---|---|---|---|---|
| 1) Multiple keloids vs controls | |||||
| rs873549 | A/G (G) | Dominant | 2.033 (1.376-3.006) | 2.84E-04 | 100 |
| Recessive | 2.479 (1.673-3.675) | 3.06E-06 | 100 | ||
| Allele | 1.841 (1.442-2.35) | 6.66E-07 | 100 | ||
| rs1511412 | G/A (A) | Dominant | 2.854 (1.121-7.271) | 0.021 | 97 |
| Recessive | NA | NA | NA | ||
| Allele | 2.819 (1.116-7.122) | 0.02195 | 70 | ||
| rs2118610 | A/G (G) | Dominant | 1.74 (0.239-12.697) | 1 | 32 |
| Recessive | 1.137 (0.726-1.78) | 0.575 | 24 | ||
| Allele | 1.1504 (0.7576-1.747) | 0.511 | 19 | ||
| rs2271289 | T/C (C) | Dominant | 3.795 (1.526-9.436) | 0.002 | 100 |
| Recessive | 1.632 (1.032-2.579) | 0.035 | 100 | ||
| Allele | 1.731 (1.2284-2.439) | 0.001515 | 100 | ||
| 2) Single keloids vs controls | |||||
| rs873549 | A/G (G) | Dominant | 1.463 (1.056-2.028) | 0.021 | 99 |
| Recessive | 2.655 (1.877-3.757) | 1.11E-08 | 100 | ||
| Allele | 1.651 (1.327-2.053) | 5.39E-06 | 100 | ||
| rs1511412 | G/A (A) | Dominant | 1.349 (0.417-4.369) | 0.494 | 12 |
| Recessive | NA | NA | NA | ||
| Allele | 1.346 (0.418-4.336) | 0.617 | 7 | ||
| rs2118610 | A/G (G) | Dominant | 2.169 (0.298-15.802) | 0.723 | 49 |
| Recessive | 1.044 (0.705-1.548) | 0.828 | 7 | ||
| Allele | 1.0778185 (0.7468-1.555) | 0.6888 | 9 | ||
| rs2271289 | T/C (C) | Dominant | 2.477 (0.981-6.256) | 0.047 | 100 |
| Recessive | 1.36 (0.773-2.39) | 0.284 | 95 | ||
| Allele | 1.4626 (0.9756-2.1925) | 0.06402 | 99 | ||
Abbreviations: CI, confidence interval; SNP, single-nucleotide polymorphism.
Microscope and histopathological examination
All the patients diagnosed as keloids show typical fibroplasia in the corium layer. Illustrated is one of the representative sporadic patient showing wounded chest, the scars escaped the boundaries of the original wound and continue to grow two years, belong to groups withmultiplesite and mild keloid (Figure 3A), Biopsy of a patient revealed thick, hyalinised collagen fibres are characteristic of this aberrant healing process (Figure 3B). The corium layer of one normal control is shown in Figure 3C. The images were visualized using hematoxylin and eosin (H&E) staining and are shown at either 40× or 10× magnifications. The image on the left is an enlarged version of the boxed area on the right.
Figure 3.
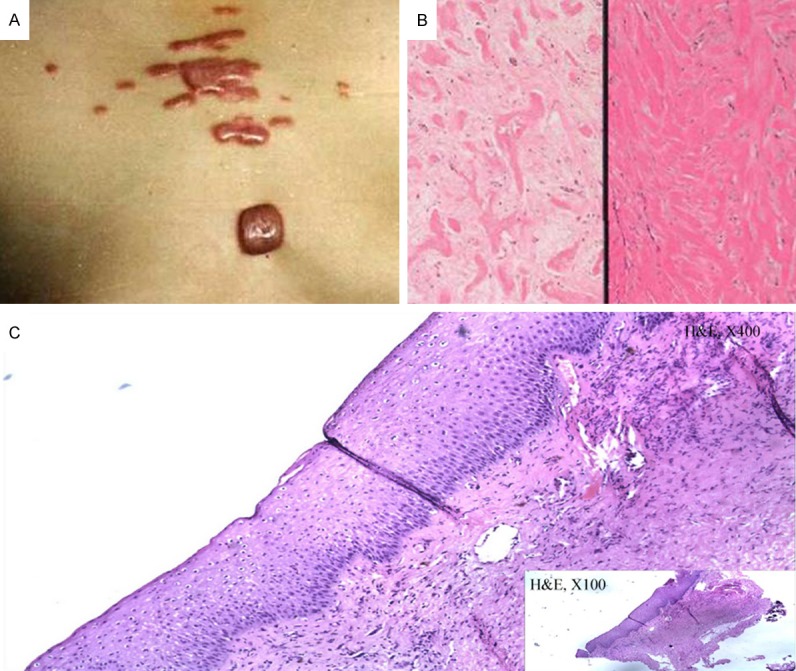
Photograph of one sporadic case and Biopsy of one patient and one control sample. A. This picture shows the chest of one of the sporadic cases. B. Biopsy of a patient revealed a typical fibroplasia in the corium layer. C. Biopsy of one control sample shows the normal corium layer.
Discussion
Genome-wide association study (GWAS) has been used to examine the association between common genetic variants, especially SNPs with complex disorders for more than a decade. With the development of this technique, the genetic basis of keloids has developed rapidly in recent years. Multiple susceptibility locicontaining SNPs that are associated with keloids have been recognized. In our current case-control study, we analyzed four SNPs that are from susceptibility loci for keloids. We did not observe significant association between SNP rs2118610 and keloids in Chinese Han population. However, SNP rs873549 and rs2271289 showed a significant association with keloids and the positive association remains significant after the Bonferroni correction. SNP rs1511412 did not show association with keloids susceptibility after Bonferroni correction. Meanwhile, we analyzed the power of these SNPs and found that the power of SNP rs1511412 was not big enough, whereas SNPsrs873549 and rs2271289 showed much higher power, and are strongly associated with keloids susceptibility. Additionally, stratified analysis of rs2271289 revealed that in the dominant mode of inheritance (C/T+C/C compared with T/T), the severe keloids group had significant ORs compared with both the controls and mild-moderate keloids groups. Similar associations in SNP rs2271289 were seen for groups with no family history and multiplesite compared with the control groups. These results demonstrated that rs2271289 is associated strongly with different phenotypes of keloids.
SNP rs2271289 was located in the intron region between exon5 and exon6 of NEDD4. This gene is highly expressed in the skin, skeletal muscle, liver, bladder, placenta and cancer cell lines [14]. The NEDD4 protein has a modular structure that is shared among the NEDD4 family, consisting of an amino-terminal C2 calcium-dependent phospholipid binding domain, 3-4 WW protein-protein interaction domains, and a carboxyl-terminal catalytic HECT ubiquitin ligase domain [15-17]. 3D structure of C2 domainand HECT domain were constructed by Swiss-PdbViewer [18] (Figure 4). It was previously shown that the C2 domain binds to the HECT domain to create an inhibitory conformation of the protein and to regulate NEDD4 activity [19]. Through pathway annotation analysis using KOBAS 2.0 [20], we found that NEDD4 is strongly associated with down regulation of ErbB4 signaling pathway both in database Reactome (http://www.reactome.org/, Figure 5) and PID respectively (Table 6). In vivo, by binds ERBB4 JM-A CYT-1 s80 (ERBB4-jmAcyt1s80) through its PIK3R1 interaction site, NEDD4 mediates ERBB4jmAcyt1s80 ubiquitination, then decreasing the amount of ERBB4jmAcyt1s80 that reaches the nucleus [21], and finally down regulates this signal.
Figure 4.
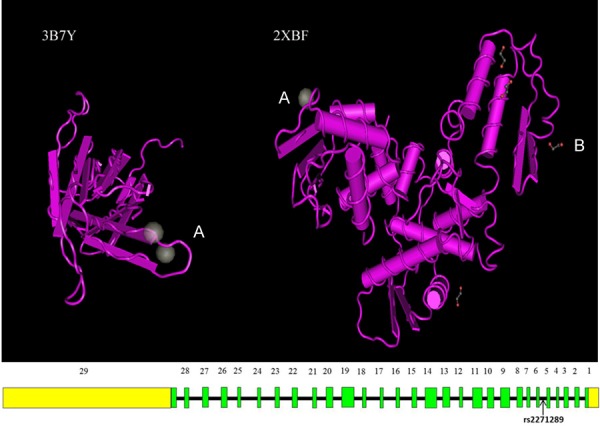
Structure of neural precursor cell expressed, developmentally down-regulated 4, E3 ubiquitin protein ligase. Fragment 3B7Y contain C2 domain, and fragment 2XBF containHECT domain. SNP rs2271289 is located between exon5 and exon6 of gene NEDD4 which is included in fragment 3B7Y. A: Calcium Ion, B: Ethylene Glycol.
Figure 5.
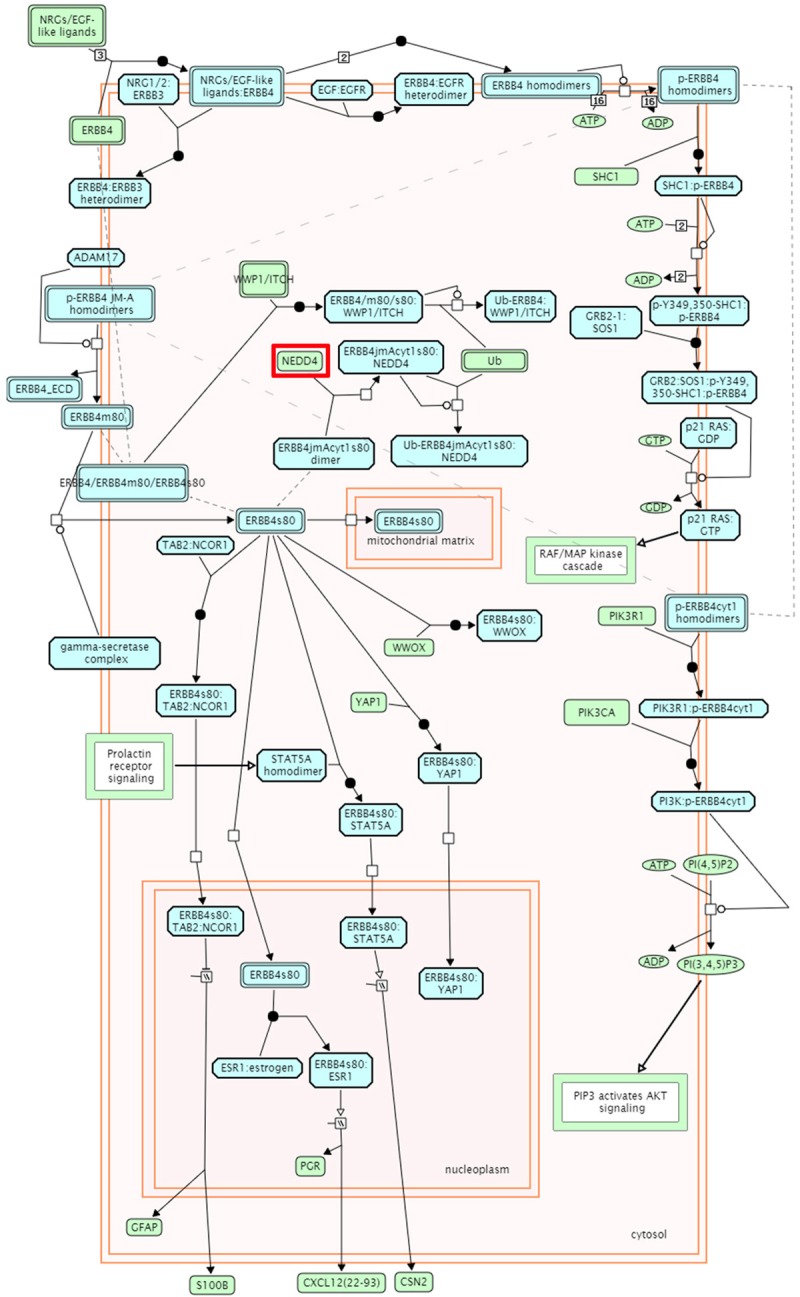
ErbB4 signal pathway. WW-domain binding motifs in the C-tail of ERBB4 play an important role in the downregulation of ERBB4 receptor signaling, enabling the interaction of intact ERBB4, ERBB4 m80 and ERBB4 s80 with NEDD4 family of E3 ubiquitin ligases WWP1 and ITCH. The interaction of WWP1 and ITCH with intact ERBB4 is independent of receptor activation and autophosphorylation. Binding of WWP1 and ITCH ubiquitin ligases leads to ubiquitination of ERBB4 and its cleavage products, and subsequent degradation through both proteasomal and lysosomal routes [25,26]. In addition, the s80 cleavage product of ERBB4 JM-A CYT-1 isoform is the target of NEDD4 ubiquitin ligase. NEDD4 binds ERBB4 JM-A CYT-1 s80 (ERBB4jmAcyt1s80) through its PIK3R1 interaction site and mediates ERBB4jmAcyt1s80 ubiquitination, thereby decreasing the amount of ERBB4jmAcyt1s80 that reaches the nucleus [21].
Table 6.
Pathway identification result annotation by KOBAS
| Term | Database | ID | P-Value |
|---|---|---|---|
| Downregulation of ErbB4 signaling | Reactome | REACT_115828 | 0.00107219 |
| Antiviral mechanism by IFN-stimulated genes | Reactome | REACT_115676 | 0.009080363 |
| ISG15 antiviral mechanism | Reactome | REACT_115831 | 0.009080363 |
| ErbB4 signaling events | PID | erbb4_pathway | 0.0123517 |
| Ubiquitin mediated proteolysis | KEGG PATHWAY | hsa04120 | 0.016877622 |
| Presenilin action in Notch and Wnt signaling | PID | ps1pathway | 0.017560936 |
| Signaling by ERBB4 | Reactome | REACT_115596 | 0.018349439 |
| Epstein-Barr virus infection | KEGG PATHWAY | hsa05169 | 0.024760998 |
| Interferon Signaling | Reactome | REACT_25229 | 0.025314945 |
| Signaling events mediated by VEGFR1 and VEGFR2 | PID | vegfr1_2_pathway | 0.025709817 |
| Endocytosis | KEGG PATHWAY | hsa04144 | 0.026090925 |
| Antigen processing: Ubiquitination & Proteasome degradation | Reactome | REACT_75842 | 0.028323707 |
| Class I MHC mediated antigen processing & presentation | Reactome | REACT_75820 | 0.034186008 |
| Cytokine Signaling in Immune system | Reactome | REACT_75790 | 0.03962846 |
| Adaptive Immune System | Reactome | REACT_75774 | 0.078446738 |
| Immune System | Reactome | REACT_6900 | 0.144650849 |
| Signal Transduction | Reactome | REACT_111102 | 0.24090275 |
Databases: BioCarta, Gene Ontology, GAD, FunDO, KEGG PATHWAY, OMIM, PID, PANTHER, Reactome, BioCyc, NHGRI GWAS Catalog, KEGG DISEASE. Statistical test method: hypergeometric test/Fisher’s exact test.
The ErbB protein family or epidermal growth factor receptor (EGFR) family is a family of four structurally related receptor tyrosine kinases. Insufficient ErbB signaling in humans is associated with the development of neurodegenerative diseases, while in micedeficiency of ErbBresults in embryonic lethality with defects in organs of lungs, skin, heart and brain. On the other hand, excessive ErbB signaling in mice is associated with development of multiplesolid tumors [22]. Thus, rs2271289 may influence the auto-inhibition of NEDD4 protein, and reduce the efficiency of down regulation of ErbB4 signaling, leading to excessive fibroblast proliferation. This may partially explain why rs2271289 is significantly associated with more severe keloids, although further studies are needed to explore its precise role in keloids development.
In addition, previous studies have demonstrated that NEDD4 plays a critical role in contact inhibition. NEDD4 has been suggested to negatively regulate TGF-β signaling via ubiquitin-mediated degradation of SMAD4 [14], whereas, TGF-β is known to promote type I collagen synthesis and inhibit the transcription of collagenase [23]. As keloids may be the result of abnormal and pathological wound healing that involves above signaling pathway, pharmaceutical intervention targeting this pathway, in addition to corticosteroids or radiation therapy after surgery, may help the prevention and treatment of keloids [24].
In conclusion, stratified analysis showed that genetic factors, specifically NEDD4 single nucleotide polymorphism rs2271289, contribute to keloids phenotypes, i.e. the severity of keloids. SNP rs2271289 may serve as a biomarker that helps with the prevention, prognosis and targeted therapy for keloids.
Acknowledgements
We are most grateful to all the members who have so willingly participated in this study, which made this study possible. This work was funded by the National Natural Youth Science Foundation (81101185) and the Anhui Provincial Natural Science Foundation (1608085MH176).
Disclosure of conflict of interest
None.
References
- 1.Marneros AG, Krieg T. Keloids--clinical diagnosis, pathogenesis, and treatment options. J Dtsch Dermatol Ges. 2004;2:905–913. doi: 10.1046/j.1439-0353.2004.04077.x. [DOI] [PubMed] [Google Scholar]
- 2.Bayat A, Arscott G, Ollier WE, Ferguson MW, Mc Grouther DA. Description of site-specific morphology of keloid phenotypes in an Afrocaribbean population. Br J Plast Surg. 2004;57:122–133. doi: 10.1016/j.bjps.2003.11.009. [DOI] [PubMed] [Google Scholar]
- 3.Bayat A, Arscott G, Ollier WE, McGrouther DA, Ferguson MW. Keloid disease: clinical relevance of single versus multiple site scars. Br J Plast Surg. 2005;58:28–37. doi: 10.1016/j.bjps.2004.04.024. [DOI] [PubMed] [Google Scholar]
- 4.Bloom D. Heredity of keloids; review of the literature and report of a family with multiple keloids in five generations. N Y State J Med. 1956;56:511–519. [PubMed] [Google Scholar]
- 5.Ehrlich HP, Desmouliere A, Diegelmann RF, Cohen IK, Compton CC, Garner WL, Kapanci Y, Gabbiani G. Morphological and immunochemical differences between keloid and hypertrophic scar. Am J Pathol. 1994;145:105–113. [PMC free article] [PubMed] [Google Scholar]
- 6.Rossiello L, D’Andrea F, Grella R, Signoriello G, Abbondanza C, De Rosa C, Prudente M, Morlando M, Rossiello R. Differential expression of cyclooxygenases in hypertrophic scar and keloid tissues. Wound Repair Regen. 2009;17:750–757. doi: 10.1111/j.1524-475X.2009.00530.x. [DOI] [PubMed] [Google Scholar]
- 7.Halim AS, Emami A, Salahshourifar I, Kannan TP. Keloid scarring: understanding the genetic basis, advances, and prospects. Arch Plast Surg. 2012;39:184–189. doi: 10.5999/aps.2012.39.3.184. [DOI] [PMC free article] [PubMed] [Google Scholar]
- 8.Omo-Dare P. Genetic studies on keloid. J Natl Med Assoc. 1975;67:428–432. [PMC free article] [PubMed] [Google Scholar]
- 9.Yan X, Gao JH, Chen Y, Song M, Liu XJ. [Preliminary linkage analysis and mapping of keloid susceptibility locus in a Chinese pedigree] . Zhonghua Zheng Xing Wai Ke Za Zhi. 2007;23:32–35. [PubMed] [Google Scholar]
- 10.Marneros AG, Norris JE, Watanabe S, Reichenberger E, Olsen BR. Genome scans provide evidence for keloid susceptibility loci on chromosomes 2q23 and 7p11. J Invest Dermatol. 2004;122:1126–1132. doi: 10.1111/j.0022-202X.2004.22327.x. [DOI] [PubMed] [Google Scholar]
- 11.Nakashima M, Chung S, Takahashi A, Kamatani N, Kawaguchi T, Tsunoda T, Hosono N, Kubo M, Nakamura Y, Zembutsu H. A genome-wide association study identifies four susceptibility loci for keloid in the Japanese population. Nat Genet. 2010;42:768–771. doi: 10.1038/ng.645. [DOI] [PubMed] [Google Scholar]
- 12.Zhu F, Wu B, Li P, Wang J, Tang H, Liu Y, Zuo X, Cheng H, Ding Y, Wang W, Zhai Y, Qian F, Yuan X, Ha W, Hou J, Zhou F, Wang Y, Gao J, Sheng Y, Sun L, Liu J, Yang S, Zhang X. Association study confirmed susceptibility loci with keloid in the Chinese Han population. PLoS One. 2013;8:e62377. doi: 10.1371/journal.pone.0062377. [DOI] [PMC free article] [PubMed] [Google Scholar]
- 13.Idriss N, Maibach HI. Scar assessment scales: a dermatologic overview. Skin Res Technol. 2009;15:1–5. doi: 10.1111/j.1600-0846.2008.00327.x. [DOI] [PubMed] [Google Scholar]
- 14.Anan T, Nagata Y, Koga H, Honda Y, Yabuki N, Miyamoto C, Kuwano A, Matsuda I, Endo F, Saya H, Nakao M. Human ubiquitin-protein ligase Nedd4: expression, subcellular localization and selective interaction with ubiquitinconjugating enzymes. Genes Cells. 1998;3:751–763. doi: 10.1046/j.1365-2443.1998.00227.x. [DOI] [PubMed] [Google Scholar]
- 15.Harvey KF, Kumar S. Nedd4-like proteins: an emerging family of ubiquitin-protein ligases implicated in diverse cellular functions. Trends Cell Biol. 1999;9:166–169. doi: 10.1016/s0962-8924(99)01541-x. [DOI] [PubMed] [Google Scholar]
- 16.Chung S, Nakashima M, Zembutsu H, Nakamura Y. Possible involvement of NEDD4 in keloid formation; its critical role in fibroblast proliferation and collagen production. Proc Jpn Acad Ser B Phys Biol Sci. 2011;87:563–573. doi: 10.2183/pjab.87.563. [DOI] [PMC free article] [PubMed] [Google Scholar]
- 17.Kumar S, Harvey KF, Kinoshita M, Copeland NG, Noda M, Jenkins NA. cDNA cloning, expression analysis, and mapping of the mouse Nedd4 gene. Genomics. 1997;40:435–443. doi: 10.1006/geno.1996.4582. [DOI] [PubMed] [Google Scholar]
- 18.Guex N, Peitsch MC. SWISS-MODEL and the Swiss-PdbViewer: an environment for comparative protein modeling. Electrophoresis. 1997;18:2714–2723. doi: 10.1002/elps.1150181505. [DOI] [PubMed] [Google Scholar]
- 19.Wang J, Peng Q, Lin Q, Childress C, Carey D, Yang W. Calcium activates Nedd4 E3 ubiquitin ligases by releasing the C2 domain-mediated auto-inhibition. J Biol Chem. 2010;285:12279–12288. doi: 10.1074/jbc.M109.086405. [DOI] [PMC free article] [PubMed] [Google Scholar]
- 20.Xie C, Mao X, Huang J, Ding Y, Wu J, Dong S, Kong L, Gao G, Li CY, Wei L. KOBAS 2.0: a web server for annotation and identification of enriched pathways and diseases. Nucleic Acids Res. 2011;39:W316–322. doi: 10.1093/nar/gkr483. [DOI] [PMC free article] [PubMed] [Google Scholar]
- 21.Zeng F, Xu J, Harris RC. Nedd4 mediates ErbB4 JM-a/CYT-1 ICD ubiquitination and degradation in MDCK II cells. FASEB J. 2009;23:1935–1945. doi: 10.1096/fj.08-121947. [DOI] [PMC free article] [PubMed] [Google Scholar]
- 22.Marmor MD, Skaria KB, Yarden Y. Signal transduction and oncogenesis by ErbB/HER receptors. Int J Radiat Oncol Biol Phys. 2004;58:903–913. doi: 10.1016/j.ijrobp.2003.06.002. [DOI] [PubMed] [Google Scholar]
- 23.Bettinger DA, Yager DR, Diegelmann RF, Cohen IK. The effect of TGF-beta on keloid fibroblast proliferation and collagen synthesis. Plast Reconstr Surg. 1996;98:827–833. doi: 10.1097/00006534-199610000-00012. [DOI] [PubMed] [Google Scholar]
- 24.Ogawa R. The most current algorithms for the treatment and prevention of hypertrophic scars and keloids. Plast Reconstr Surg. 2010;125:557–568. doi: 10.1097/PRS.0b013e3181c82dd5. [DOI] [PubMed] [Google Scholar]
- 25.Omerovic J, Santangelo L, Puggioni EM, Marrocco J, Dall’Armi C, Palumbo C, Belleudi F, Di Marcotullio L, Frati L, Torrisi MR, Cesareni G, Gulino A, Alimandi M. The E3 ligase Aip4/Itch ubiquitinates and targets ErbB-4 for degradation. FASEB J. 2007;21:2849–2862. doi: 10.1096/fj.06-7925com. [DOI] [PubMed] [Google Scholar]
- 26.Feng SM, Muraoka-Cook RS, Hunter D, Sandahl MA, Caskey LS, Miyazawa K, Atfi A, Earp HS 3rd. The E3 ubiquitin ligase WWP1 selectively targets HER4 and its proteolytically derived signaling isoforms for degradation. Mol Cell Biol. 2009;29:892–906. doi: 10.1128/MCB.00595-08. [DOI] [PMC free article] [PubMed] [Google Scholar]


