

Abstract
Activation of the PI3K/AKT/mTOR signaling pathway, a common mechanism in all subtypes of endometrial cancers (EC), plays an important role in the initiation and progression of many cancers. Inhibitors against various components of this pathway might promise a novel effective approach for targeted therapy for EC in the future. Intriguingly, two major members of this pathway, AKT1 and mTOR, were both reported to be the putative target genes of miR-99a, which were widely reported to function as a tumor suppressor in a variety of cancers. However, the direct role of miR-99a in endometrial cancer progression and the signaling pathways might been involved have never been deciphered. In this paper, we demonstrate that the expression of miR-99a was significantly suppressed in the EC tissues and was negatively correlated with the differentiation of tumors. Furthermore, we find that overexpression of miR-99a in EC cells induced a complex phenotype, namely an inhibition of cell proliferation, block of G1/S phase transition, induction of cell apoptosis, suppression of cell invasion, and inhibition of tumor growth in vivo, which was mediated, at least partially, through dual-suppression of PI3K/AKT/mTOR pathway. This finding not only helps us understand the molecular mechanism of endometrial carcinogenesis, but also gives us a strong rationale to further investigate miR-99a as a potential biomarker and therapeutic target for EC.
Keywords: microRNA, endometrial carcinoma, miR-99a, PI3K/AKT/mTOR signaling pathway
Introduction
Endometrial carcinoma (EC) is the fourth most often occurring malignancy in the female population of developed countries [1]. In 2014, there were about 5,2630 new cases and 8590 deaths due to this neoplasm in the United States [2]. Although Asian women have a lower risk of EC compared to those in the US and other western countries, the incidence of EC in China and in Japan has substantially increased [3,4]. Etiology of endometrial tumors has been connected with alteration of several genes. The most prominent molecular alteration in EC, demonstrated in 80% of tumors, is the dysregulation of the phosphatidylinositol 3-kinase/protein kinase B/mammalian Target of rapamycin (PI3K/AKT/mTOR) signaling pathway, which frequently manifests as an accumulation of defective activated AKT and mTOR protein [5].
The PI3K/AKT/mTOR signaling pathway is a major survival pathway [6]. It plays a cardinal role in the transduction of extracellular and intracellular signals that regulate cell growth, proliferation, survival, migration, and angiogenesis [7]. Activation of PI3K recruits AKT to the plasma membrane, allowing its activation, which in turn phosphorylates various intracellular proteins, such as the serine/threonine kinase mTOR, MMP-2, caspase-3 and so on [8,9]. Activation of PI3K/AKT/mTOR pathway has been widely investigated in the initiation and progression of many cancers, such as breast, bladder, colon and ovarian cancers [10-13]. For EC, its activation was reported to increase cancer initiation by increasing its chromosomal instability [14]. Moreover, it is also well known to cause drug resistance to chemotherapy [15]. Thus, inhibitors against various components of this pathway are at various stages of preclinical and clinical development for cancer treatment, especially the mTOR inhibitors including Rapamycin, Temsirolimus and Everolimus [16]. However, the therapeutic effectiveness was modest. One potential mechanism of resistance is that mTOR inhibitors would induce a subsequent activation of AKT through a negative feedback loop, which might weaken the former’s suppressive effects [17,18]. Thus, more and more hypothesis proposed that inhibition of AKT could potentiate the antitumor effect of mTOR inhibitors, and thus, combined targeting of mTOR and AKT could be an effective approach in treating patients with mTOR inhibitor-resistance. For example, Xu et al. found that combined inhibition of mTOR and AKT using pharmacon showed synergistic suppressive effects on the tumor growth of basal-like breast cancer patient-derived xenograft models [19]. Consistently, Mizoeva and colleagues also found that dual inhibition of PI3K and mTOR induces autophagy to a greater extent than inhibition of each target alone, and combined administration of PI3K/mTOR as well as autophagy inhibitors results in increased anti-tumor activity in vitro and in vivo in models of pancreatic adenocarcinoma [20]. Therefore, the discovery of dual inhibitors might promise a novel effective approach for targeted therapy against PI3K/AKT pathway in endometrial carcinoma.
Intriguingly, two major members of PI3K/AKT/mTOR signaling pathway, AKT1 and mTOR, were both reported to be the putative target genes of miR-99a, which is a kind of single-strand, non-coding RNA molecules. Through suppressing the expression of AKT1 and mTOR, miR-99a was reported to suppress the tumor metastasis of NSCLC cells in vivo, and inhibited proliferation and invasion of cervical cancer cells in vitro, respectively [21,22]. The fact that miRNAs bind to specific mRNAs, thereby blocking translation and increasing degradation which induced target gene suppression [23], makes us to speculate that miR-99a inhibition might, at least partially, mediate the overexpression of PI3K/AKT/mTOR signaling pathway through targeting AKT1 and mTOR in EC, and thereby induce the tumor initiation and progression.
Although a previous study has demonstrated the suppressive expression of miR-99a in EC tissues [24], its possible effects on the malignant phenotype of EC and its putative role in mediating activation of PI3K/AKT/mTOR signaling pathway have not been investigated in EC yet. In this study, we identified the regulative role of miR-99a on AKT1 and mTOR expression in EC and systematically investigated its effects on the cell proliferation and invasion of EC cells.
Materials and methods
Tissue specimens
Study encompassed 47 formalin-fixed paraffin-embedded specimens and 16 pairs of fresh EC tissues and adjacent normal tissues. Study design was revised and approved by Chongqing Medical University institutional Ethics Committee and informed consent was obtained from each study participant. The matched normal tissues were obtained from the 5 cm distant from the tumor margin, which were further confirmed by pathologists. All patients with EC were submitted to total hysterectomy and bilateral oophorectomy according to FIGO guidelines. None of the patients had received neoadjuvant therapy. 2014 revised FIGO classification was used to determine clinical stage of the disease.
Cell culture and transfection
Human endometrial cancer cell lines (HEC-1B and ishikawa) were obtained from the American Type Culture Collection (ATCC, Manassas, VA, USA). These cells were maintained in DMEM medium (PAA, Pasching, Austria), supplemented with 10% fetal bovine serum (FBS; PAA, Pasching, Austria) and streptomycin (100 μg/mL), penicillin (100 U/mL). Cultures were incubated in a humidified atmosphere of 5% CO2 at 37°C. MiR-99a and relative scramble mimic were purchased from Dharmacon (Austin, TX, USA). According to manufacturer’s instructions, all oligonucleotides were transfected into HEC-1B and ishikawa cells to a final concentration of 100 nM by Dhamafect 1 (Dharmacon, Lafayette, CO, USA). Cells were collected for further experiments 48 h post-transfection.
RNA extraction, reverse transcription and quantitative real-time PCR
According to the protocol of Recover All Total Nucleic Acid Isolation Kit (Ambion, Austin, TX, USA), total RNA was isolated from 20-μm sections from formalin-fixed, paraffin-embedded tissue blocks. The expression level of GAPDH was regard as internal control of mRNAs, and the U6 level was regard as internal control of miRNAs, respectively. Total RNA was reversely transcribed using First-Strand cDNA Synthesis kit (Invitrogen, Carlsbad, CA, USA) with specific primers qualified with a Taqman probe. Then, quantitative real-time PCR was performed to quantify relative expression of miRNA and mRNA using the ABI PRISM 7900 Sequence Detection System (Applied Biosystems, Carlsbad, CA, USA). The primers used for reverse transcriptions and quantitative RT-PCR were summarized in Table 1. The relative expression levels were evaluated using the 2-ΔΔCt method.
Table 1.
Primer sequences for PCR or Reverse transcription. F for forward, R for reverse
| Gene | Primer Sequence |
|---|---|
| Primers for Reverse transcription | |
| miR-99a | 5’-GTCGTATCCAGTGCAGGGTCCGAGGTATTCGCACTGGCACAAG-3’ |
| U6 | 5’-AAAATATGGAACGCTTCACGAATTTG-3’ |
| AKT1 | 5’-TTTTTTTTTTTTTTTTTT-3’(Oligo(dT)) |
| mTOR | 5’-TTTTTTTTTTTTTTTTTT-3’(Oligo(dT)) |
| GAPDH | 5’-TTTTTTTTTTTTTTTTTT-3’(Oligo(dT)) |
| Primers for quantitative Real-time PCR | |
| miR-99a-F | 5’-GCGAACCCGTAGATCCGAT-3’ |
| miR-99a-R | 5’-CAGTGCAGGGTCCGAGGT-3’ |
| U6-F | 5’-CTCGCTTCGGCAGCACATATACT-3’ |
| U6-R | 5’-ACGCTTCACGAATTTGCGTGTC-3’ |
| AKT1-F | 5’-CTCTTTCCAGACCCACGAC-3’ |
| AKT1-R | 5’-CCAGGGCTGACACAATCTC-3’ |
| GAPDH-F | 5’-TCAACGACCACTTTGTCAAGCTCA-3’ |
| GAPDH-R | 5’-GCTGGTGGTCCAGGGGTCTTACT-3’ |
| mTOR-F | 5’-CCATCAGCGTCCCTACCTT-3’ |
| mTOR-R | 5’-GAGAATCAGACAGGCACGAA-3’ |
Luciferase reporter assays
The whole 3’-UTR of AKT1 and mTOR gene were cloned and amplified. Mutation in 3’-UTR of both genes with miR-99a target binding site deleted was generated with the Quick Change Site-Directed Mutagenesis kit (Stratagene, CA, USA). Both the wild and mutant of AKT1 and mTOR genes were cloned into the pGL-3-vector (Promega, Wisconsin, USA) immediately downstream of the Renilla luciferase gene. A luciferase reporter construct containing the miR-99a consensus target sequence served as the positive controls (PC) and the pRL-TK vector was used as internal control. Cells were co-transfected with pGL-3 firefly luciferase reporter (50 ng), pRL-TK Renilla luciferase reporter (10 ng) and miR-99a (50 nM) or scramble mimic (50 nM) with Lipofectamine 2000 (Invitrogen, Carlsbad, CA, USA). Cell lysates were prepared using Passive Lysis Buffer (Promega, Wisconsin, USA) 48 h upon transfection, and luciferase activity was measured using the Dual-Luciferase Reporter Assay (Promega, Wisconsin, USA). Results were normalized to the Renilla luciferase.
Plasmid construction
The full length AKT1 and mTOR genes open reading frame (ORF) were amplified and cloned into pcDNA-3.1 construct to generate the pcDNA3.1-AKT1 and pcDNA3.1-mTOR constructs, and the empty pcDNA3.1 construct was used as internal control. HEC-1B and ishikawa cells were first transfected with miR-99a or scramble mimic (60 nM) in six-well plates. After 24 h of culture, these cells were then co-transfected with miR-99a mimic (30 nM) and either pcDNA3.1-AKT1/mTOR or pcDNA3.1 constructs (2.0 µg). The cells were harvested at predetermined intervals and assays as necessary.
Western blotting analysis
For the western blotting assays, cells were harvested in ice-cold PBS 48 h after transfection and lysed on ice in cold modified radio-immunoprecipitation buffer supplemented with protease inhibitors. The concentration of protein was determined by the BCA Protein Assay Kit (Vigorous Biotechnology Beijing Co. Ltd, Beijing, China). Then equal amount of protein were analyzed by SDS-PAGE. Gels were electro-blotted onto nitrocellulose membranes (Millipore, Wisconsin, USA). After blocked with 5% non-fat dry milk in Tris-buffered saline containing 0.1% Tween-20 2 h, membranes were incubated at 4°C over night with primary antibodies (AKT, p-AKT, mTOR, p-mTOR and GAPDH, Cell Signaling, Massachusetts, USA). Then, membranes were incubated with respective second antibodies and detected by peroxidase-conjugated secondary antibodies using the enhanced chemiluminescence system (ECL) (Millipore, Wisconsin, USA).
CCK-8 assays
The Cell Counting Kit-8 (CCK-8, Dojindo, Kumamoto, Japan) was added to the each wells at 0h, 24 h, 48 h, and 72 h post-transfection, and cells were diluted in normal culture medium at 37°C until visual color conversion occurred. The absorbance values in each well were measured with a microplate reader set at 450 nm and 630 nm.
FACS analysis
For analysis of cell apoptosis, HEC-1B and ishikawa cells were collected and diluted to a concentration of 1×10⁶ cells/ml and washed with ice-cold PBS three times 72 h after transfection. Cells were incubated with PE Annexin-v and 7-AAD according to the PE Annexin-v Apoptosis Detection Kit I (BD Pharmingen, CA, USA) protocol. For analysis of cell cycle distribution, cells were harvested 48 h upon transfection with miR-99a mimic. Cells were washed twice with cold PBS, fixed in ice-cold 70% ethanol, and incubated with propidium iodide (PI) and RNase A. Cells harvested in two experiments were all analyzed by fluorescence-activated cell sorting (FACS). Data were analyzed with Flowjo software.
Cell invasion assays
Cells invasion assays were carried out in modified Boyden chambers (BD Biosciences, San Jose, CA, USA) with 8 µm pore filter inserts in 24-well plates. The transwell chambers were coated with Matrigel (BD Biosciences, San Jose, CA, USA), which mimics the extracellular membrane, before experiments. 24 hours after transfection, 4 × 10⁵ cells suspended in serum-free DMEM were added to the upper chamber, and DMEM containing 20% FBS were added to the lower chambers as a chemoattractant. After 24 h incubation, the non-filtered cells in both assays were gently removed with cotton swabs. Filtered cells located on the lower side of the chamber were stained with crystal violet, air dried and then photographed.
Xenograft experiments
For animal xenograft model assays, 3×10⁶ HEC-1B cells were subcutaneously injected into the posterior flanks of 6 weeks old nude mice, four mice per group. When tumors reached 50 mm3, miR-99a or scramble mimic (100 nmol) was suspended in Lipofectamine 2000 (100 μl). The diluted miRNA was injected into the tumors directly. The injections were performed every 3 days for 6 times totally. Tumor diameters were measured after 7 days from injection and then every 3 days. At 28 days after injection, mice were killed and tumors were weighted after necropsy. Tumor volume was calculated as follows: length×width2×1/2. The mice xenograft model assays were performed according to institutional guidelines.
Immunohistochemistry
Paraffin sections of xenograft mouse tumor tissues were incubated at 65°C for 2 h, and then deparaffinized three times in xylene. Antigen retrieval was done by boiling sections in 10 mM sodium citrate or 1 mM EDTA. Blocking was performed by incubation in 5% normal goat serum in 0.1% TBS for 1 h. Primary antibodies (anti-AKT1, 1:100; anti-mTOR, 1:100; anti-caspase, 1:100: Cell Signaling Technology, MA, USA) were applied overnight at 4°C. Negative control sections were incubated with normal immunoglobulin G. Sections were then incubated with secondary antibody conjugated to horseradish peroxidase (1:100; Cell Signaling Technology, MA, USA) for 2 h at room temperature. Bound antibody was detected using the Liquid DAB+ Substrated Chromogen System (DakoCytomation, Carpinteria, CA, USA). Finally, sections were counterstained with hematoxylin and photographed.
Statistical analysis
Data were expressed as the mean ± standard deviation of at least three repeated experiments. Statistical analysis was carried out using the Student’s t-test for comparisons of two groups, unless otherwise indicated (χ2 test), and data with three groups were analyzed using a one-way analysis of variance (ANOVA). Statistical analysis was carried out using SPSS 15.0 software. P-values < 0.05 were considered significant.
Results
MiR-99a was under-expressed in EC tissues
Although a previous work has implicated the under-expression of miR-99a in EC tissues [24], its exact effects on the malignant phenotype of EC cells remain unclear. Thus, we detected the expression of miR-99a in a panel of 47 EC tumor specimens. Comparing with the adjacent normal tissues, 32 cases of tumor tissues exhibited decreased expression of miR-99a (68.1%, 32 out of 47, Figure 1A). Furthermore, our statistical analysis showed that the average expression level of miR-99a in tumors tissues is much lower than which in normal tissues (as shown in Figure 1B). In attempt to explore the relationship between miR-99a expression and clinicopathological characteristics of EC, the detailed characteristics of the patients included in the study were summarized in Table 2. Although no significantly statistical correlations were observed between miR-99a expression and age, myometrial invasion as well as lymph node metastasis, comparison between groups distinguished based on histological grading revealed the lowest miR-99a expression in G3 samples (2.022±1.244), which was significantly different from G1 and G2 samples (3.371±1.537) (shown in Table 2, P<0.05). Moreover, tumors with later stages (stage III+IV) also present significant lower expression of miR-99a compared with tumors with early stages (P<0.05). These results together suggest that miR-99a was down-regulated in endometrial tumors and might perform an important role in the differentiation and progression of endometrial carcinogenesis.
Figure 1.
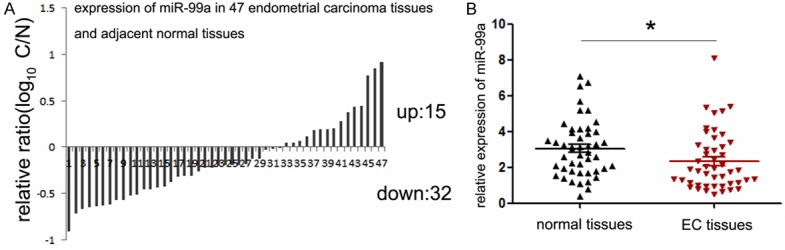
Expression levels of miR-99a in EC specimens. A. The expression of miR-99a in 47 pairs of EC tissues and compared normal tissues was detected by TaqMan quantitative RT-PCR. Data are shown as log10 of relative ratio change of EC tissues relative to normal tissues; B. Statistical analysis of relative miR-99a expression levels in EC tissues and compared normal tissues; The expression of miR-99a was normalized to small nuclear RNA U6. **P<0.01.
Table 2.
Relationship between miR-99a expression and their clinicopathological parameters in 47 EC patients
| Clinicopathological parameters | Number of cases | Expression of miR-99a | P-value |
|---|---|---|---|
| Age (years) | |||
| ≥60 | 32 | 2.441±1.714 | 0.5164 |
| <60 | 15 | 2.107±1.443 | |
| FIGO stage | |||
| Stage I+II | 34 | 2.650±1.354 | 0.0297* |
| Stage III+IV | 13 | 1.509±2.014 | |
| Grade | |||
| G1+G2 | 36 | 2.656±1.715 | 0.0126* |
| G3 | 11 | 1.284±0.509 | |
| Myometrial invasion | |||
| <1/2 myometrialthickenss | 23 | 2.442±1.928 | 0.6626 |
| >1/2 myometrialthickenss | 24 | 2.232±1.304 | |
| Lymph node metastasis | |||
| No | 30 | 2.513±1.857 | 0.3232 |
| Yes | 17 | 2.020±1.084 |
Abbreviations: P-value represents the probability from a Student’s t-test for miR-99a expression between variable subgroups.
P<0.05 was considered to have a significant difference.
Exogenous expression of miR-99a suppresses the growth and invasion of EC cells in vitro
As miR-99a expression significantly decreases in EC tissues, we sought to compensate for its loss through exogenous transfection with miR-99a mimic into HEC-1B and ishikawa cells, which were the most common cell types of EC. Upon transfection, the intracellular levels of miR-99a were about 400-fold and 350-fold higher in HEC-1B and ishikawa cells, respectively (Figure 2A). In a first attempt to investigate the personal effects of miR-99a on the proliferation rate of EC cells, we performed CCK-8 assays. As expected, ectopic miR-99a expression led to significant decrease in cell proliferation in both EC cell lines (Figure 2B). As proliferation directly linked to cell cycle distribution, we further explored the effects of miR-99a on cycle distribution and apoptosis using Fluorescence Activated Cell Sorter (FACS) assays. Interestingly, treatment with miR-99a led to significant increase in G1 population as well as early-apoptosis in both EC cell lines (Figure 2C and 2D), indicating that overexpression of miR-99a could suppress growth rate of EC cells through arresting cell cycle progression and inducing apoptosis of EC cells. Moreover, we sought to evaluate the effects of miR-99a on cell invasion using transwell assays. As shown in Figure 2E, miR-99a can efficiently impair the invasive capacity of EC cells. Taken together, the data mentioned above suggested that miR-99a functions as a tumor suppressor in EC cells.
Figure 2.

MiR-99ainhibits proliferation and invasion of EC cells. A. RT-PCR was performed to detect the expression of miR-99a in GC cell lines (HEC-1B and ishikawa) after treatment with mimics (normalized to U6); B. CCK-8 was performed to analyze the effect of miR-99a on cell proliferation of HEC-1B and ishikawa cells; C, D. The influences of miR-99a on cell cycle distribution and apoptosis of HEC-1B and ishikawa cells were analyzed using fluorescence-activated cell sorting (FACS); E. The effects of miR-99a on cell invasion were detected using transwell chamber assays. The left panel showed representative photos of cells passing through the membrane; the right panel showed the statistic data of cells passing through the membrane; *P<0.05; **P<0.01.
AKT1 and mTOR are both direct targets of miR-99a in EC cells
Although previous works reported the target role of AKT1 and mTOR in NSCLC and cervical cancer cells, their exact role in miR-99a-meidated suppressive effects on EC cells remains unknown [21,22]. To demonstrate the direct regulation by miR-99a, luciferase reporter containing wild-type AKT1 and mTOR 3’UTR sequences or their mutant-derivates with deletion of putative miR-99a-binding sites were co-transfected into both EC cell lines with miR-99a mimic (Figure 3A). As shown in Figure 3B, miR-99a represses luciferase activities depending on the presence of miR-99a binding in the wild-type AKT1 or mTOR 3’UTR. While, miR-99a mutant 3’UTR of AKT1 or mTOR were not affected by overexpression of miR-99a. Identical to the luciferase reporter assays, we also observed the decreased expression of mRNA expression of both AKT1 and mTOR in EC cells upon transfection with miR-99a mimic (Figure 3C), suggesting that miR-99a suppressed the transcription activity of both genes. To further identify the effects of miR-99a on the PI3K/AKT/mTOR signaling pathway, we explored the expression of downstream genes of this pathway in EC cells upon treatment of miR-99a mimic. Identical to the down-regulated mRNA levels, the expression of AKT and mTOR protein was consistently suppressed upon transfection with miR-99a mimic (Figure 3D). Moreover, consistent with the suppressed expression of total AKT and mTOR, p-AKT as well as p-mTOR were significantly decreased. All these results together suggested that AKT1 and mTOR are direct targets of miR-99a in endometrial cancer cells.
Figure 3.
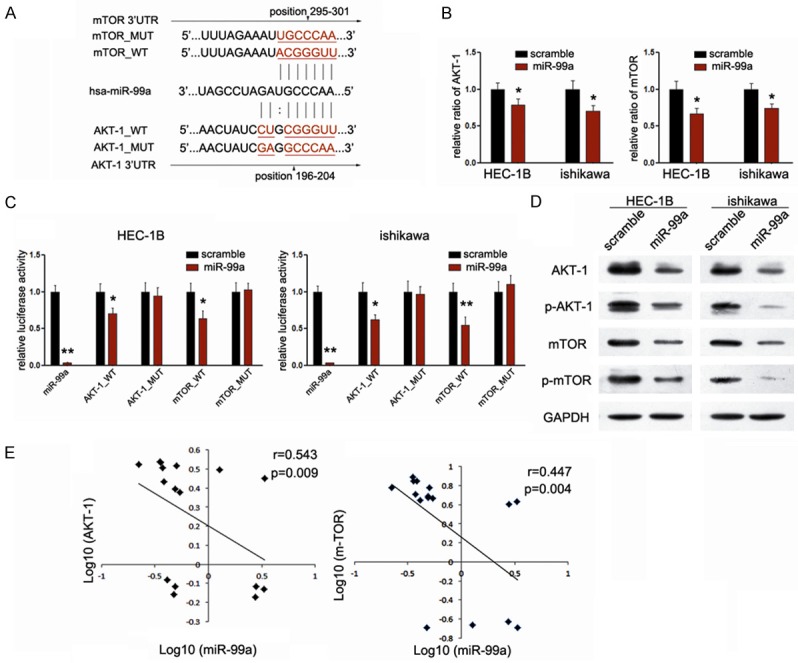
AKT1 and mTOR are direct targets of miR-99a in endometrial cancer cells. A. Schematic representation of AKT1 and mTOR 3’UTR showing putative miR-99a target sites; B. Relative luciferase activity of the indicated AKT1 and mTOR reporter constructs in EC cells, co-transfected with miR-99a mimic or scramble mimic, is shown; C. Quantitative RT-PCR assays were performed to detect the expression of AKT1 and mTOR upon transfection with miR-99a mimic or scramble mimic (normalized to GAPDH); D. Western blot analysis showed the expression levels of total AKT, p-AKT, mTOR and p-mTOR proteins in EC cells treated with miR-99a mimic. E. Inverse correlation between AKT1/mTOR mRNA levels and mniR-99a expression in another 16 pairs of fresh EC samples. **P<0.01.
To further validate our findings, we picked up another 16 pairs of human fresh EC and matched normal endometrium tissues. Comparison of miR-99a and mRNA levels corresponding to AKT1 and mTOR in EC exhibited significantly inverse correlation between miR-99a and AKT1 (r=0.543, P=0.009) (Figure 3E), and inverse correlation between miR-99a and mTOR (r=0.447, P=0.004) (Figure 3E), which provide strong evidence that AKT1, and mTOR are both direct targets of miR-99a in EC.
AKT1 and mTOR are both involved in miR-99a-mediated tumor suppression
Considering the important role of mTOR inhibitor on the cancer therapeutic, we firstly detected the role of mTOR in miR-99a-mediated tumor suppression of EC. We generated a new construct containing the full ORF of mTOR gene. HEC-1B cells, treated with miR-99a mimic before, were then transfected with mTOR constructs. As expected, the expression of mTOR was rescued when the constructs were transfected into HEC-1B cells (Figure 4A). In agreement with the restored expression of mTOR protein, increased cell proliferation (Figure 4B), suppressed cell apoptosis (Figure 4C), accompanied with the abrogation of miR-99a-mediated-suppression of cell invasion (Figure 4D) was observed. These results demonstrate that mTOR was involved in miR-99a-mediated suppressive effects on EC cells.
Figure 4.

mTOR is involved in miR-99a-mediated tumor suppression of EC. (A) Upon transfection with mTOR construct, we rescued the expression of mTOR in both HEC-1B cells; (B) CCK-8 assays were used to detect the effects of miR-99a/mTOR interaction on cell proliferation; (C) FACS assays were performed to detect the effects of miR-99a/mTOR interaction on cell apoptosis; (D) Transwell assays were performed to detect the effects on cell invasion of HEC-1B cells treated as described in (B). *P<0.05; **P<0.01.
AKT is an up-stream gene of mTOR and performs important function at the same time. Next, to further explore whether AKT1 was also involved in the miR-99a-mediated growth inhibition in EC cells, we adopted another “rescue” methodology. Strikingly, Restored expression of AKT could partially abolish the miR-99a-mediated suppression on AKT1 expression, albeit less effectively than achieved by miR-99a overexpression (Figure 5A), demonstrating that miR-99a inhibits AKT1 expression directly through its 3’UTR. Moreover, comparing with cells transfected with miR-99a mimic only, co-treated with AKT1 construct increased the cell proliferation (Figure 5B), and suppressed cell apoptosis (Figure 5C). In accordance with cell proliferation, co-transfected with AKT1 construct partially blocked miR-99a-mediated suppression of invasion (Figure 5D), although much less effectively than restored miR-99a expression. Collectively, these results established the participation of both AKT1 and mTOR in miR-99a pathway, i.e. the tumor suppressor role of miR-99a in EC might be typically a consequence of dual-suppression of PI3K/AKT/mTOR signaling pathway.
Figure 5.

AKT1 is also involved in miR-99a-mediated tumor suppression of EC. (A) Upon transfection with AKT1 construct, we rescued the expression of AKT1 in both HEC-1B cell line; (B) CCK-8 assays were used to detect to explore the effects of miR-99a/AKT1 interaction on cell proliferation; (C) FACS assays were performed to detect the effects of miR-99a/AKT1 interaction on cell apoptosis; (D) Transwell assays were performed to detect the effects on cell invasion of HEC-1B cells treated as described in (B). *P<0.05; **P<0.01.
MiR-99a suppresses tumor growth of EC cells in vivo
Our above findings strongly suggest the potential therapeutic target of miR-99a in EC. Finally, we explored the effects of miR-99a on endometrial tumor growth in vivo. MiR-99a significantly inhibited tumor growth of HEC-1B cells xengrafted mice relative to the scramble mimic injected mice (Figure 6A, 6B). Consistent with the tumor volume, the average tumor weight was also significantly reduced (Figure 6C). Based on these observations, we speculate that overexpression of miR-99a in tumor tissues upon local injection might result in the suppression of tumor growth. To address this, we measured the expression of miR-99a and its targets in the harvested tumor tissues. Consistent with our in vitro results, the expression of miR-99a was significantly increased (Figure 6D). Meanwhile, the expression of AKT and mTOR were decreased in mice treated with miR-99a (Figure 6E). Since caspase-3 is responsible for the cleavage of poly ADP-ribose polymerase, actin and sterol regulatory element binding protein, which are associated with apoptosis [25]. We explored the expression of caspase-3 in the tumors. As shown in Figure 6E, treatment with miR-99a increased the expression of caspase-3 in the tumors, which means miR-99a promoted tumor apoptosis of EC in vivo. Thus, introduction of miR-99a mimic may suppress EC carcinogenesis through dual-suppression of PI3K/AKT/mTOR signaling pathway.
Figure 6.

MiR-99a inhibits EC growth in vivo. A. Graphic representing tumor volumes at the end of the experiment for mice treated with miR-99a mimic or scramble mimic. Four mice per group; B. Tumor volume averages between scramble and miR-99a mimic treated mice groups at the indicated days during the experiment; C. Tumor weight averages between scramble and miR-99a mimic treated mice groups at the end of the experiment (28 days); D. Quantitative RT-PCR analysis showed the relative expression of miR-99a in injected tumor tissues (normalized to U6); E. Representative images of the immunohistochemistry analysis of AKT1, mTOR and caspase-3 in tumors from xenograft mice. Data are presented as means ± SD. Statistical analysis was carried out using ANOVA. **P<0.01.
Discussion
The PI3K/AKT/mTOR signaling pathway mediates important signaling transduction in cell biological progression. Its activation has been widely investigated in the initiation and progression of many cancers, including EC [10-13]. About 80% of EC tumors showed the dysregulation of one or more components of this pathway [5]. Therefore, better understanding of the mechanisms mediating its activation is of crucial importance to reduce morbidity and mortality of this devastating disease. It has been demonstrated that increased expression and activity of this pathway could be connected with either activating-mutation of Ras, PIK3CA, PIK3R1 and PIK3R2 [26] or loss-mutation of PTEN [27]. Nevertheless, such alterations were not uniformly reported in all EC cases, which means other mechanisms might also be involved in the regulation of PI3K/AKT/mTOR activity, such as posttranscriptional regulation of the components expression, which involves microRNAs (miRNAs). In this paper, we provide important evidence in support of miR-99a functioning as a tumor suppressor through dual-suppressing the PI3K/AKT/mTOR signaling pathway in EC.
MiRNAs are a kind of single-strand, non-coding RNA molecules composed of 18-24 nucleotides, which were proven to regulate gene expression during posttranscriptional stages [28]. Currently, accumulating studies reported the important role of miRNAs in the initiation and progression of EC [29], among of which, miR-99a is an intriguing member. MiR-99a gene located at chromosome 21, trisomy of which is one of the most common chromosomal aneuploidy in live born infants [30]. It has been associated with various disease states, and increasing epidemiological data in humans, as well as many in vitro investigative reports have suggested a strong link between miR-99a and cancer suppression. Previous reports have described a growth-suppressive effect of miR-99a on bladder, cervical and gastric cancer cells [21,22,31]. Although miR-99a has been shown to have a strong association with the overall survival of EC [24], the direct role of miR-99a in endometrial cancer progression and the signaling pathways might been involved have never been deciphered. Thus, in the present study, the expression of miR-99a in EC tissues was investigated. Consistent with their study, our study found the expression of miR-99a is significantly decreased in 47 EC specimens compared with adjacent normal tissues, and the lower level was positively related to the differentiation degree of tumors, suggesting that miR-99a may be involved in the progression and differentiation of EC. Moreover, we found that overexpression of miR-99a in EC cells induced a complex phenotype, namely an inhibition of cell proliferation, block of G1/S phase transition, induction of cell apoptosis, and suppression of cell invasion. These results shown here demonstrate that miR-99a could suppress the carcinogenesis of EC in vitro. Additionally, over-expression of miR-99a ameliorated the progression of EC in an established experimental xenograft model, which further suggests miR-99a could suppress the carcinogenesis of EC in vivo. Based on the data mentioned above, it provides the strong evidence that miR-99a acts as a tumor suppressor in EC.
Since miRNAs regulate multiple mRNAs, it is important to explore whether the putative target genes, AKT1 and mTOR, were both involved in miR-99a-mediated tumor suppression. The prediction program identified the putative binding sites of miR-99a in the 3’UTR of AKT1 and mTOR. Further luciferase assays, accompanied with mRNA and protein assays validated these sites perform function, i.e. through transfection with miR-99a, the mRNA and protein levels of both AKT1 and mTOR could be consistently down-regulated in EC cells, suggesting their target role of miR-99a. Moreover, to further explore the relationship between miR-99a and both genes, we picked up another 16 pairs of fresh EC tissues and further analyze the relevance of their expression. Both AKT and mTOR were found to be negative related with the expression miR-99a in the EC tissues. These results comprehensively demonstrated the target role of AKT1 and mTOR of miR-99a in EC, which means that miR-99a inhibition might, at least partially, mediate the overexpression of PI3K/AKT/mTOR signaling pathway through targeting AKT1 and mTOR in EC, apart from the traditional regulative pathway of mutation.
Currently, different strategies for the pharmacological manipulation of miRNAs have been carried out in preclinical animal models [32]. For example, local injection of anti-miR-21 reduced the growth of breast cancer xenografts and restored trastuzumab sensitivity by increasing PTEN expression [33]. In addition, systemic delivery of a miR-34a mimic, the first miRNA in phaseI clinical trials, decreased the tumor burden in a murine model of NSCLC [34]. Herein, we also detected the effects of miR-99a mimic on the tumor growth of EC xenograft mice. We found that miR-99a significantly inhibits the growth of EC tumors. Immunochemical analysis of xenograft carcinoma tissues demonstrated negative regulation of AKT1 and mTOR by miR-99a, suggesting that administration of miR-99a mimic to EC patients may provide a novel EC therapeutic strategy aimed at preventing EC development partially through the dual-suppressing of PI3K/AKT/mTOR signaling pathway. However, as a particular 3’-UTR may contain binding sites for several different miRNAs and a single miRNA may have several target genes, there will be a critical need for cell-specific miRNA delivery in different cancer contexts. Moreover, more experiments are warranted to explore whether exogenesis of miR-99a alone or combined with other pathway inhibitors performs more effective function.
Taken together, our results establish a functional link between miR-99a and AKT1/mTOR expression in endometrial cancer. Restoring miR-99a function could represent an alternative approach to reduce therapeutically AKT1 and mTOR expression, thereby attenuating aggressive tumor properties in vitro and in vivo. Collectively, this finding not only helps us understand the molecular mechanism of endometrial carcinogenesis, but also gives us a strong rationale to further investigate miR-99a as a potential biomarker and therapeutic target for EC.
Acknowledgements
This work was supported by grants from the National Natural Science Foundation of Yongchuan District (Grant No. Ycstc, 2014nc5004); Program of Yongchuan Hospital of Chongqing Medical University (Grant Nos. YJYB20120012; YJZQN 201514; YCZQN 201511).
Disclosure of conflict of interest
The authors declare no conflict of interest.
References
- 1.Siegel R, Ward E, Brawley O, Jemal A. Cancer statistics, 2011: the impact of eliminating socioeconomic and racial disparities on premature cancer deaths. CA Cancer J Clin. 2011;61:212–236. doi: 10.3322/caac.20121. [DOI] [PubMed] [Google Scholar]
- 2.Siegel R, Ma J, Zou Z, Jemal A. Cancer statistics, 2014. CA Cancer J Clin. 2014;64:9–29. doi: 10.3322/caac.21208. [DOI] [PubMed] [Google Scholar]
- 3.Jin F, Devesa SS, Chow WH, Zheng W, Ji BT, Fraumeni JF Jr, Gao YT. Cancer incidence trends in urban shanghai, 1972-1994: an update. Int J Cancer. 1999;83:435–440. doi: 10.1002/(sici)1097-0215(19991112)83:4<435::aid-ijc1>3.0.co;2-j. [DOI] [PubMed] [Google Scholar]
- 4.Ushijima K. Current status of gynecologic cancer in Japan. J Gynecol Oncol. 2009;20:67–71. doi: 10.3802/jgo.2009.20.2.67. [DOI] [PMC free article] [PubMed] [Google Scholar]
- 5.Pavlidou A, Vlahos NF. Molecular alterations of PI3K/Akt/mTOR pathway: a therapeutic target in endometrial cancer. ScientificWorldJournal. 2014;2014:709736. doi: 10.1155/2014/709736. [DOI] [PMC free article] [PubMed] [Google Scholar]
- 6.Sheppard K, Kinross KM, Solomon B, Pearson RB, Phillips WA. Targeting PI3 kinase/AKT/mTOR signaling in cancer. Crit Rev Oncog. 2012;17:69–95. doi: 10.1615/critrevoncog.v17.i1.60. [DOI] [PubMed] [Google Scholar]
- 7.Bauer TM, Patel MR, Infante JR. Targeting PI3 kinase in cancer. Pharmacol Ther. 2015;146:53–60. doi: 10.1016/j.pharmthera.2014.09.006. [DOI] [PubMed] [Google Scholar]
- 8.Shang HS, Chang JB, Lin JH, Lin JP, Hsu SC, Liu CM, Liu JY, Wu PP, Lu HF, Au MK, Chung JG. Deguelin Inhibits the Migration and Invasion of U-2 OS Human Osteosarcoma Cells via the Inhibition of Matrix Metalloproteinase-2/-9 in Vitro. Molecules. 2014;19:16588–16608. doi: 10.3390/molecules191016588. [DOI] [PMC free article] [PubMed] [Google Scholar]
- 9.Yu HY, Kim SO, Jin CY, Kim GY, Kim WJ, Yoo YH, Choi YH. beta-lapachone-Induced Apoptosis of Human Gastric Carcinoma AGS Cells Is Caspase-Dependent and Regulated by the PI3K/Akt Pathway. Biomol Ther (Seoul) 2014;22:184–192. doi: 10.4062/biomolther.2014.026. [DOI] [PMC free article] [PubMed] [Google Scholar]
- 10.Wang L, Wu J, Lu J, Ma R, Sun D, Tang J. Regulation of the cell cycle and PI3K/Akt/mTOR signaling pathway by tanshinone I in human breast cancer cell lines. Mol Med Rep. 2015;11:931–9. doi: 10.3892/mmr.2014.2819. [DOI] [PMC free article] [PubMed] [Google Scholar] [Retracted]
- 11.Houede N, Pourquier P. Targeting the genetic alterations of the PI3K-AKT-mTOR pathway: Its potential use in the treatment of bladder cancers. Pharmacol Ther. 2015;145:1–18. doi: 10.1016/j.pharmthera.2014.06.004. [DOI] [PubMed] [Google Scholar]
- 12.Denoyelle C, Lambert B, Meryet-Figuiere M, Vigneron N, Brotin E, Lecerf C, Abeilard E, Giffard F, Louis MH, Gauduchon P, Juin P, Poulain L. miR-491-5p-induced apoptosis in ovarian carcinoma depends on the direct inhibition of both BCL-XL and EGFR leading to BIM activation. Cell Death Dis. 2014;5:e1445. doi: 10.1038/cddis.2014.389. [DOI] [PMC free article] [PubMed] [Google Scholar]
- 13.Zhu L, Derijard B, Chakrabandhu K, Wang BS, Chen HZ, Hueber AO. Synergism of PI3K/Akt inhibition and Fas activation on colon cancer cell death. Cancer Lett. 2014;354:355–364. doi: 10.1016/j.canlet.2014.08.038. [DOI] [PubMed] [Google Scholar]
- 14.Murayama-Hosokawa S, Oda K, Nakagawa S, Ishikawa S, Yamamoto S, Shoji K, Ikeda Y, Uehara Y, Fukayama M, McCormick F, Yano T, Taketani Y, Aburatani H. Genome-wide single-nucleotide polymorphism arrays in endometrial carcinomas associate extensive chromosomal instability with poor prognosis and unveil frequent chromosomal imbalances involved in the PI3-kinase pathway. Oncogene. 2010;29:1897–1908. doi: 10.1038/onc.2009.474. [DOI] [PubMed] [Google Scholar]
- 15.Chen J. The Src/PI3K/Akt signal pathway may play a key role in decreased drug efficacy in obesity-associated cancer. J Cell Biochem. 2010;110:279–280. doi: 10.1002/jcb.22572. [DOI] [PubMed] [Google Scholar]
- 16.Chen J, Zhao KN, Li R, Shao R, Chen C. Activation of PI3K/Akt/mTOR pathway and dual inhibitors of PI3K and mTOR in endometrial cancer. Curr Med Chem. 2014;21:3070–3080. doi: 10.2174/0929867321666140414095605. [DOI] [PubMed] [Google Scholar]
- 17.O’Reilly KE, Rojo F, She QB, Solit D, Mills GB, Smith D, Lane H, Hofmann F, Hicklin DJ, Ludwig DL, Baselga J, Rosen N. mTOR inhibition induces upstream receptor tyrosine kinase signaling and activates Akt. Cancer Res. 2006;66:1500–1508. doi: 10.1158/0008-5472.CAN-05-2925. [DOI] [PMC free article] [PubMed] [Google Scholar]
- 18.Wan X, Harkavy B, Shen N, Grohar P, Helman LJ. Rapamycin induces feedback activation of Akt signaling through an IGF-1Rdependent mechanism. Oncogene. 2007;26:1932–1940. doi: 10.1038/sj.onc.1209990. [DOI] [PubMed] [Google Scholar]
- 19.Xu S, Li S, Guo Z, Luo J, Ellis MJ, Ma CX. Combined targeting of mTOR and AKT is an effective strategy for basal-like breast cancer in patient-derived xenograft models. Mol Cancer Ther. 2013;12:1665–1675. doi: 10.1158/1535-7163.MCT-13-0159. [DOI] [PMC free article] [PubMed] [Google Scholar]
- 20.Mirzoeva OK, Hann B, Hom YK, Debnath J, Aftab D, Shokat K, Korn WM. Autophagy suppression promotes apoptotic cell death in response to inhibition of the PI3K-mTOR pathway in pancreatic adenocarcinoma. J Mol Med (Berl) 2011;89:877–889. doi: 10.1007/s00109-011-0774-y. [DOI] [PubMed] [Google Scholar]
- 21.Wang L, Chang L, Li Z, Gao Q, Cai D, Tian Y, Zeng L, Li M. miR-99a and -99b inhibit cervical cancer cell proliferation and invasion by targeting mTOR signaling pathway. Med Oncol. 2014;31:934. doi: 10.1007/s12032-014-0934-3. [DOI] [PubMed] [Google Scholar]
- 22.Yu S, Zhang C, Deng F, Zhang Y. miR-99a suppresses the metastasis of human nonsmall cell lung cancer cells by targeting AKT1 signaling pathway. J Cell Biochem. 2015;116:268–76. doi: 10.1002/jcb.24965. [DOI] [PubMed] [Google Scholar]
- 23.Guo H, Ingolia NT, Weissman JS, Bartel DP. Mammalian microRNAs predominantly act to decrease target mRNA levels. Nature. 2010;466:835–840. doi: 10.1038/nature09267. [DOI] [PMC free article] [PubMed] [Google Scholar]
- 24.Torres A, Torres K, Pesci A, Ceccaroni M, Paszkowski T, Cassandrini P, Zamboni G, Maciejewski R. Deregulation of miR-100, miR-99a and miR-199b in tissues and plasma coexists with increased expression of mTOR kinase in endometrioid endometrial carcinoma. BMC Cancer. 2012;12:369. doi: 10.1186/1471-2407-12-369. [DOI] [PMC free article] [PubMed] [Google Scholar]
- 25.Sternberg MJ, Bates PA, Kelley LA, MacCallum RM. Progress in protein structure prediction: assessment of CASP3. Curr Opin Struct Biol. 1999;9:368–373. doi: 10.1016/S0959-440X(99)80050-5. [DOI] [PubMed] [Google Scholar]
- 26.Cheung LW, Hennessy BT, Li J, Yu S, Myers AP, Djordjevic B, Lu Y, Stemke-Hale K, Dyer MD, Zhang F, Ju Z, Cantley LC, Scherer SE, Liang H, Lu KH, Broaddus RR, Mills GB. High frequency of PIK3R1 and PIK3R2 mutations in endometrial cancer elucidates a novel mechanism for regulation of PTEN protein stability. Cancer Discov. 2011;1:170–185. doi: 10.1158/2159-8290.CD-11-0039. [DOI] [PMC free article] [PubMed] [Google Scholar]
- 27.Memarzadeh S, Zong Y, Janzen DM, Goldstein AS, Cheng D, Kurita T, Schafenacker AM, Huang J, Witte ON. Cell-autonomous activation of the PI3-kinase pathway initiates endometrial cancer from adult uterine epithelium. Proc Natl Acad Sci U S A. 2010;107:17298–17303. doi: 10.1073/pnas.1012548107. [DOI] [PMC free article] [PubMed] [Google Scholar]
- 28.Sayed D, Abdellatif M. MicroRNAs in development and disease. Physiol Rev. 2011;91:827–887. doi: 10.1152/physrev.00006.2010. [DOI] [PubMed] [Google Scholar]
- 29.Banno K, Yanokura M, Kisu I, Yamagami W, Susumu N, Aoki D. MicroRNAs in endometrial cancer. Int J Clin Oncol. 2013;18:186–192. doi: 10.1007/s10147-013-0526-9. [DOI] [PubMed] [Google Scholar]
- 30.Improved national prevalence estimates for 18 selected major birth defects--United States, 1999-2001. MMWR Morb Mortal Wkly Rep. 2006;54:1301–1305. [PubMed] [Google Scholar]
- 31.Feng Y, Kang Y, He Y, Liu J, Liang B, Yang P, Yu Z. microRNA-99a acts as a tumor suppressor and is down-regulated in bladder cancer. BMC Urol. 2014;14:50. doi: 10.1186/1471-2490-14-50. [DOI] [PMC free article] [PubMed] [Google Scholar]
- 32.Soriano A, Jubierre L, Almazan-Moga A, Molist C, Roma J, de Toledo JS, Gallego S, Segura MF. microRNAs as pharmacological targets in cancer. Pharmacol Res. 2013;75:3–14. doi: 10.1016/j.phrs.2013.03.006. [DOI] [PubMed] [Google Scholar]
- 33.Gong C, Yao Y, Wang Y, Liu B, Wu W, Chen J, Su F, Yao H, Song E. Up-regulation of miR-21 mediates resistance to trastuzumab therapy for breast cancer. J Biol Chem. 2011;286:19127–19137. doi: 10.1074/jbc.M110.216887. [DOI] [PMC free article] [PubMed] [Google Scholar]
- 34.Trang P, Wiggins JF, Daige CL, Cho C, Omotola M, Brown D, Weidhaas JB, Bader AG, Slack FJ. Systemic delivery of tumor suppressor microRNA mimics using a neutral lipid emulsion inhibits lung tumors in mice. Mol Ther. 2011;19:1116–1122. doi: 10.1038/mt.2011.48. [DOI] [PMC free article] [PubMed] [Google Scholar]