

Abstract
Purpose: This study aimed to determine whether chronic intraocular pressure (IOP) elevation induces retinal oxidative stress and alters mitochondrial morphology and function of retinal ganglion cells (RGC) and to explore the effects of AAV-SOD2 gene therapy on the RGC survival and mitochondrial dysfunction. Methods: Chronic experimental glaucoma was induced unilaterally in adult male Sprague-Dawley rats by laser burns at trabecular meshwork and episcleral veins 2 times with an interval of one week. One eye of each rat was intravitreally pretreated with recombinant adeno-associated virus expressing SOD2 (AAV-SOD2) or recombinant AAV expressing GFP (AAV-GFP) 21 days before glaucoma induction. RGCs counting, morphometric analysis of retina and optic nerve, and detection of activities of retinal SOD2 and catalase, MDA, mitochondrial morphology, mitochondrial dynamin protein OPA1 and DRP-1 expressions were conducted at 4, 8, 12 and 24 weeks. Results: Severe RGC loss, degeneration of optic nerve, reduced thickness of RGC layer and nerve fiber layer, significant decrease in total SOD and catalase activities, mitochondrial dysfunction and increased MDA were observed at 4, 8, 12 and 24 weeks after glaucoma. Pretreatment with AAV-SOD2 significantly reduced MDA and attenuated the damage to RGCs through a mitochondria-related pathway. Conclusion: AAV mediated pre-treatment with SOD2 is able to attenuate oxidative stress and improve mitochondrial dysfunction of RGC and optic nerve secondary to glaucoma. Thus, SOD2 may be used to prevent the retinal RGCs from glaucoma, which provides a promising strategy for glaucoma therapy.
Keywords: Chronic intraocular pressure, retinal ganglion cells, SOD
Introduction
Glaucoma, a chronic and progressive disease, is the second leading cause of blindness world wide. Primary open-angle glaucoma (POAG) is the most common type of glaucoma [1-4]. Elevated intraocular pressure (IOP) is thought to be one of the most important risk factors of glaucoma [5-8]. It has been widely demonstrated that retinal ganglion cells (RGCs) are selectively affected during glaucoma [5,9,10]. High IOP will cause RGCs death. However, the precise mechanisms of RGCs death are still unknown. Growing evidence indicates that oxidative stress is one of the major events triggering neuronal death in glaucoma [11-13].
Retina, which is different from most parts of nervous system, is vulnerable to potentially elevated oxidative stress due to light exposure [8,13,14]. RGCs, the neurons in the retina, receive visual signals from photoreceptors, bipolar and amacrine cells, and transmit the information to the brain. RGCs have a high energy requirement and depend on mitochondria for their survival and functions [15]. In healthy cells, mitochondria are autonomous and morphologically dynamic organelles that structurally reflect a precise balance between ongoing fusion and fission within a cell [16]. This balance is regulated by a family of dynamin-related GTPases which exert opposite effects. Optic atrophy type 1 (OPA1) is related to mitochondrial fusion, and dynamin-related protein-1 (Drp-1) regulates mitochondrial fission [17,18]. Mitochondrial fission and fusion have become a focus in recent years due to their involvement in apoptosis [19]. However, the specific functions of these proteins in retinal cells remain unknown [20,21].
Our previous study [22,23] suggested that ischemia/reperfusion-induced oxidative stress accelerated the loss of RGCs and reduced the inner plexiform layer (IPL) thickness and manganese superoxide dismutase (SOD2) activity. Moreover, administration of AAV-SOD2 significantly reduced superoxide ion, malondialdehyde (MDA), 8-hydroxy-2’-deoxyguanosine (8-OHdG) and nitrotyrosine and attenuated the damage to RGCs and IPL. However, whether IOP elevation triggers mitochondrial dysfunction and oxidative stress and alters the balance between ongoing fusion and fission is still unknown [24-26]. In previous study, acute IOP elevation was induced in a majority of animal models, and the trabecular meshwork (TM) instead of retina is usually investigated [20,21,26-29].
The study was undertaken to analyze the relationship between oxidative activity and mitochondrial dysfunction after chronic IOP elevation (4-24 weeks), and investigate whether the changes in OPA1 and Drp-1 trigger RGC apoptosis, and the protective effects of antioxidant AAV-SOD2.
Materials and methods
Animals
Adult male Sprague-Dawley rats (160-200 g) were purchased from the Laboratory Animal Center of the Second Xiangya Hospital, Central South University, Changsha, China. Animals were maintained in temperature-controlled rooms with 12-h light/12-h dark cycle and given ad libitum access to food and water. The study was approved by the Institutional Animal Care and Use Committee at Central South University, and all the procedures were conducted in accordance with the principles described in the ARVO Statement for the Use of Animals in Ophthalmic and Vision Research. At the end of study, animals were killed by overdoses of ketamine and xylazine (14 and 30 mg/kg, respectively). All the animals were randomly assigned to control group, laser group and AAV-SOD2 group.
Establishment of chronic IOP elevation model
IOP elevation was induced by laser burns at the trabecular meshwork and episcleral veins as previously described with modification [30]. Burns were conducted twice with an interval of 1 week to induce the chronic IOP elevation. Briefly, animals were anesthetized with intraperioneal ketamine (50 mg/kg) and xylazine (5 mg/kg), the laser treatment was conducted at 0.4 W for 0.7 s. The Trabecular Meshwork (TM) was burned at about 60 to 80 sites, and episcleral veins at about 15 to 20 sites. The laser beam was delivered with a slit lamp system in a sharp angle to the TM without additional lenses.
The tonometer was used to measure the IOP of both eyes before and after laser treatment once every 3-4 days in the first 2 weeks and once weekly thereafter under topical anesthesia with 0.5% proparacaine hydrochloride eyedrops. Five measurements were obtained in each eye and the mean was calculated.
Administration of recombinant adeno-associated virus mediated manganese superoxide dismutase (SOD2)
The recombinant adeno-associated virus (AAV) vector backbone pTR-UF11 was used to accept the SOD2 cDNA. Gene expression was driven by the hybrid cytomegalovirus and chicken β-actin proximal promoter. The resultant pTR-SOD2 plasmids were amplified, then purified and packaged as AAV serotype 2 vector [31]. The resultant AAV-packaged SOD2 and humanized GFP control viruses were assayed. Each virus preparation contained approximately 1012 copies/ml. AAV-SOD2 was a gift from Dr. Alfred S. Lewin, (Department of Ophthalmology, University of Florida, USA) [31,32].
Two microliters of AAV-SOD2 or AAV-GFP was injected in one eye of each animal in the vitreous cavity 21 days before the induction of chronic IOP elevation. Animals were sacrificed and tissues were collected at 4, 8, 12 and 24 weeks after the induction of chronic IOP elevation.
Morphologic and morphometric analyses
The eyes were collected, fixed in 4% paraformaldehyde for 12 h, washed with PBS and embedded in paraffin. Six paraffin-embedded sections (thickness, 4 μm) obtained through the optic disc of each eye were prepared in a standard manner, and stained with hematoxylin and eosin. Retinal damage was evaluated as described previously [33] with three sections from each eye being used for the morphometric analysis. Images were captured under a light microscope, and the thickness of IPL was measured by an investigator who was blind to the grouping (WM, Jiang). Data from three sections (selected randomly from six sections) were averaged for each eye, and these were used to evaluate RGCs numbers and NCL thickness.
The whole retina was separated and subjected to immunohistochemistry for Brn-3b, and the Brn-3b positive RGCs were counted according to previously described [34]. Briefly, eyes were harvested from euthanized SD rats and dissected free from cornea, iris and lens. The vitreous was removed from the retina. Retinas were fixed in 4% paraformaldehyde for 30 min at room temperature, then put into a 24-well plate (Costar, Corning, NY, USA) and washed with PBS. Subsequently, the retinas were incubated in 30% sucrose at 4°C overnight, and then in 0.3% Triton X-100 (X-100-PC Sigma) in PBS for 30 min, followed by washing thrice with PBS. Non-specific binding was blocked by incubating the retinas with 10% normal donkey serum (Jackson Immunoresearch) in 0.01 M PBS at 4°C overnight. Retinas were incubated with goat anti-mouse Brn3b (1:100; Santa Cruz Biotechnology, Santa Cruz, CA, USA) in 10% normal donkey serum at 4°C for 7 days. After washing thrice with PBS, the retinas were then incubated with donkey anti-goat IgG conjugated to Dylight 594 (1:200; Jackson Immunoresearch laboratories) in 10% normal donkey serum at 4°C overnight, followed by washing thrice with PBS and incubation with 1 μg/ml DAPI for 10 min. The residual DAPI was removed by washing thrice in PBS. The retinas were flattened on microscope slides and cut into four parts. The slides were mounted using an anti-fade kit and coverslipped.
A total of 12 images were captured at the center and peripheral retina around the optic nerve for each retina, and the halfway between the optic nerve head and the outer periphery was defined as mid periphery, which means retina is divided into 12 equal pieces, and each piece is 30 degrees [34]. Each 20× image captured 0.233 mm2 of inner retinal surface area. A total of 12 images were captured, and the whole retinal area was 0.233×12 = 2.796 mm2. Image-J was used to count the cells. The mean density of Brn3b positive cells in this area was calculated by dividing the whole number of RGC by 2.796.
Detection of total SOD, SOD2 and catalase activities and MDA content
The kits used for the detections of superoxide dismutase (SOD) and catalase activities (CAT) and MDA contents were purchased from Nanjing Jiancheng Bioengineering Institute (Jiangsu Province, China) [35]. The retina samples were homogenized in 0.9% saline on ice (1:10). The supernatant was used for biochemical analyses. The protein concentration of the supernatant was determined by the bicinchoninic acid assay (BCA assay, Nanjing Jiancheng Bioengineering Institute). Following methods were used for the detections [17]: The total SOD activity was detected using a xanthine and xanthine oxidase system to produce superoxide. The superoxide oxidizes hydroxylamine to nitrite, forming carmine agent. The absorbance of resultant mixture was measured with a spectrophotometer (Beckman DU 65; Beckman instruments, USA) at 450 nm, and the total SOD activity was expressed as units/mg protein (U/mgprot). Catalase activity was assessed by analyzing the rate at which it caused the decomposition of H2O2 at 240 nm [36] and is expressed as units/mg protein (U/mgprot). MDA content in the homogenates was determined based on thiobarbituric acid (TBA) reactivity [37]. Briefly, the homogenate was mixed with trichloroacetic acid followed by centrifugation. The supernatant was obtained, and TBA was added. The absorbance of resultant mixture was measured at 532 nm. MDA content was also normalized against protein (pmol/mg).
Detection of SOD2, OPA1 and Drp1 expressions
Western blot analysis
Total protein was extracted using the method described previously [22]. Briefly, retinas were homogenized in loading buffer, and the supernatant was collected after centrifugation. Each sample (20 μg) was separated by PAGE and electrotransferred to nitrocellulose membranes. The membrane was blocked with 5% non-fat milk and 0.05% Tween-20 in PBS, incubated with monoclonal mouse anti-OPA1 antibody (1:1000, BD Transduction Laboratories), polyclonal rabbit anti-Drp1 antibody (1:1000, Santa Cruse biotechnology), monoclonal mouse anti-SOD-2 antibody (1:1000, Abcam, Cambridge, UK), or rabbit polyclonal alpha-Tubulin antibody as loading control (1:2000, Sigma, St. Louis, MO).
Quantitative real-time RT-PCR
Retinal tissues were dissected immediately after the rats were sacrificed, freshly frozen in liquid nitrogen and stored at -80°C until analysis. RNeasy Mini kit (Qiagen) was used to isolate RNA from the retina at different time points after laser burns. Expression was normalized to that of the housekeeping gene ACTB. The primers used for RT-PCR were as follows: OPA1 Forward 5’-TCTGAGCTGGAGTGCAACGA-3’; Reverse 5’-GCGTGTTGGCAGTGATAGCG-3’. Drp1 Forward 5’-TGCCCGAGAACAGCGAGATT-3’; Reverse 5’-GCCTTTGGGACGCTGTCTTG-3’. SOD2 Forward 5’-TTGGCTTCAATAAGGAGCAAG-3’; Reverse 5’-ACACATCAATCCCCAGCAGT-3’. ACTB Forward 5’-AGTACAACCTTCTTGCAGCT-3’; Reverse 5’-TCAGGATCTTCATGAGGTAG-3’.
Transmission electron microscopy
Eyeballs were removed and fixed overnight in fresh 2.5% glutaraldehyde in 0.1 M sodium cacodylate buffer pH 7.4. After removing the anterior segment, the eyecups were cut into 1-mm sections from the temporal side of optic nerve under a microscope. The vitreum was removed, and then the sample was fixed in 1% osmium tetroxide in 0.1 M sodium cacodylate buffer for 2 h, followed by dehydration. Semi-thin sections (500 nm) were obtained with an ultra microtome and stained with toluidine blue. Ultra-thin sections (60 nm) were contrasted with uranyl acetate and lead citrate, and observed with a transmission electron microscope (Hitachi).
Statistical analysis
Data are expressed as mean ± standard deviation. Comparisons were conducted with t-test or one-way analysis of variance (ANOVA). A value of P<0.05 was considered statistically significant.
Results
Change in intraocular pressure
The mean baseline IOP in 180 animals (360 eyes) before treatment was 17.8±1.7 mmHg. The IOP was measured every week after laser treatment. All treated eyes in the study groups had elevated IOP before 12 weeks (P<0.05). The mean IOP in the glaucomatous eyes is for higher than 21 mmHg, which was significantly higher than in the control eyes. However, the IOP at or after 12 weeks after laser treatment was comparable between injured eyes and contralateral eyes (P>0.05) (Figure 1).
Figure 1.
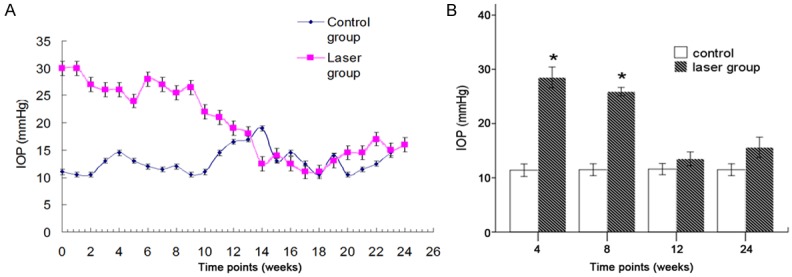
Time course of IOP elevation (A). IOP elevation occurred since the first week after laser treatment, but IOP returned to baseline at 12 weeks. Significant difference was observed in the IOP between laser group and control group, except at 12 and 24 weeks after laser treatment. *P<0.05 (B).
Morphologic and morphometric analyses of the retina, optic nerve and RGCs damages after chronic IOP elevation
Pathological examination of the retina showed the loss of RGCs. The visible alterations were the reduction in the ganglion cell layer (GCL) and the nerve fiber layer (NFL) thickness (Figure 2).
Figure 2.
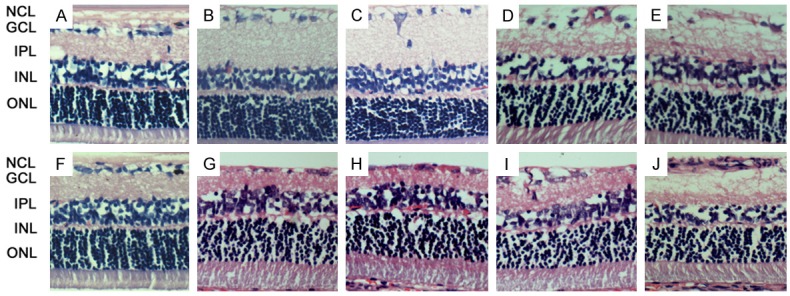
Histological examination of the retina in control group (A, F) and laser treatment groups (40×) with (G-J) or without intraocular AAV-SOD2 injection (B-E). Loss of GCL and NCL was observed at 4, 8, 12 and 24 weeks after laser treatment in rats with intraocular AAV-SOD2 injection (B-E) and in those receiving intraocular AAV-SOD2 injection at 12 weeks and 24 weeks after laser treatment as compared to control group (A, F). Significant RGCs loss was found at 12 (D) and 24 weeks (E, J), while the NCL after AAV-SOD2 treatment was more orderly and thicker than that in the absence of AAV-SOD2 treatment at 12 (I, D) and 24 weeks (J, E).
Compared to control group, the retrobulbar optic nerve fiber of the injured eyes at different time points showed the disorganization of nerve fibers. At 4 and 8 weeks after laser treatment (early stage), axonal swellings and disordered fibers in one of the focal region of optic nerve were observed (Figure 3B and 3C). The degenerative axons increased and involved other portions of the optic nerve at 12 weeks after laser treatment (Figure 3D). Nearly all axons become degenerative and atrophic at 24 weeks after laser treatment (Figure 3E), indicating permanent damage to the entire optic nerve. Similar findings were not observed until 12 weeks after laser treatment in animals with AAV-SOD2 treatment (Figure 3I), and degenerative axons were observed only at 24 weeks in AAV-SOD2 group (Figure 3J). As compared to laser group, the axons in AAV-SOD2 group showed less degenerative fibers at 24 weeks after laser treatment.
Figure 3.
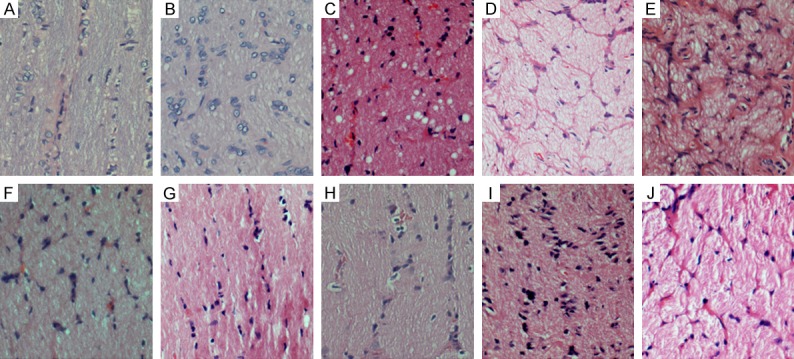
Histological examination of the optic nerve (40×) in control group (A, F) and laser treatment groups with (G-J) or without intraocular AAV-SOD2 injection (B-E). At 4 and 8 weeks after laser treatment, axonal swelling and disordered fibers in one, focal region of the nerve were observed (B, C). The degenerative axons increased and also involved other portions of the optic nerve at 12 weeks after laser treatment (D). Nearly all the axons become degenerative and atrophic at 24 weeks after laser treatment (E). The axonal swelling and disordered fibers were also observed since 12 weeks after laser treatment in the presence of intraocular AAV-SOD2 injection (I), and degenerative axons were found only at 24 weeks after laser treatment in the presence of intraocular AAV-SOD2 injection (J).
To evaluate RGCs death in this model, RGCs were counted after staining with Brn3b antibody. A total of 12 images at 20× were captured from the mid-periphery circling the optic nerve of each retina and the mean density of RGCs was calculated. In laser treatment groups, Brn3 positive cells decreased as compare to control group. The mean RGCs density was 218.645±2.636 mm-2 in retina after 24 weeks when the IOP was normal, whereas it was 622.437±44.809 mm-2 in control group (Figure 4), showing a significant difference between groups (P<0.05), which suggests that IOP elevation leads to a significant loss of RGCs which persists even when IOP becomes normal.
Figure 4.
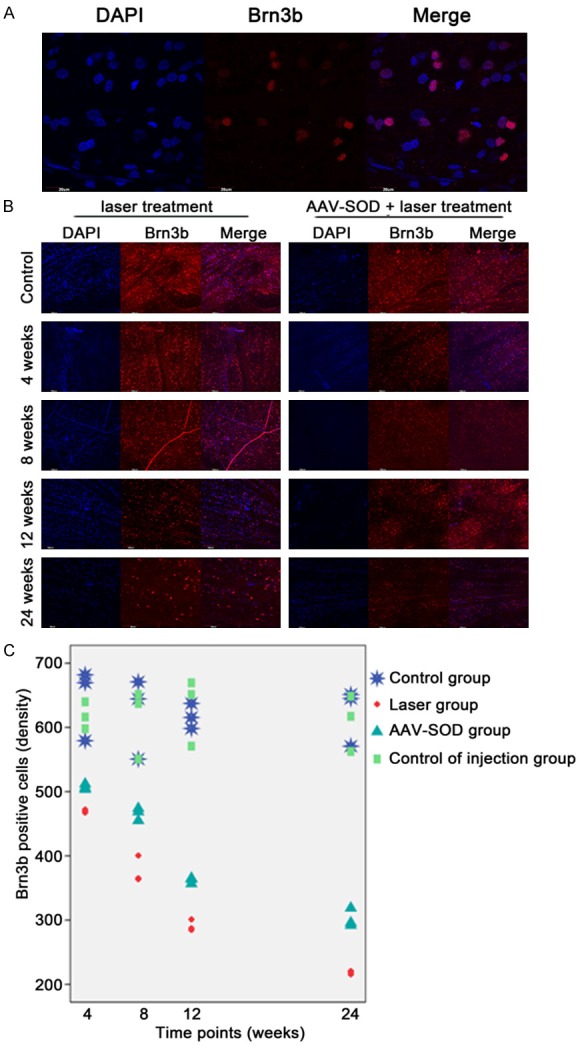
DAPI and Brn-3b Alexafluor594 staining of the retina (A). The number of Brn3b positive cells (RGCs) was significantly smaller than that of DAPI positive cells. Cells positive for DAPI and Brn-3b were counted in the retina at 4, 8, 12, and 24 weeks after laser treatment with or without AAV-SOD2 injection (B). The Brn3b positive RGCs in all laser groups with or whithout AAV-SOD2 treatment decreased as compared to control group (C), but compared to laser group without AAV-SOD2 treatment, AAV-SOD2 group shows more positive cells (p<0.05).
Change in mitochondrial morphology of the retina
In control group, mitochondria were close to the nucleus and had typical elongated filamentous morphology (Figure 5A). In contrast, mitochondria in the retinas at 24 weeks after laser treatment were shorter in length, became round around the nucleus, and clustered (Figure 5B). In AAV-SOD2 group, both round and long shaped mitochondria were found in the ganglion cells (Figure 5C).
Figure 5.
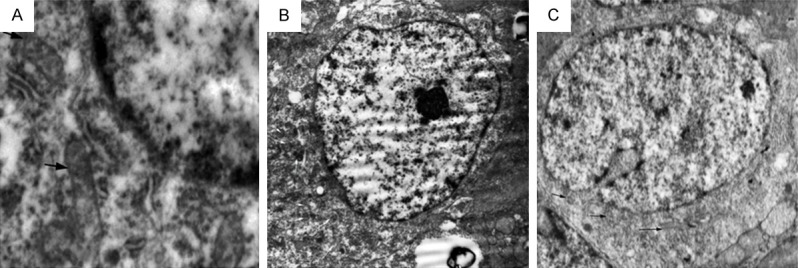
TEM of RGCs in control group (A), laser treatment group (24 weeks, B) without AAV-SOD2 therapy and laser treatment group with AAV-SOD2 (24 weeks, C). The solid black arrows and white arrows represented mitochondria in the perinuclear region, the shape was significantly different among three groups, mitochondria in control group showed big and long shape, while mitochondria in laser treatment group displayed round and small shape and clustered together. Both round- and long-shaped mitochondria were found in the RGCs of AAV-SOD2 group.
Activities of antioxidant enzymes and MDA content
A significant decrease in total SOD activity was detected in the retina at 4, 8, 12 and 24 weeks after laser treatment as compare to control group (total SOD activity 26.808±5.9056 U/mg prot, 19.1355±2.5848 U/mg prot, 13.8733±3.3034 U/mg prot, 9.4085±0.8049 U/mg prot, vs 50.7523±6.9422 U/mg prot [35]). The retinal CAT activity at different time points is shown in Figure 6A and 6B. A significant decrease in CAT activity was observed at 4, 8, 12 and 24 weeks after laser treatment when compared with control group (57.6754±16.1145 U/gprot, 21.0517±2.1508 U/gprot, 9.6028±1.0665 U/gprot, 6.5236±0.5934 U/gprot, vs 105.6523±6.2774 U/gprot) (P<0.01) (Figure 6C). MDA content of the retina at 4, 8, 12 and 24 weeks after laser treatment is shown in Figure 5C. A significant increase in MDA content was observed at 4, 8, 12 and 24 weeks after laser treatment as compared to control group (6.9482±0.7993 nmol/mgprot, 9.5244±0.5101 nmol/mgprot, 11.8377±0.2930 nmol/mgprot, 14.0435±0.1982 nmol/mgprot, vs 2.9966±0.5274 nmol/mgprot) (P<0.01) (Figure 6C). These findings indicate that antioxidant activity reduces significantly and MDA content increases markedly in laser treatment groups with IOP elevation. The antioxidant activity is still lower than in control group and the MDA content further increases even the IOP be-comes normal.
Figure 6.
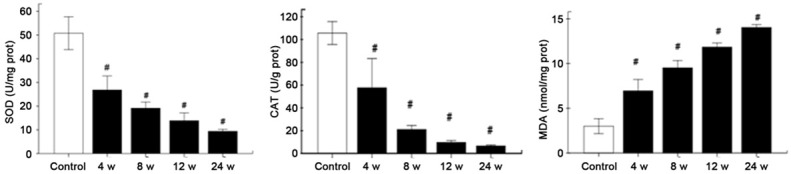
Total retinal SOD activity (A), CAT activity (B), and MDA content (C) in the eyes at 4, 8, 12 and 24 weeks after laser treatment. There were a significant decrease in SOD activity and CAT activity and a marked increase in MDA content at 4, 8, 12 and 24 weeks after laser treatment. (#P<0.05 vs control group).
AAV-SOD2 enhances SOD2 expression and attenuates damage to RGCs
The SOD2 protein expression in the retina was measured by Western Blot assay at 4 weeks after laser treatment (Figure 7). Our results showed the MnSOD protein expression in AAV-SOD2 group was higher than in control group (P<0.05), suggesting the successful transfection (Figure 7).
Figure 7.
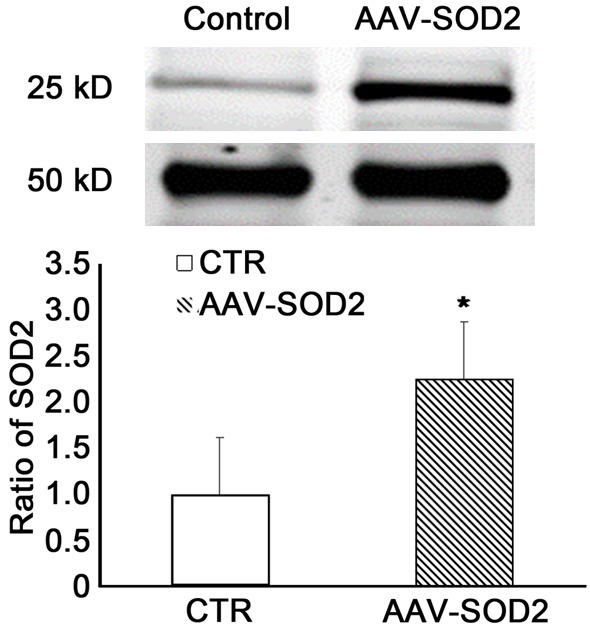
SOD2 expression in the retina of rats receiving AAV-SOD2 treatment. AAV-SOD2 or AAV-GFP was injected in one eye of each animal 21 days before chronic IOP elevation. The eyes were collected at 4, 8, 12 and 24 weeks after chronic IOP elevation, and SOD2 protein expression was detected by Western blot assay. Results showed the SOD2 expression significantly increased in AAV-SOD2 group as compared to control group (*P<0.05).
The mean density of Brn3 positive cells in the retina of AAV-SOD2 group was significantly higher than in laser treatment groups at 4, 8, 12 and 24 weeks (469.838±2.327, 376.49±20.868, 291.011±8.865, 218.645±2.636, respectively, vs 507.153±4.217, 465.784±9.77, 361.707±4.528, 302.098±14.486, respectively). (P<0.05), but still lower than in control group at different time points (618.026±20.98, 613.138±54.446, 630.544±52.524 and 609.442±43.456) (P<0.05) (Figure 4C).
In addition, the MDA content was also detected in the retina of AAV-SOD2 group. Results showed the MDA content reduced dramatically when compared with laser treatment groups although it was still higher than in control group (P<0.05) (Figure 8).
Figure 8.
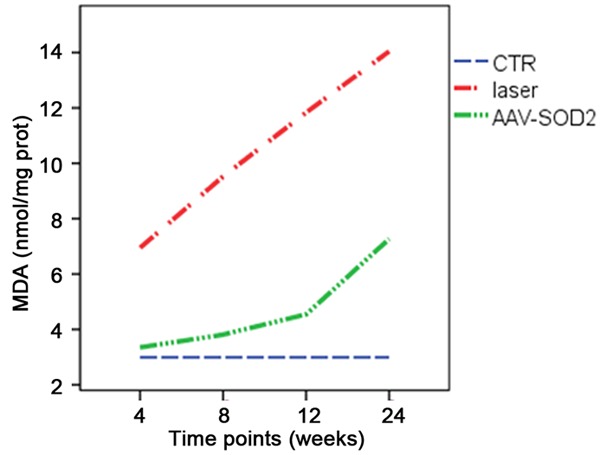
MDA content reduces significantly when compared with laser treatment groups although it was still higher than in control group.
Pathological examination showed mitochondrial had long and rod shape, and also round shape, as compared to small and round shape in the retina of laser treatment group (Figure 5C).
Then, the expressions of mitochondria-shaping proteins OPA1 and Drp-1 were detected to evaluate the functions of mitochondria. The two major OPA1 isoforms were detected in the retinas of rats (90 kDa, L; 80 kDa; Figure 9). OPA1 protein expression significantly decreased in laser-treated retina as compared to normal retinas (P<0.05). AAV-SOD2-treatment significantly increased OPA1 protein expression in laser-treated retina at 4 weeks as compared to control group, but it decreased at 12 and 24 weeks after laser treatment as compared to control group (P<0.05, Figure 9A-C). As shown in Figure 10, the Drp1 protein expression in the retina was significantly elevated after laser treatment as compared to control group, while AAV-SOD2 treatment decreased Drp1 protein expression at 4 and 8 weeks after laser treatment (P<0.05). q-PCR was employed to detect the mRNA expressions of for OPA1 and Drp-1 in the retina at 4, 12, and 24 weeks after laser treatment. Results showed OPA1 mRNA expression decreased at different time points, even though IOP returned to normal, and it was still significantly lower at 24 weeks after laser treatment as compared to control group (*P<0.05); After AAV-SOD2 treatment, OPA1 mRNA expression peaked at 4 weeks, and then decreased at 24 weeks, as compared to control group (*P<0.05). Drp1 mRNA expression in laser treatment groups increased significantly at 4, 12 and 24 weeks after laser treatment, as compared to control group (*P<0.05); AAV-SOD2 dramatically decreased Drp1 mRNA expression at 4 and 12 weeks after laser treatment (*P<0.05), but it was still higher than control group at 24 weeks after laser treatment (*P<0.05).
Figure 9.
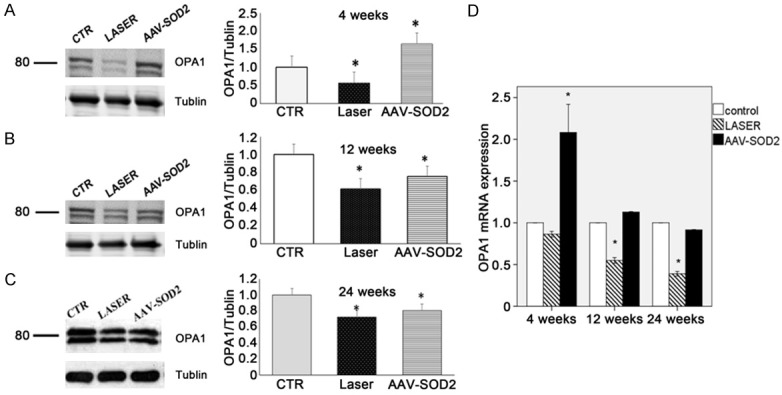
OPA1 expression in the retina with or without AAV-SOD2 injection at 4, 12, and 24 weeks after laser treatment (Western blot assay: A-C; real-time PCR: D). As compared to control group (CTR), the expressions of L and S isoforms of OPA1 decreased in laser group and AAV-SOD treatment group at 4, 12 and 24 weeks after laser treatment, while OPA1 protein expression in AAV-SOD2 group increased significantly at 4 weeks after laser treatment, but decreased at 12 and 24 weeks after laser treatment (*P<0.05). As compared to control group, OPA1 mRNA expression in laser group remained unchanged at 4 weeks after laser treatment (P>0.05), but decreased at 12 and 24 weeks after laser treatment; on the contrary, OPA1 mRNA expression in AAV-SOD2 group increased markedly at 4 weeks after laser treatment (*P<0.01).
Figure 10.
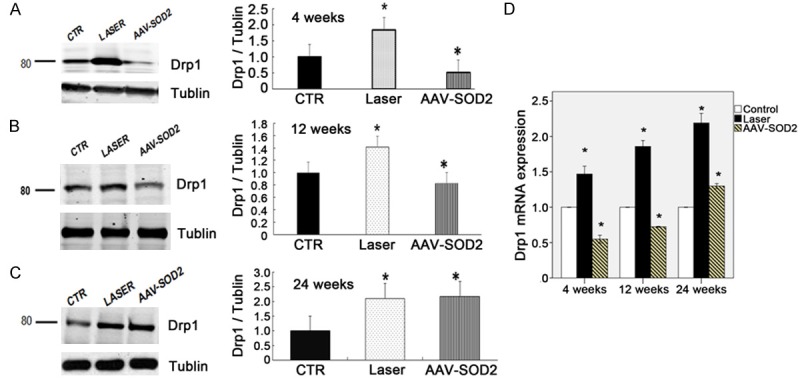
Drp1 expression in the retina with or without AAV-SOD2 injection at 4, 12, and 24 weeks after laser treatment (Western blot assay: A-C; real-time PCR: D). As compared to control group (CTR). The Drp1 protein expression increased in laser group at 4, 12 and 24 weeks after laser treatment, while Drp1 protein expression in AAV-SOD2 group decreased dramatically at 4 and 8 weeks after laser treatment, but increased significantly at 24 weeks after laser treatment (*P<0.05). As compared to control group, Drp1 mRNA expression in laser group increased significantly at 4, 12 and 24 weeks after laser treatment (*P<0.05); on the contrary, Drp1 mRNA expression in AAV-SOD2 group decreased markedly at 4 and 12 weeks after laser treatment (*P<0.05), but dramatically increased at 24 weeks after laser treatment (*P<0.05).
Discussion
In the present study, our results showed chronic IOP elevation (about 12 weeks) triggered oxidative stress and caused mitochondrial dysfunction of the rat retina, accompanied by RGCs death. Even when IOP returned to normal at 24 weeks, the oxidative stress and RGC death were still observed in the retina. Moreover, intravitreous injection of AAV-SOD2 significantly inhibited RGC death secondary to chronic IOP elevation by enhancing anti-oxidative enzyme expression/activity and reducing lipid peroxidation. These findings suggest that antioxidants can protect retinal cells, particularly RGCs, against IOP elevation induced damage to the glaucomatous retina.
Glaucoma is a chronic disease, and thus chronic IOP elevation animal model was established to mimic such condition in humans. A lot of methods have been used to establish the rat glaucoma model and each has its advantages and disadvantages. In this study, laser burns were employed to elevate IOP. This method may maintain the IOP elevation for a long time without invasive procedures. However, at 12 weeks, the IOP dropped to normal, which is similar to the time course found in previous studies [30]. Our results showed that chronic IOP elevation resulted in decrease in the anti-oxidative capacity and increase in lipid peroxidation, leading to the imbalance between anti-oxidation and oxidation. Lipid peroxidation products may affect a lot of molecules involved in essential signal transduction pathways, which is involved in the pathogenesis of some neurodegenerative diseases and various types of inflammation [38]. Moreover, in the present study, Brn3 positive cells decreased, even when IOP returned to normal at 12 weeks after laser treatment. It seems some memories to these cells under abnormal conditions: once IOP elevates, the damage to the neuronal cells in the retina will not stop regardless whether IOP recovers or not. These findings suggest a ‘metabolic memory phenomenon’ of the prior high IOP exposure and have demonstrated the importance of early IOP control in the progression of glaucoma.
In addition, the IOP elevation triggered oxidative stress in the retina, which is also seen in previous studies [11,39]. The mitochondria are the main source of reactive oxygen species (ROS) [15], in which the oxidative phosphorylation may result in electron leak, providing continuous formation of ROS, which can directly damage the mitochondria and other intracellular organelles [19]. Thus, we further investigated the relationship between IOP elevation and mitochondrial function. TEM showed mitochondria became round and smaller, suggesting that mitochondria are becoming more fragmented during and after IOP elevation. Then, the expressions of proteins related to the mitochondrial fusion and fission were detected in the retina. As compared to control group, OPA1 protein expression decreased, while the mean Drp1 protein expression increased in laser treatment groups. The balance between mitochondrial fusion and fission and its structure play a key role in the cell death. Thus, we speculate that the decrease in Brn3 positive cells following chronic IOP elevation may be related to the change in mitochondrial function characterized by the decreased OPA1 expression and increased Drp1 expression.
Growing evidence suggests that increased IOP may trigger oxidative stress in the retina, indicating that anti-oxidative therapy may be helpful for the prevention of neuronal degeneration in the retina [8]. Our results showed that intraocular injection of AAV-SOD2 dramatically elevated the expressions and activities of SOD2 and CAT and increased Brn3 positive cells in the retina after laser treatment. It means AAV mediated SOD2 therapy may protect the retinal cells from IOP elevation induced injury. Of note, MDA content did not return to normal even after AAV-SOD2 treatment and was still higher than in control group. This means AAV-SOD2 can not completely eliminate the oxidative stress and the protective effects of AAV-SOD2 can not maintain for a long time.
However, how mitochondrial fission happens during IOP elevation. There is evidence showing that Ca2+ may stimulate the oxidative phosphorylation and increase the electron transport chain activity, which elevate the ATP synthesis and cause mitochondrial dysfunction, resulting in cell apoptosis [40]. The specific mechanism is still unclear and required to be further studied.
Conclusions
In Conclusion, our results show that the chronic IOP elevation may cause abnormal morphology and dysfunction of the mitochondria in the retinal cells, which may be related to the change in the expression of proteins, associated with mitochondrial function and may cause the death of retinal cells. Moreover, AAV mediated SOD2 gene therapy may protect the retinal cells against chronic IOP elevation induced injury, which provides a promising strategy for the glaucoma therapy.
Acknowledgements
This study was supported by the National Natural Science Foundation of China (No. 30973260), Advanced Research Key Project of the Central South University (2010QZZD026), Program for New Century Excellent Talents in University and key project of China Hunan Science and Technology Department (No. 2013FJ2004). The authors thank professor Alfred S. Lewin for the AAV-SOD2.
Disclosure of conflict of interest
None.
References
- 1.Quigley HA, Broman AT. The number of people with glaucoma worldwide in 2010 and 2020. Br J Ophthalmol. 2006;90:262–267. doi: 10.1136/bjo.2005.081224. [DOI] [PMC free article] [PubMed] [Google Scholar]
- 2.Quigley HA. Number of people with glaucoma worldwide. Br J Ophthalmol. 1996;80:389–393. doi: 10.1136/bjo.80.5.389. [DOI] [PMC free article] [PubMed] [Google Scholar]
- 3.Bonomi L, Marchini G, Marraffa M, Bernardi P, De Franco I, Perfetti S, Varotto A, Tenna V. Prevalence of glaucoma and intraocular pressure distribution in a defined population. The Egna-Neumarkt Study. Ophthalmology. 1998;105:209–215. doi: 10.1016/s0161-6420(98)92665-3. [DOI] [PubMed] [Google Scholar]
- 4.Bonomi L, Marchini G, Marraffa M, Bernardi P, De Franco I, Perfetti S, Varotto A. Epidemiology of angle-closure glaucoma: prevalence, clinical types, and association with peripheral anterior chamber depth in the Egna-Neumarket Glaucoma Study. Ophthalmology. 2000;107:998–1003. doi: 10.1016/s0161-6420(00)00022-1. [DOI] [PubMed] [Google Scholar]
- 5.Quigley HA, Nickells RW, Kerrigan LA, Pease ME, Thibault DJ, Zack DJ. Retinal ganglion cell death in experimental glaucoma and after axotomy occurs by apoptosis. Invest Ophthalmol Vis Sci. 1995;36:774–786. [PubMed] [Google Scholar]
- 6.Mittag TW, Danias J, Pohorenec G, Yuan HM, Burakgazi E, Chalmers-Redman R, Podos SM, Tatton WG. Retinal damage after 3 to 4 months of elevated intraocular pressure in a rat glaucoma model. Invest Ophthalmol Vis Sci. 2000;41:3451–3459. [PubMed] [Google Scholar]
- 7.Garcia-Valenzuela E, Gorczyca W, Darzynkiewicz Z, Sharma SC. Apoptosis in adult retinal ganglion cells after axotomy. J Neurobiol. 1994;25:431–438. doi: 10.1002/neu.480250408. [DOI] [PubMed] [Google Scholar]
- 8.Munemasa Y, Kitaoka Y. Molecular mechanisms of retinal ganglion cell degeneration in glaucoma and future prospects for cell body and axonal protection. Front Cell Neurosci. 2012;6:60. doi: 10.3389/fncel.2012.00060. [DOI] [PMC free article] [PubMed] [Google Scholar]
- 9.Osborne NN, Schmidt KG. [Neuroprotection against glaucoma remains a concept] . Ophthalmologe. 2004;101:1087–1092. doi: 10.1007/s00347-004-1129-7. [DOI] [PubMed] [Google Scholar]
- 10.Yu DY, Cringle SJ, Balaratnasingam C, Morgan WH, Yu PK, Su EN. Retinal ganglion cells: Energetics, compartmentation, axonal transport, cytoskeletons and vulnerability. Prog Retin Eye Res. 2013;36:217–246. doi: 10.1016/j.preteyeres.2013.07.001. [DOI] [PubMed] [Google Scholar]
- 11.Ozdemir G, Tolun FI, Gul M, Imrek S. Retinal oxidative stress induced by intraocular hypertension in rats may be ameliorated by brimonidine treatment and N-acetyl cysteine supplementation. J Glaucoma. 2009;18:662–665. doi: 10.1097/IJG.0b013e31819c46b1. [DOI] [PubMed] [Google Scholar]
- 12.Moreno MC, Campanelli J, Sande P, Sanez DA, Keller Sarmiento MI, Rosenstein RE. Retinal oxidative stress induced by high intraocular pressure. Free Radic Biol Med. 2004;37:803–812. doi: 10.1016/j.freeradbiomed.2004.06.001. [DOI] [PubMed] [Google Scholar]
- 13.Kortuem K, Geiger LK, Levin LA. Differential susceptibility of retinal ganglion cells to reactive oxygen species. Invest Ophthalmol Vis Sci. 2000;41:3176–3182. [PubMed] [Google Scholar]
- 14.Organisciak DT, Darrow RM, Barsalou L, Darrow RA, Kutty RK, Kutty G, Wiggert B. Light history and age-related changes in retinal light damage. Invest Ophthalmol Vis Sci. 1998;39:1107–1116. [PubMed] [Google Scholar]
- 15.Lascaratos G, Garway-Heath DF, Willoughby CE, Chau KY, Schapira AH. Mitochondrial dysfunction in glaucoma: understanding genetic influences. Mitochondrion. 2012;12:202–212. doi: 10.1016/j.mito.2011.11.004. [DOI] [PubMed] [Google Scholar]
- 16.Chen H, Chan DC. Mitochondrial dynamics--fusion, fission, movement, and mitophagy--in neurodegenerative diseases. Hum Mol Genet. 2009;18:R169–176. doi: 10.1093/hmg/ddp326. [DOI] [PMC free article] [PubMed] [Google Scholar]
- 17.Liu Z, Sun L, Zhu L, Jia X, Li X, Jia H, Wang Y, Weber P, Long J, Liu J. Hydroxytyrosol protects retinal pigment epithelial cells from acrolein-induced oxidative stress and mitochondrial dysfunction. J Neurochem. 2007;103:2690–2700. doi: 10.1111/j.1471-4159.2007.04954.x. [DOI] [PMC free article] [PubMed] [Google Scholar]
- 18.Carelli V, La Morgia C, Valentino ML, Barboni P, Ross-Cisneros FN, Sadun AA. Retinal ganglion cell neurodegeneration in mitochondrial inherited disorders. Biochim Biophys Acta. 2009;1787:518–528. doi: 10.1016/j.bbabio.2009.02.024. [DOI] [PubMed] [Google Scholar]
- 19.McElnea EM, Quill B, Docherty NG, Irnaten M, Siah WF, Clark AF, O’Brien CJ, Wallace DM. Oxidative stress, mitochondrial dysfunction and calcium overload in human lamina cribrosa cells from glaucoma donors. Mol Vis. 2011;17:1182–1191. [PMC free article] [PubMed] [Google Scholar]
- 20.Uo T, Dworzak J, Kinoshita C, Inman DM, Kinoshita Y, Horner PJ, Morrison RS. Drp1 levels constitutively regulate mitochondrial dynamics and cell survival in cortical neurons. Exp Neurol. 2009;218:274–285. doi: 10.1016/j.expneurol.2009.05.010. [DOI] [PMC free article] [PubMed] [Google Scholar]
- 21.Park SW, Kim KY, Lindsey JD, Dai Y, Heo H, Nguyen DH, Ellisman MH, Weinreb RN, Ju WK. A selective inhibitor of drp1, mdivi-1, increases retinal ganglion cell survival in acute ischemic mouse retina. Invest Ophthalmol Vis Sci. 2011;52:2837–2843. doi: 10.1167/iovs.09-5010. [DOI] [PMC free article] [PubMed] [Google Scholar]
- 22.Chen B, Caballero S, Seo S, Grant MB, Lewin AS. Delivery of antioxidant enzyme genes to protect against ischemia/reperfusion-induced injury to retinal microvasculature. Invest Ophthalmol Vis Sci. 2009;50:5587–5595. doi: 10.1167/iovs.09-3633. [DOI] [PMC free article] [PubMed] [Google Scholar]
- 23.Liu Y, Tang L, Chen B. Effects of antioxidant gene therapy on retinal neurons and oxidative stress in a model of retinal ischemia/reperfusion. Free Radic Biol Med. 2012;52:909–915. doi: 10.1016/j.freeradbiomed.2011.12.013. [DOI] [PubMed] [Google Scholar]
- 24.Lin CH, Yu MC, Tung WH, Chen TT, Yu CC, Weng CM, Tsai YJ, Bai KJ, Hong CY, Chien MH, Chen BC. Connective tissue growth factor induces collagen I expression in human lung fibroblasts through the Rac1/MLK3/JNK/AP-1 pathway. Biochim Biophys Acta. 2013;1833:2823–33. doi: 10.1016/j.bbamcr.2013.07.016. [DOI] [PubMed] [Google Scholar]
- 25.Ju WK, Kim KY, Lindsey JD, Angert M, Duong-Polk KX, Scott RT, Kim JJ, Kukhmazov I, Ellisman MH, Perkins GA, Weinreb RN. Intraocular pressure elevation induces mitochondrial fission and triggers OPA1 release in glaucomatous optic nerve. Invest Ophthalmol Vis Sci. 2008;49:4903–4911. doi: 10.1167/iovs.07-1661. [DOI] [PMC free article] [PubMed] [Google Scholar]
- 26.Martinou JC, Youle RJ. Which came first, the cytochrome c release or the mitochondrial fission? Cell Death Differ. 2006;13:1291–1295. doi: 10.1038/sj.cdd.4401985. [DOI] [PubMed] [Google Scholar]
- 27.Dai Y, Weinreb RN, Kim KY, Nguyen D, Park S, Sun X, Lindsey JD, Ellisman MH, Ju WK. Inducible nitric oxide synthase-mediated alteration of mitochondrial OPA1 expression in ocular hypertensive rats. Invest Ophthalmol Vis Sci. 2011;52:2468–2476. doi: 10.1167/iovs.10-5873. [DOI] [PMC free article] [PubMed] [Google Scholar]
- 28.He Y, Ge J, Tombran-Tink J. Mitochondrial defects and dysfunction in calcium regulation in glaucomatous trabecular meshwork cells. Invest Ophthalmol Vis Sci. 2008;49:4912–4922. doi: 10.1167/iovs.08-2192. [DOI] [PubMed] [Google Scholar]
- 29.He Y, Leung KW, Zhang YH, Duan S, Zhong XF, Jiang RZ, Peng Z, Tombran-Tink J, Ge J. Mitochondrial complex I defect induces ROS release and degeneration in trabecular meshwork cells of POAG patients: protection by antioxidants. Invest Ophthalmol Vis Sci. 2008;49:1447–1458. doi: 10.1167/iovs.07-1361. [DOI] [PubMed] [Google Scholar]
- 30.Levkovitch-Verbin H, Quigley HA, Martin KR, Valenta D, Baumrind LA, Pease ME. Translimbal laser photocoagulation to the trabecular meshwork as a model of glaucoma in rats. Invest Ophthalmol Vis Sci. 2002;43:402–410. [PubMed] [Google Scholar]
- 31.Qi X, Lewin AS, Sun L, Hauswirth WW, Guy J. SOD2 gene transfer protects against optic neuropathy induced by deficiency of complex I. Ann Neurol. 2004;56:182–191. doi: 10.1002/ana.20175. [DOI] [PubMed] [Google Scholar]
- 32.Guy J, Qi X, Hauswirth WW. Adeno-associated viral-mediated catalase expression suppresses optic neuritis in experimental allergic encephalomyelitis. Proc Natl Acad Sci U S A. 1998;95:13847–13852. doi: 10.1073/pnas.95.23.13847. [DOI] [PMC free article] [PubMed] [Google Scholar]
- 33.Yoneda S, Tanihara H, Kido N, Honda Y, Goto W, Hara H, Miyawaki N. Interleukin-1beta mediates ischemic injury in the rat retina. Exp Eye Res. 2001;73:661–667. doi: 10.1006/exer.2001.1072. [DOI] [PubMed] [Google Scholar]
- 34.Leahy KM, Ornberg RL, Wang Y, Zhu Y, Gidday JM, Connor JR, Wax MB. Quantitative ex vivo detection of rodent retinal ganglion cells by immunolabeling Brn-3b. Exp Eye Res. 2004;79:131–140. doi: 10.1016/j.exer.2004.02.007. [DOI] [PubMed] [Google Scholar]
- 35.Chen B, Tang L. Protective effects of catalase on retinal ischemia/reperfusion injury in rats. Exp Eye Res. 2011;93:599–606. doi: 10.1016/j.exer.2011.07.007. [DOI] [PubMed] [Google Scholar]
- 36.Zhang JQ, Shen M, Zhu CC, Yu FX, Liu ZQ, Ally N, Sun SC, Li K, Liu HL. 3-Nitropropionic acid induces ovarian oxidative stress and impairs follicle in mouse. PLoS One. 2014;9:e86589. doi: 10.1371/journal.pone.0086589. [DOI] [PMC free article] [PubMed] [Google Scholar]
- 37.Liu L, Liu Y, Cui J, Liu H, Liu YB, Qiao WL, Sun H, Yan CD. Oxidative stress induces gastric submucosal arteriolar dysfunction in the elderly. World J Gastroenterol. 2013;19:9439–9446. doi: 10.3748/wjg.v19.i48.9439. [DOI] [PMC free article] [PubMed] [Google Scholar]
- 38.Choi SI, Yoo S, Lim JY, Hwang SW. Are sensory TRP channels biological alarms for lipid peroxidation? Int J Mol Sci. 2014;15:16430–16457. doi: 10.3390/ijms150916430. [DOI] [PMC free article] [PubMed] [Google Scholar]
- 39.Ghanem AA, Arafa LF, El-Baz A. Oxidative stress markers in patients with primary openangle glaucoma. Curr Eye Res. 2010;35:295–301. doi: 10.3109/02713680903548970. [DOI] [PubMed] [Google Scholar]
- 40.Glancy B, Balaban RS. Role of mitochondrial Ca2+ in the regulation of cellular energetics. Biochemistry. 2012;51:2959–2973. doi: 10.1021/bi2018909. [DOI] [PMC free article] [PubMed] [Google Scholar]