

Abstract
We have developed a high content 384-well, image-based assay to estimate the effect of compound treatment on Trypanosoma cruzi amastigotes in 3T3 fibroblasts. In the same well, the effect of compound activity on host cells can also be determined, as an initial indicator of cytotoxicity. This assay has been used to identify active compounds from an in-house library of compounds with either known biological activity or that are FDA approved, and separately, from the Medicines for Malaria Venture Malaria Box collection. Active compounds were screened against T. cruzi trypomastigotes, utilising an assay developed with the viability dye resazurin. Twelve compounds with reconfirmed solid sample activity, with IC50 values of less than 10 μM and selectivity indices to T. cruzi amastigotes over 3T3 host cells of between >22 and 319 times were identified from these libraries. As 3T3 cells are contact inhibited, with limited proliferation in the assay, selective compounds of interest were profiled in a separate assay to estimate the viability of compound treated, replicating HEK293 cells. Selective compounds that were not previously reported in the literature were further profiled by extending the incubation time against amastigote infected 3T3 cells to determine if there were residual amastigotes post-treatment, important for the consideration of the exposure time required for further biological characterisation. The assay development process and the suitability of identified compounds as hit molecules for Chagas disease research are discussed.
Keywords: Trypanosoma cruzi, Phenotypic screening, Image-based assay, Early drug discovery, MMV Malaria Box, Compound collections
Graphical abstract
Highlights
-
•
Image-based techniques to quantify compound activity against Trypanosoma cruzi.
-
•
Two fluorophores to accurately identify amastigote infection of host cells.
-
•
Selective hit compounds with a potential for further development are described.
1. Introduction
Chagas disease, caused by infection with the parasite Trypanosoma cruzi, is endemic to regions of Central and South America and estimated to cause 12,000 deaths per year (PAHO/WHO, 2015). The acute stage of the disease can go undiagnosed, however in many cases there is still morbidity and mortality (Teixeira et al., 2006). In the second, chronic stage, parasitism and inflammation of the heart and large colon can result in severe physiological effects, including megacolon and heart disease (Corbett et al., 2001, Rassi et al., 2000). Ten to 30% of individuals with a chronic stage infection develop cardiomyopathy leading to contractile dysfunction (Rassi et al., 2000) which may progress to sudden cardiac death (Rossi et al., 2010). There are 2 compounds that are currently used to treat Chagas disease, the nitroheterocyclic compounds benznidazole (BZ) and nifurtimox (NFX). There is some disagreement in the reported effectiveness of the use of these drugs to treat the chronic stage of the disease and both have associated toxicity (Castro et al., 2006). There was hope with some azole antifungal drugs that have undergone/are undergoing clinical trials for treatment of the chronic phase disease. However, there have been failures in clinical trials with posaconazole (Molina et al., 2014) and preliminary data from phase II clinical trials suggests E1224 (the pro-drug of ravuconazole) has less efficacy than BZ (Moraes et al., 2014). Based on the problems with current treatments and high failure rate of compounds in clinical trials, it is essential that new compounds that are active against T. cruzi are identified and evaluated for their potential to progress through the drug discovery pipeline.
The reported activity of compounds against the T. cruzi parasite has primarily been determined using either target-based or phenotypic approaches. Phenotypic based screens have the added benefit of exposing the whole organism and thus all targets and biological pathways to the compounds being tested. Phenotypic assays available for screening compounds against T. cruzi have been outlined in a recent review, including the preliminary application of an image-based approach we have developed to estimate compound activity against the amastigote form of the parasite (Sykes and Avery, 2013). More recently there has been an increase in reported image-based technologies using single fluorescent dye systems, such as the DNA markers DRAQ5™ (Alonso-Padilla et al., 2015) and DAPI (Neitz et al., 2015). Here we outline the development of an image-based assay to determine the effect of compounds against T. cruzi amastigotes, which is also capable of estimating the toxicity of compounds on host cells. The number of infected cells, over 7 fields per well, is estimated utilising a two dye system to accurately detect the borders of the cytoplasmic area of the host cell, a method not previously reported for determining compound activity against the parasite. A separate assay was also developed to identify compounds with activity against the trypomastigote form of the parasite measured by the redox indicator PrestoBlue. As the drugs that are currently used clinically to treat T. cruzi possess anti-trypomastigote activity (Faundez et al., 2005), it would be beneficial for new compounds to also exhibit anti-trypomastigote activity, however not entirely essential.
Both assays were optimised to be within the limits of detection of each screening technology. Important factors in the developmental process of the amastigote assay included determination of the growth (and life cycle) of the parasite and host in a 384-well plate, DMSO and drug sensitivity and script development that allowed for a reproducible and sensitive determination of the number of infected cells. Utilising application of the statistical measurement, the Z′-factor (Zhang et al., 1999), these assay formats have been shown to be reproducible. Collectively, these assay formats were considered ideal for screening compound libraries against T. cruzi for early drug discovery application.
To identify compounds with anti-T. cruzi activity, and to validate the image-based assay, an in-house library of 741 compounds, comprised of both FDA approved compounds and compounds with previously identified biological activity was screened against T. cruzi amastigotes. Repurposing of FDA approved compounds has been a recurring theme during recent years for many research areas and libraries containing known biological and FDA approved compounds have been profiled in T. cruzi phenotypic screens (Sykes and Avery, 2013). The Medicines for Malaria Venture (MMV) Malaria Box is a collection of 400 chemically diverse compounds comprised of 200 ‘probe-like’ and 200 ‘drug-like’ molecules with activity against the asexual form of the malaria parasite, Plasmodium falciparum (Spangenberg et al., 2013). This library has recently been screened against other protozoan parasites including T. cruzi, in a colorimetric, reporter gene-based assay (Kaiser et al., 2015). There have been examples of compounds that share activity across these parasites that could suggest common targets (Mishina et al., 2007, Ibrahim et al., 2011). Molecules with known anti-malarial activity may therefore represent an excellent starting point for identifying new chemical scaffolds with anti-trypanosomal activity. The outcomes of profiling a prototype of this library and the in-house library against T. cruzi are outlined. Selected compounds which did not clear all parasites from host cells at the maximum effect (Emax) concentration were further profiled in vitro to determine if an extended incubation increased compound efficacy. The development and application of these assays to identify compounds for early drug discovery are discussed.
2. Materials and methods
2.1. Maintenance of T. cruzi parasites
T. cruzi Tulahuen strain epimastigotes were provided by Professor Frederick Buckner (the University of Washington, USA). Trypomastigotes were induced by differentiation of parasites to metacyclic trypomastigotes in an artificial triatomine urine (Contreras et al., 1985). 3T3 host cells (mouse embryo fibroblast; ATCC CCL92) were maintained in RPMI (Life Technologies, CA, USA) with no phenol red, supplemented with 10% FCS (growth medium). Before infection with T. cruzi trypomastigotes, 3T3 cells were added to 25 cm2 flasks at 4 × 10⁵ cells/flask in growth medium with 100 IU/mL penicillin/streptomycin, and incubated for 24 h at 37 °C and 5% CO2. Trypomastigotes, from the supernatant of a previously infected culture of 3T3 cells, were added at a multiplicity of infection (MOI) of 10:1 trypomastigotes: host cells. Following 24 h incubation, trypomastigotes that had not infected host cells were washed off 3 times with PBS and replaced with fresh medium. Following 72 h further incubation, trypomastigotes released from the host cells were collected from the supernatant, centrifuged at 3000 g for 8 min, and diluted to either inoculate a new culture, or add to plates for assays.
2.2. Infection of 3T3 fibroblasts over 7 days in a 384-well plate
3T3 host cells in 50 μL of growth medium supplemented with 100 IU/mL penicillin/streptomycin were added to a 384-well collagen I coated plate (CellCarrier, Perkin Elmer, WA, USA), at 1 × 10³ cells/well. After 24 h, 10 μL of trypomastigotes were added to wells and incubated for 24 h before washing off 3 times with PBS. Based on the growth of 3T3 cells in-plate, it was estimated that host cells double between 0 and 24 h and the MOI for the addition of parasite to host cells was calculated accordingly. Parasites were added at MOI values of 10, 5 and 2:1 parasite to host cell. Parasites were enumerated at 3, 4, 5, 6 and 7 days of co-culture to assess the release of trypomastigotes. Infected host cells were counted following staining with Giemsa. Two wells per parasite concentration were enumerated to estimate infection, by scoring the number of infected cells per 200 host cells in a well.
2.3. Assay development to detect compound activity on T. cruzi amastigotes in 3T3 fibroblasts using the Operetta and Opera image-based systems
2.3.1. Script development and DMSO sensitivity
Host cells were added to plates at a density of 1 × 10³ cells/well in 50 μL of medium and half the plate was infected with a MOI of 10:1 parasite to host cell, in 10 μL of medum. To the other half, 10 μL of medium was added. Following 24 h incubation, parasites were washed off three times with PBS. To determine the DMSO tolerability of the cells, DMSO ranging from a final concentration of 1.60%–0.0002% was added in 5 μL of water. Three replicates of each dilution series were added to both infected and non-infected cells. Plates were incubated for 48 h, medium was removed and wells were washed before the addition of 20 μL of 4% paraformaldehyde. After 15 min incubation at room temperature, 20 μL of 0.01 mg/mL Hoechst 3342 (Invitrogen, USA), diluted in RPMI, containing 0.1% Triton X-100 (Sigma Aldrich, St Lois, MO, USA) were added and incubated for 30 min. Following, 0.05 μg/mL HCS CellMask Green™ (Invitrogen, USA) diluted in RMPI was added and incubated for 30 min. After a final wash, 20 μL of RPMI containing 100 IU/mL penicillin/streptomycin was added. Images were captured on an Operetta imaging system (PerkinElmer, Waltham, MA, USA), on the Hoechst 3342 and Alexa Fluor 488 channels, at 20× magnification.
A script was developed, using the building block commands in the Operetta Imaging system Harmony Software (PerkinElmer, USA). It was determined, by eye, which parameters within the building blocks best defined firstly a host cell nucleus, secondly a host cell cytoplasm, and finally spot detection script to identify amastigotes within the host cell. Two and 3 fields per well were read and the Z′-factor was calculated. This estimation was compared to the percentage of cells determined from staining infected wells with Giemsa and manually counted.
2.3.2. Automated liquid handler for HTS application
To optimise the assay format such that it was amenable to HTS, it was necessary to remove non-infected parasites, without disruption to the host cell layer. Additions of parasite and host cells to 384-well plates were made with a Multidrop liquid handler (Thermo Scientific, USA). Following 24 h infection, medium was removed from plates in a PC2 biosafety cabinet by inverting the plate into a plastic reservoir, followed by the addition of 50 μL of PBS with a Multidrop liquid handler. The volume was removed again by inverting the plate. Two wash steps were then undertaken on a Bravo liquid handler (Agilent, USA), by addition and removal of 50 μL of PBS. A 384-well, polypropylene plate (Corning, NY, USA) containing one third puromycin (8.26 mM) in water, a third NFX (3.28 mM) in 100% DMSO and a third DMSO (100%) was prepared, with 128 wells per compound/DMSO. This plate was diluted 1:21 in water in a clear, sterile plate (BD Biosciences, Franklin, NJ, USA) and 5 μL was added to the cell plate. The final concentrations in the assay were 30 μM, 12 μM and 0.37% for puromycin, NFX and DMSO respectively in the assay and this plate was used to calculate the Z′-factor. The concentrations of compounds and DMSO were based on a final volume of 65 μL, as following washes on the Bravo liquid handler, there was 10 μL of PBS remaining in wells. Following 48 h incubation, wells were stained and analysed on the Operetta imaging system. The script, taking images from either 3, 4 or 5 fields per well were compared. The percentage infection and the number of infected cells per well were examined.
2.3.3. Relationship of the MOI versus infected cells on the Operetta imaging system
The linearity of the number of infected cells in relation to the MOI used was determined on the Operetta. A plate containing MOI values from 40:1 parasite: host cell, down to an MOI calculated to be 0.312:1, with serial dilutions of 2:1 was prepared and analysed on the Operetta. There were 32 wells used to estimate infected and host cells for each MOI value.
2.3.4. Optimisation of the number of fields read on the Opera imaging system using a 5:1 MOI
Using the Assay Language Interface on the Opera confocal imaging system (PerkinElmer, Waltham, MA), the same protocol that was used to define infected host cells on the Operetta was applied. The only difference that 2 stacks per field of view (differing in a height of 2–4 μm), were taken and combined as some amastigotes appeared to be out of focus in one plane. For both imagers, the “building block” style in the analysis software allow for the same criteria to be applied to stained wells. Two plates were prepared containing infected 3T3 cells, with a third puromycin, NFX and DMSO. Using the same script as the Operetta imaging system, it was determined that imaging 5 fields per well did not result in a Z′- factor greater than 0.5, nominally used as the cut off to define good assay reproducibility (Zhang et al., 1999). A comparison of reproducibility from images taken from 5 to 7 fields per well were made. To determine if the identification of 5 amastigotes per cell was sufficient to reduce background spots from the spot analysis script, images taken from 7 fields in 64 infected wells were analysed and compared to the same number of non-infected cells using criteria varying from ≥1 spot per cell to ≥5 spots per cell as a cut off for the detection of an infected cell. The same wells were analysed for =1, 3, 4, 5, 6–10, 11–20, 21–30, 31–50, 51–100 and ≥101 spots per host cell.
2.3.5. Relationship of the MOI to infected cells on the Opera imaging system
One 384-well plate, containing MOI values ranging from 40:1 parasite: host cells, with 16 wells per treatment, to a MOI calculated to be 0.078:1 was processed and analysed on the Opera imaging system. Serial dilutions of 2:1 were prepared. There were 32 wells for each treatment used to estimate the number of infected host cells.
2.3.6. Optimised T. cruzi amastigote assay
Additions of parasite and host cells were made with a Multidrop plate dispenser (Thermo Scientific, Newington, NH, USA). 3T3 host cells were seeded into 384-well collagen coated plates (PerkinElmer, Waltham, MA, USA) at 1 × 10³ cells/well in 50 μL of growth medium supplemented with 100 IU/mL penicillin/streptomycin. For the primary screening of compound libraries, 2 × 10⁴ trypomastigotes per well were added in 10 μL of growth medium supplemented with 100 IU/mL penicillin/streptomycin, and plates were incubated for a further 24 h. This was equivalent to a 10:1 MOI parasite: host cells, considering that host cells approximately double over 24 hours. For determination of IC50 values, the concentration used was a 5:1 MOI, as assay linearity was improved in terms of the relationship between the MOI and the resultant number of host cells infected. This did not affect the sensitivity of the assay, in terms of the activity of reference compounds (see section 3, primary screening versus retest). To remove trypomastigotes that had not infected host cells the well volume was emptied into a reservoir containing a small volume of bleach solution, replaced with 50 μL of PBS and the well volume was removed again. Wells were washed twice on a Bravo liquid handler and 50 μL of growth medium supplemented with 100 IU/mL penicillin/streptomycin was replaced. Compounds in DMSO were pre-diluted 1:21 in water with a Minitrack liquid handler (PerkinElmer, USA) and 5 μL of this volume was added to assay plates. Plates were incubated for 48 h before fluorescent markers were added on the Bravo liquid handler. Wells were washed twice before the addition of 20 μL of 4% paraformaldehyde and incubated for 15 min at room temperature. Twenty μL of 0.01 mg/mL Hoechst 3348, diluted in RPMI with no FCS, containing 0.1% Triton X-100 was added and plates were incubated for 30 min. Wells were washed twice and 20 μL of 0.05 μg/mL HCS CellMask GreenTM in RMPI with no FCS was added, and incubated for 30 min. After washing, 20 μL of RPMI, no phenol red, containing 100 IU/mL penicillin/streptomycin was added. Plates could be stored up to 1–2 weeks at 4 °C prior to imaging.
Images were taken on an Opera High Content Imager, or an Operetta High Content imager. On the Opera, images were taken over seven positions in the well, with 2 stacks (differing in a height of 2 μm) per well position, whilst on the Operetta, 5 fields per well were imaged. For each field, one image was taken at 405 nm excitation 450/50 nm emission to capture the Hoechst stained nuclei, and another at 488 excitation and 540/75 emission to capture the HCS CellMask Green stained cytoplasm of the host cell. On the Opera, images were combined and analysed with the Assay Language Interface software and on the Operetta, images were analysed using Harmony. Firstly each script identified the host cell nucleus using the Hoechst image, by size exclusion of the parasite nuclei. The cytoplasm of the host cell was then identified by a cytoplasm detection script. Parasite nuclei appear as spots within the host cell cytoplasm and were detected by spot analysis. Host cells containing ≥5 spots were considered to be infected.
2.4. Trypomastigote assay: development and optimised assay format
The development and optimised protocol for the trypomastigote assay are outlined in the Supplementary Section (Figures S1–S2).
2.5. Screening of a chemical collection of compounds either FDA approved or with known biological activity
The compound collection was sourced from a variety of suppliers by in-house expert analysis of known drugs and compounds shown to have biological activity. The FDA compounds contained within the library are used for the treatment of a variety of indications, including antibacterials, antifungals, antipsychotics, anti-HIV and anticancer compounds. Compound stocks in 100% DMSO were stored in the Compounds Australia library facility (www.compoundsaustralia.com.au), housed within the Eskitis Institute for Drug Discovery. Concentrations of compounds in the library collection ranged between 1.7 and 23.1 mM in 100% DMSO. Compounds were screened in three doses in the amastigote assay, at the neat dose, and at 1:10 and 1:100 of the neat dose. Compounds displaying greater than 80% activity at the highest screening dose, with greater than 50% activity at a 1:10 dilution were retested on the Operetta image-based system, and in the trypomastigote assay. Compounds were retested in 15 point doses in duplicate, over N of 2 experiments, at a MOI of 5:1. Compounds considered active (<10 μM IC50 value) and selective (SI of >10) estimated at the highest dose screened) were purchased as solids for IC50 value determination. IC50 values of solid compound stock were determined from N of 4 experiments.
The positive control used to calculate activity against the host cells was puromycin, whilst for the amastigotes was NFX. The reproducibility, measured as the Z′-factor, was determined each time the assay was run, by including a plate containing a third final concentration of 0.37% DMSO, a third NFX at a final concentration of 12 μM and a third puromycin at a final concentration of 30 μM.
2.6. MMV Malaria Box primary screening
The Avery lab received a pilot collection, consisting of 685 compounds for evaluation. Dilution of stocks in DMSO were prepared at 5, 2.5 and 1.25 mM, to make final assay concentrations of 18.3, 9.2 and 4.6 μM and each plate was screened in duplicate. The positive controls were NFX and puromycin, whilst the negative control was 0.37% DMSO.
2.6.1. Retest of DMSO samples
Compounds exhibiting activity of >50% in duplicate at a final concentration of 18.3 μM, with associated activity of >50% at 9.2 μM were selected for retest in dose response to determine IC50 values. A separate group was also retested, with >50% activity exhibited at 18.3 μM, with single point, or no corresponding activity at 9.2 μM. Some compounds appeared to come out of solution in water at the highest dose of 18.3 μM, the initial dose for retesting compounds was reduced to 9.2 μM. Compounds were cherry-picked from 5 mM stocks in 100% DMSO and diluted in DMSO, to a working concentration of 2.5 mM. Compounds were diluted into 15 doses in 384-well plates (Axygen, USA), before dilution into water prior to addition in the assay. The final assay concentrations ranged from 9.2 μM to 0.0002 μM. Compounds were retested in two independent experiments. Image capture and analysis was undertaken on the Operetta image-based system, at 20× magnification.
Compounds that were considered active had an IC50 value of <10 μM, and if the IC50 could be determined against 3T3 cells, with a SI >10. If the IC50 value against 3T3 cells could not be determined, the SI was calculated by dividing the highest dose of 3T3 cells in the assay screened by the IC50 value of the compound against T. cruzi amastigotes.
2.6.2. Activity of resourced solid compounds
MMV666080 was purchased from Asinex (Winston-Salem, NC, USA), and MMV001230, MMV665909 and MMV665914 were purchased from Ambinter (Orleans, France). All of the probe-like compounds were purchased from Ambinter, except for MMV665941, which was purchased from Specs (Zoetermeer, The Netherlands). Compounds were prepared as 20 mM stocks in 100% DMSO, and diluted into a total of 15 doses in DMSO, ranging from a final concentration of 73 μM–0.002 μM in the amastigote assay, except for MMV666080, of which the highest concentration was 36.6 μM, due to poor solubility in DMSO at higher concentrations. Compounds were tested for activity in two independent experiments, in the amastigote and trypomastigote assays. NFX was used as a positive control to calculate the activity of compounds against both the trypomastigote and amastigote forms of T. cruzi and puromycin served as a positive control for 3T3 host cells. Compounds that were considered active had an IC50 value of <10 μM, and if SI was estimated at >10.
2.7. Residual amastigotes following compound treatment
At the Emax concentration, some amastigotes remained in host cells following 48 h treatment of T. cruzi infected fibroblasts with the azole antifungal, clotrimazole. Separately, the activity of the more clinically relevant antifungal compound, posaconazole (Molina et al., 2014) was determined against T. cruzi amastigotes, over 48 and 72 h, by increasing the incubation time and staining with the same fluorescent markers as in the amastigote image-based assay. As some parasites had already egressed from the host cells, plates were washed five times before staining with fluorescent dyes, to ensure in non-treated wells that the level of interference (with egressed parasite) was minimal. Posaconazole was screened in dose over N of 2 experiments, and the plateau of activity (maximum % inhibition, or Emax) was assessed for the presence of amastigotes. This same investigation was applied to MMV665914, MMV665994 and MMV001239.
2.8. Activity of selective compounds against HEK293 cells
The activity of CPX and the actives from the MMV library were determined against human embryonic kidney (HEK293) cells, over 2 independent experiments. A 30 μM concentration of puromycin was used as a positive control. Cells were harvested and diluted in high glucose DMEM supplemented with 10% FCS and 100 IU/mL penicillin/streptomycin, to a concentration of 7.27 × 10⁴ cells/mL. Fifty five microlitres of cells were added to black, clear bottomed 384-well lidded plates (BD Biosciences, USA) with a Multidrop liquid handler. Cells were incubated for 24 h before the addition of 5 μL of diluted compounds, with a Minitrak liquid handler, and plates were incubated for 48 h. Ten microlitres of a final concentration of 70 μM resazurin (Life Technologies, USA) was added to wells and plates were incubated for 3 h at 37 °C and 5% CO2, before reading on an Envision plate reader (PerkinElmer, USA) at an excitation of 530 nm and an emission of 595 nm.
2.9. Activity of CPX against sub-confluent 3T3 cells
3T3 cells were plated at concentrations between 1000 cells per well and 62 cells per well in 384-well collagen coated plates and incubated for 48 h. Plates were then treated in the same manner as described for the amastigote assay. The well volume was removed and wells were washed twice using the Bravo liquid handling system, before replacing a total volume of 50 μL of growth medium. A dose response series of CPX was added to the plate, in duplicate, for each cell concentration. A positive control of 30 μM of puromycin and negative control of 0.37% DMSO were added. Following a further 48 h incubation, ten microlitres of a final concentration of 70 μM of resazurin were added to wells and incubated for 3–6 h. By examining the relationship of the fluorescent signal to time, it was determined that following 4 h incubation, the resulting fluorescent signal was estimated to be within the linear range of detection for cell concentrations, except for 62 cells/well, which resulted in a poor signal. The IC50 value of CPX was therefore determined following 4 h incubation with resazurin and compared for 62, 125 and 1000 cells/well. The IC50 value of puromycin was also determined at these concentrations. Data was averaged from duplicate experiments.
3. Results
3.1. Infection of 3T3 fibroblasts over 7 days in a 384-well plate
Parasites cultured in 384-well plates began to egress from host cells 4 days after host cell infection, with expanded numbers of parasites seen on day 5. On day 4 there were 4.15 × 10⁵, 1.82 × 10⁵ and 4.25 × 10⁴ trypomastigotes/mL detected in the medium, from host cells infected with a MOI of 10:1, 5:1 and 2:1, respectively (Fig. 1A). There was a noticeable difference between the number of released parasites in the supernatant, both amastigotes and trypomastigotes, relative to the MOI used (Fig. 1A and B). There was an increase in the number of infected cells over time, with the majority of host cells infected on the seventh day after infection (Fig. 1C). Due to the release of parasites following 4 days post infection, the estimation of the number of infected cells was difficult following 7 days, as released/differentiated amastigotes observed from Giemsa staining remained on the surface of the plate at all of the MOI values tested. Hence, to define an infected cell, those host cells containing groups of 5 or more parasites, close to one another and within the host cell were estimated to be infected. There were no parasites released 3 days post infection with the MOI's investigated in these studies.
Fig. 1.

Growth of T. cruzi parasites in co-culture with 3T3 fibroblasts in 384-well collagen I coated plates following 3–7 days post infection. (A) trypomastigotes and (B) amastigotes in the supernatant and (C) the percentage of infected 3T3 fibroblasts, from a co-culture of 3T3 and T. cruzi in a 384-well plate. Data represents the mean and standard deviation of counts taken from the supernatant of duplicate flasks prepared for each MOI.
3.2. Assay development to detect compound activity on T. cruzi amastigotes in 3T3 fibroblasts using Operetta and Opera image-based systems
3.2.1. Script development and DMSO sensitivity
Each of the nuclear analysis building blocks available in the Harmony software interface were applied to the images of the cells and the script that best defined a host cell was determined. This was undertaken by eye. The Harmony software contains four separate scripts that define the nucleus of a cell, with cut offs that can be applied to the size, splitting factors to split one nucleus from another and contrast to sort identified nuclei based on the fluorescent intensity. The numbers to define criteria used in many of these script building blocks are arbitrary to the system and a process of applying each separately and visualising the defined objects was applied. In effect, the user “teaches” the system to define the object of interest. This process was repeated for detection of the cytoplasm. Spot analysis was optimised by comparing infected and non-infected host cells. Fig. 2 depicts the result of spot detection of T. cruzi parasites within the host cell and how this is visually able to separate parasite nuclei from host cell nuclei. Table 1 shows each of the building blocks, and the conditions that were applied within each building block of the Harmony analysis software to detect an infected cell. As there was a level of background with spot analysis in the non-infected cells, the script was modified such that ≥5 spots per cell defined an infected cell. This approach reduced the non-specific background detection, and thus was utilised for selection of infected cells. The number of host cells were identified in each well by exporting the number of objects defined from the Harmony script that contained a nucleus and cytoplasm that were co-localised. The number of infected cells was also exported, as those host cells that contained ≥5 spots within the cytoplasm.
Fig. 2.

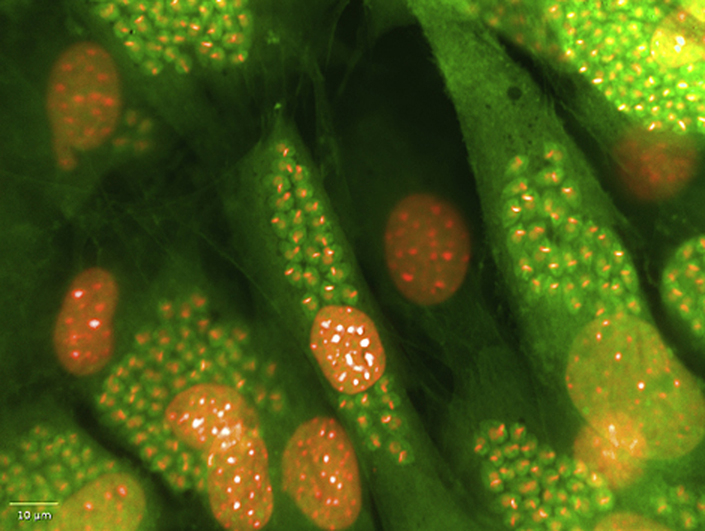
Analysis to determine a T. cruzi infected cell on the Operetta imaging system using building blocks in Harmony software. (A) Overlay of Hoechst and HCS CellMask Green fluorescent stains (B) Detection of the nucleus of host cells (C) Spot detection to define a parasite (one amastigote = 1 spot). (D) Expanded section of (C) to show the effectiveness of spot detection in identifying parasites within the host cell. P = parasite nucleus; H = Host cell nucleus. Scale bars represent 20 μm. (For interpretation of the references to colour in this figure legend, the reader is referred to the web version of this article.)
Table 1.
Function of the methods within the find region building blocks on the Opera and Operetta imaging systems contained within the amastigote assay script. The parameters used within the developed script to identify parasites within host cells are shown for each building block of nuclear, cytoplasm and spot analyses.
| Find region (method) | Method | Function | Parameters available | Parameter used |
|---|---|---|---|---|
| Nuclei (C) | Roundness | Estimates the roundness of the detected nuclei | −2 to 3 | 0.6 |
| Common threshold | The lower level of pixel intensity for the whole image that may belong to nuclei | 0–1 | 0 (no constriction) | |
| Area | Estimates the area of the detected nuclei | −100 to 200 | 80 | |
| Cytoplasm (A) | Common threshold | Parameter determining first guess borders of the cytoplasm | 0–1 | 0 (no constriction) |
| Cytoplasm (A) | Select cell region | Tuning the inner border, from nuclear to cell border | −200 to 100 | 50 |
| Spot detection (C) | Radius | Determines the radius of radius of spot-like features | 0–55 | 2.2 |
| Contrast | Determines how intense a spot must be to be detected | 0–1 | 0.13 | |
| Spot to region intensity | Sets a lower threshold for spot to cell intensity. The ratio of the spot peak intensity to the mean intensity of the cell region that is searched. | 0–10 | 1.6 |
When infected cells were enumerated with 2 fields per well, the Z′-factor was below 0.5, considered to be the cut-off to determine a robust assay (Zhang et al., 1999). Increasing the number of fields imaged per well to 3 increased the number of cells detected and improved the Z′-factor. The number of infected cells was 184 ± 0.658 and there were 582 ± 10.4 host cells, identified from infected wells. Therefore a mean of 31.6% cells were detected as infected by the criteria set. Giemsa staining of wells and manual counting of infected cells resulted in an estimated infection rate of 32.4%, confirming the precision of the Operetta script to identify T. cruzi infected cells. From an evaluation of wells containing non-infected cells, there were 539 ± 2.73 host cells. In non-infected cells, there were 3.92 ± 1.36 infected cells per well, detected using the script, thus displaying a low background from the spot analysis employed.
The potential impact of DMSO on both the host cells and parasites was investigated. A slight effect was observed on the number of host cells and consequently the number of parasites identified, when DMSO concentrations ≥ 0.8% were used (Fig. 3). Activities calculated at this dose, relative to non-infected cells, were 18.90 ± 4.90% and 25.94 ± 5.84% for detected parasites and host cells, respectively. Similarly there was an effect observed on host cells in non-infected wells, with an activity of 21.9 ± 7.20% observed with the addition of 0.8% DMSO.
Fig. 3.

The effect of DMSO concentration on (A) T. cruzi amastigotes in 3T3 host cells (B) total host cells detected using an Operetta image-based reader and Harmony analysis software. The percent activity was calculated in reference to wells containing no parasite. Error bars represent the standard deviation of measurements, from triplicate doses over two replicate plates, from one experiment.
3.2.2. Automated liquid handler for HTS application
By adjusting the pipette tips to ensure that they were as close as possible to the plate surface, some host cells were removed from the plate surface. However, by increasing the plate height, all of the trypomastigotes were not removed. A manual wash step was included, to compensate for the inability of the automated liquid handler to remove the whole well volume. Following automated steps, capturing 3 fields per well resulted in a Z′-factor of 0.49, close to the cut off of 0.5. By increasing the number of fields imaged per well to 5, the output of the mean number of infected cells was more statistically relevant and thus the Z′-factor was improved, to 0.55 (Fig. 4). A mean infection of 32.26 ± 5.46% per well was determined using this approach, from 2 independent experiments.
Fig. 4.

The number of captured images per well of T. cruzi infected 3T3 cells and the resulting parasite and host cell numbers and assay reproducibility on the Operetta. (A) number of infected cells and host cells and (B) the Z′- factor based on the number or percent of infected cells, or total host cells. 384 –well plates were analysed on the Operetta imaging system, at 20× magnification. Error bars represent the standard deviation of measurements, calculated from 128 wells, over one experiment.
3.2.3. Linearity of the assay using the Operetta image-based system
Using automated methods, the linearity of the assay was assessed, by infecting host cells with varying MOI's. Host cells containing differentiated trypomastigotes caused some loss of linearity at higher concentrations as the cells were not detected by the script as efficiently, due to trypomastigotes being tightly compact and not as amenable to spot detection. This was most noticeable at a 40:1 MOI. It is probable that the maximum number of infected cells may also be achieved at these MOI values (66% estimated at both 20:1 and 40:1 MOI). The linearity for both the Opera and Operetta image-based systems are shown in Fig. 5.
Fig. 5.

The linearity of the relationship between the MOI and the resulting number of T. cruzi infected 3T3 fibroblasts per well following 48 h post infection, determined on the Operetta and Opera image-based systems. (A) at 20–40:1 MOI, there appears to be a maximum number of host cells infected (B) a linear relationship was found up to a multiplicity of 5:1 parasite to host cell. Representative data is from one experiment, with 28 wells per MOI. R2 = 0.99.
3.2.4. Development of the assay on the Opera image-based system
The developed T. cruzi amastigote/host cell assay was optimized on the Opera Image-based system. The use of the Opera was undertaken to allow a more efficient high-throughput analysis of plates, with the ability to use more than one reader at a time, and this instrument is able to use an automated arm to read plates. Five or 7 fields within each well were imaged and compared on the Opera, as it was discovered that when images were taken from 5 fields per well, there was 60% less cells identified than on the Operetta. The field of view (FOV) is different between these imaging systems, although the camera size is the same. The FOV using a 20× water magnification on the Opera is 430× 345 μm2, whilst the FOV using 20× magnification on the Operetta is 675× 509 μm2, a difference of 43% between the machines. Therefore the difference in the FOV contributed to the difference in the host cell numbers observed. By increasing the number of fields taken per well to 7, the number of identified host cells was increased, therefore improving the reproducibility of the results obtained, resulting in a Z′-factor of 0.59 ± 0.01 for the amastigote assay and 0.81 ± 0.06 for detection of the 3T3 host cells.
A criteria of ≥5 spots per host cell cytoplasm was used to identify a T. cruzi amastigote infected cell. To determine whether the identification of ≥5 amastigotes per well was sufficient to lower or remove these background spots, images from 7 fields in one well were analysed with a cut-off of ≥5 spots to a minimum of ≥1 spot per cell. Fig. 6A shows that when a cut off of ≥1 parasite was used, that there was detection of infected cells in non-infected wells (91.25 ± 11.25 cells/well). This was confirmed by determining the number of infected cells in non-infected wells containing just one spot (70.21 ± 9.48 infected cells/well) (Fig. 6B). Increasing the cut off to ≥5 spots/cytoplasm decreased the number of infected cells per well to 1.57 ± 1.46 cells/well, without significantly decreasing the number of infected cells, in comparison to ≥4 spots per cell (Fig. 6B). Fig. 7 shows the final assay format as depicted on the Opera image-based system.
Fig. 6.

The number of spots used as a cut off to define a T. cruzi amastigote infected cell, using the Opera image-based system. (A) Criteria used were ≥1, ≥2, ≥4, ≥5 spots per host cell (B) Criteria used determined how many cells were detected as infected between =1 to ≥101 spots per host cell cytoplasm.
Fig. 7.

Identification of T. cruzi infected 3T3 cells using the Opera QEHS high-content imaging system. Images were taken at 20× water magnification. (A) infected host cells. Green represents the host cell cytoplasm detected with HCS CellMask Green. Blue depicts nuclear material from both host cells and parasite stained with Hoechst. (B) Definition of the cytoplasmic region of host cells in which spot detection of parasite nuclei is undertaken. (C) Spot detection to define parasite nuclei. (D) Application of script using the Opera assay language interface to define infected cells. Infected cells are green, red are non-infected. (E–H) follows the same definitions for (A–D), only that these are infected host cells that have been treated with 12 μM NFX for 48 h. (For interpretation of the references to colour in this figure legend, the reader is referred to the web version of this article.)
3.2.5. Relationship of the MOI to the number of infected cells on the Opera imaging system
The linearity of infection was retested on the Opera, using the conditions outlined as for the Operetta. This confirmed that the assay detection was linear, with respect to the number of infected cells per well, up to a 5:1 MOI. The linearity of the assay on both the Opera and Operetta image-based system are shown in Fig. 5.
3.3. Determination of the activity of a library of FDA approved compounds and compounds with known biological activity
Twenty seven compounds were re-screened in dose response, with 15 dilutions prepared from the neat dose, ranging from a final assay concentration of 16.1–29.7 μM, over N of 2 experimental replicates. 100% of compounds re-confirmed activity at the highest screening concentration, and 56% (15) of these compounds re-confirmed activity at the mid-dose. Six azole antifungals with selectivity against T. cruzi identified from this library have previously been reported (Sykes and Avery, 2013). We have included one azole antifungal, clotrimazole herein as an example of this class of compound and retested the activity from a fresh solid sample. The activity against the amastigote, host cell and trypomastigote, with the SI for each compound in relation to the amastigote to host cell are shown in Table 2, for 5 compounds which displayed an IC50 value of <10 μM against amastigotes. Solid samples of the compounds clotrimazole, ciclopirox olamine (CPX), camptothecin (Sigma Aldrich, USA) and clemastine fumarate (Sapphire Biosciences, Ann Arbor, MI, USA) were screened in dose response in the trypomastigote and amastigote assays, and the IC50 values against both parasite life cycle stages were estimated. The IC50 values for the reference compounds NFX and puromycin are shown in Table 2. The Z′-factor was greater than 0.5 for all of the plates tested. A one way ANOVA, undertaken in Prism 6.0 revealed that there was no significant difference in the IC50 values of the reference compounds NFX and puromycin determined for both primary and retest screening campaigns (P < 0.05).
Table 2.
Active compounds identified from a library containing compounds with known biological activity/are FDA approved compounds, against Trypanosoma cruzi amastigotes, trypomastigotes and the host cell 3T3. Classifications refer to compounds reported as active against specific diseases or are FDA approved as a treatment. The selectivity index (SI) of compounds refers to (the IC50 value of compounds against 3T3 fibroblasts, if attainable, or if not the highest dose tested against 3T3 cells)/(the IC50 value of compounds against the amastigote form of T. cruzi). Bold type represents activity of re-sourced solid samples of compound, tested in 4 independent experiments. The remainder of the IC50 values are from testing compounds from the compound library, stored in DMSO, over 2 independent experiments. NT = not tested. SD = standard deviation.* Control compounds were puromycin and NFX.
| Compound | Structure | Amastigote IC50 ± stdev (μM) | Host IC50 ± stdev (μM) | SI (3T3) | Trypomastigote activity |
|---|---|---|---|---|---|
| Antifungals | |||||
| Clotrimrazole HCl |  |
0.19 ± 0.04 | NA at 16.5 μM | >86.84 | NA at 19.5 μM |
| 0.17 ± 0.12 | 19% at 18.3 μM | >107.65 | NA at 21.6 μM | ||
| Ciclopirox Olamine |  |
5.37 ± 0.51 | 53% at 19.0 μM | >3.54 | 0.90 ± 0.22 |
| 3.90 ± 3.00 | 42% at 136.5 μM | >35.0 0.36a | 1.00 ± 0.49 | ||
| Other compounds | |||||
| Clemastine Fumarate |  |
0.76 ± 0.22 | NA at 21.6 μM | >28.42 | 80% at 25.5 μM |
| 0.29 ± 0.14 | 48% at 18.3 μM | >63.10 | 48% at 21.6 μM | ||
| Camptothecin |  |
0.34 ± 0.00 | 44% at 16.8 μM | >49.41 | NA at 19.9 μM |
| 0.09 ± 0.02 | 38% at 5.0 μM | >55.56 | NA at 5.9 μM | ||
| Sodium Mycophenolate |  |
0.90 ± 0.003b | 30% at 17.2 μM | >19.11 | NA at 20.3 μM |
| Control drugs | |||||
| *Nifurtimox |  |
0.69 ± 0.09 | 32% at 153.1 μM | 221.88 | 0.95 ± 0.33 |
| 0.81 ± 0.39 | 30% at 127.5 μM | >157.41 | 1.15 ± 0.46 | ||
| *Puromycin |  |
3.14 ± 0.17 | 3.04 ± 0.52 | 0.97 | 0.62 ± 0.09 |
| 1.58 ± 1.44 | 2.76 ± 0.69 | 1.75 | 0.56 ± 0.03 | ||
SI = selectivity index to 3T3 host cells. Activities in bold =results for solid sample. For the reference compounds, stock was always prepared from solid stock. Bold in this case refers to the activity of these compounds during retest of solid stocks of active compounds.
Selectivity index (SI) to HEK293 cells.
Sodium mycophenolate was not tested as a solid sample.
3.4. Malaria Box primary screening
Of 685 compounds tested, there were 10 compounds which exhibited >50% activity, in duplicate at 18.3 μM, with a corresponding activity of >50% at 9.2 μM in the T. cruzi amastigote assay. From the second group of compounds selected for retest, there were 13 compounds with >50% activity exhibited at 18.3 μM, with <50% activity displayed at 9.2 μM. The IC50 value of NFX against T. cruzi amastigotes was 0.764 μM, with no corresponding activity against host cells. Puromycin demonstrated an IC50 value against T. cruzi amastigotes of 2.35 μM and 2.29 μM against host cells.
3.4.1. Malaria Box retest
Of those compounds that were retested, 11 displayed an IC50 value against T. cruzi, with selectivity toward the parasite. Seven of these compounds were probe-like, and two of these were two batches of the same compound, MMV665594. Two compounds did not have a classification attributed to them in the MMV Malaria Box library. The identity of these compounds was determined in PubChem (https://pubchem.ncbi.nlm.nih.gov/search/search.cgi), by searching for the batch code. These compounds were STK700023, the azole antifungal clotrimazole, and STL088556, 9-aminoacridine, N′-(acridin-9-yl)-N,N-dimethylbenzene-1,4-diamine. Of the remaining compounds, MMV665941 also displayed activity against the trypomastigote (Table 3). As clotrimazole was already identified from the in-house library, results are not shown here. Four compounds were drug-like. Of these compounds, IC50 values ranged from 0.46 μM to 2.25 μM, with estimated SI values ranging from >4.09 to >19.9. Two of these compounds, MMV666080 and MMV665909 were also active against the trypomastigote life cycle form (Table 4). Compounds were re-tested as solid samples and all of the compounds reconfirmed as active, except for the compound STL088556 (Table 2, Table 3).
Table 3.
The activity of probe-like compounds from the MMV Malaria Box against Trypanosoma cruzi amastigotes, trypomastigotes, the host cell, 3T3 and HEK293 cells. *Compounds with no classification. The selectivity index (SI) of compounds is the highest dose tested against 3T3 host cells/the IC50 value of compounds against the amastigote form of T. cruzi. (1) two batches of the same compound. Data is from two independent experiments. SD = standard deviation.
| Compound name | Structure | T. cruzi amastigote IC50 (μM ± SD) | 3T3% activity highest dose or IC50 (μM ± SD) | IC50 HEK293 (μM ± SD) | IC50T. cruzi Trypomastigote (μM ± SD) | SI (3T3) |
|---|---|---|---|---|---|---|
| MMV665941 (crystal/gentian violet) |  |
0.09 ± 0.04 | 88% at 9.2 μM | NT | 0.84 ± 0.13 | >318.7 >6.52a |
| 0.23 ± 0.06 | 83% at 73.3 μM | 1.50 ± 0.73 | 1.60 ± 0.237 | |||
| MMV665994 |  |
0.66 ± 0.70 0.95±0.0051 | NA at 9.2 μM | NT | NA at 10.9 μM | >59.59 >64.55a |
| 1.23 ± 0.61 | NA at 73.3 μM | NA at 79.4 μM | 52% at 87 μM | |||
| MMV001239 |  |
0.86 ± 0.006 | NA at 9.2 μM | NT | NA at 10.9 μM | >20.65 >22.37a |
| 3.55 ± 2.36 | NA at 73.3 μM | NA at 79.4 μM | NA at 87 μM | |||
| MMV001241 |  |
1.34 ± 0.00884 | NA at 9.2 μM | NT | NA at 10.9 μM | >31.59 >34.22a |
| 2.32 ± 0.66 | NA at 73.3 μM | 44% at 79.4 μM | 87% at 87 μM | |||
| *STL088556 |  |
2.37 ± 1.51 | 30% at 9.2 μM | NT | 65% at 10.9 μM |
NA NAa |
| 62% at 73 μM | 62% at 73.3 μM | 115% at 79.4 μM | 8.88 ± 0.212 |
SI = selectivity index to 3T3 host cells. Stated for solid samples of compound. a: Selectivity (SI) of T. cruzi amastigotes to HEK293 cells 1. Duplicate samples of the same compound were identified in the library. Activities in bold = results for solid sample. For the reference compounds, stock was always prepared from solid stock. Bold in this case refers to the activity of these compounds during retest of solid stocks of active compounds.
Selectivity is based on the activity of solid samples.
* Compounds with no classification.
NA = not active.
NT = not tested.
Selectivity (SI) of T. cruzi amastigotes to HEK293 cells.
Table 4.
The activity of drug-like compounds from the MMV Malaria Box against Trypanosoma cruzi amastigotes, trypomastigotes, the host cell, 3T3 and HEK293 cells. Bold type represents activity of re-sourced solid samples of compound. All other activities relate to compounds stored in 100% DMSO. Solid samples of the compound were also tested against HEK293 as a secondary measurement of cytotoxicity. The selectivity index (SI) of compounds refers to (the IC50 value of compounds against 3T3 fibroblasts, if attainable, or if not the highest dose tested against 3T3 cells)/(the IC50 value of compounds against the amastigote form of T. cruzi). NA = not active. NT = not tested. SD = standard deviation. *Control compounds were puromycin and NFX.
| Compound name | Structure | T. cruzi amastigote IC50 (μM ± SD) | 3T3% activity highest dose or IC50 (μM ± SD) | IC50 HEK293 (μM ± SD) | IC50T. cruzi Trypomastigote (μM ± SD) | SI (3T3) |
|---|---|---|---|---|---|---|
| MMV001230 |  |
0.46 ± 0.01 | NA at 9.2 μM | NT | NA at 10.8 μM | >87.26 >94.52a |
| 0.84 ± 0.17 | NA at 73.3 μM | NA at 79.4 μM | 96% at 86.5 μM | |||
| MMV666080 |  |
0.69 ± 0.79 | 40% at 9.2 μM | NT | 0.90 ± 0.06 | >25.77 2.03a |
| 1.42 ± 0.99 | 34% at 36.6 μM | 2.88 ± 0.90 | 0.52 ± 0.04 | |||
| MMV665909 |  |
1.02 ± 0.88 | 35% at 9.2 μM | NT | 1.08 ± 0.01 | >56.82 1.53a |
| 1.29 ± 0.13 | 44% at 73.3 μM | 1.97 ± 0.65 | 1.05 ± 0.13 | |||
| MMV665914 |  |
2.25 ± 0.31 | 25% at 9.2 μM | NT | NA at 10.8 μM | >42.37 >45.90a |
| 1.73 ± 0.19 | NA at 73.3 μM | NA at 79.4 μM | 65% at 86.5 μM | |||
| *Puromycin |  |
2.54 ± 0.13 | 3.39 ± 0.28 | NT | 0.505 ± 0.0849 |
1.48 0.12a |
| 2.26 ± 0.03 | 3.35 ± 0.12 | 0.28 ± 0.04 | 0.44 ± 0.63 | |||
| *NFX |  |
0.59 ± 0.10 | NA% at 127.5 μM | NT | 1.09 ± 0.433 | >231.8 >251.1a |
| 0.55 ± 0.02 | NA% at 127.5 μM | NA at 138.1 μM | 1.25 ± 0.01 |
SI = selectivity index to 3T3 host cells. Stated for solid samples of compound.
Activities in bold = results for solid sample. For the reference compounds, stock was always prepared from solid stock. Bold in this case refers to the activity of these compounds during retest of solid stocks of active compounds.
NA = not active.
NT = not tested.
Selectivity is based on the activity of solid samples.
Selectivity (SI) of T. cruzi amastigotes to HEK293 cells.
3.5. Activity of CPX against HEK293 cells
CPX, from the in house library and the 8 active MMV compounds were tested against HEK293 cells. CPX displayed an IC50 value of 1.4 ± 1.07 μM, therefore representing a selectivity index (SI) of 0.36 (Table 2). MMV665941, MMV666080 and MMV665909 displayed activity against HEK293 cells, also resulting in selectivity indexes of <10, indicating that these compounds may have toxicity issues.
3.6. Activity of CPX against sub-confluent 3T3 cells
The IC50 value of CPX was determined for 3T3 cells at seeding densities of 1000, 250 and 125 cells per well. CPX displayed activity of 38% at 73 μM using a seeding density of 1000 cells per well and IC50 values of 5.98 ± 1.0 μM and 3.23 ± 0.485 μM with seeding densities of 250 and 125 cells per well, respectively. Puromycin exhibited an IC50 value against host 3T3 cells at a density of 1000 cells per well of 5.88 ± 0.85 μM IC50 values of 4.69 ± 0.13 μM and 3.49 ± 0.64 μM using 250 and 125 cells per mL, respectively.
3.7. Residual amastigotes following compound treatment
Following 48 h incubation with clotrimazole, there were amastigotes that appeared to remain at the Emax concentration of this compound (Figure S3). To determine if this was the case for a clinically relevant compound with activity against T. cruzi, the activity of the antifungal compound posaconazole was determined against T. cruzi amastigotes, following 48 and 72 h exposure. To identify activity following 72 h exposure, parasites were stained and analysed using the same protocol outlined for the 48 h image-based assay. As some parasites had egressed from cells, there were released trypomastigotes and amastigotes that were not contained within host cells, however the script was able to estimate infected cells (Figure S4). There was no change in the IC50 value of posaconazole between 48 and 72 h, estimated to be 0.006 ± 0.0006 μM following 48 h exposure and 0.0049 ± 0.0036 μM following 72 h. Although there was a decrease in the total number of infected cells, not all parasites were removed from host cells, with 76% and 94% inhibition following 48 and 72 h incubation, respectively. The presence of a small number of amastigotes could be seen following treatment with an Emax of 50 nM (Figure S5), whereas no parasites were seen following 48 or 72 h treatment with 12 μM NFX.
Prioritised compounds from the Malaria Box, MMV665914, MMV665994 and MMV001239 were incubated in a dose series for both 48 and 72 h and residual spots within host cells at the Emax concentration of compounds (estimated at 18 μM) were scored. MMV665914 and MMV665994 removed 97% of infections at 18 μM following 48 h incubation and MMV001239 removed 90%. In each case, by eye there were small populations of what appeared to be amastigotes that could be seen. Following 72 h incubation, both MMV665914 and MMV665994 removed 99% of parasites and MMV001239 removed 96%.
4. Discussion
From the studies undertaken, the successful development of a sensitive, 384-well image-based assay to estimate compound activity on the amastigote form of the Tulahuen strain of T. cruzi in 3T3 host cells has been developed and optimised. Factors that were considered to be important to the reproducibility and reliability of the application of this assay included determination of the parasite life cycle in a 384-well plate, DMSO sensitivity, wash steps to remove trypomastigotes post-infection and script development to minimise the false detection of amastigotes utilising a spot analysis based algorithm. During investigation of the life cycle of parasites in-plate, following 7 days incubation post-infection, there were a significant number of amastigotes on the surface of the plate, even following washing out of the medium. As parasites began to egress 4 days post infection, this allowed for an assay to extend to 3 days from the addition of trypomastigotes. Compound exposure following wash off of trypomastigotes was therefore for a total of 48 h. Other authors have used 72 h incubation of T. cruzi infected cells with compounds in image-based formats, although these were utilising different strains of T. cruzi and host cells, and the parasite life cycle in the plate was not reported (Engel et al., 2010, Alonso-Padilla et al., 2015, Moraes et al., 2014).
The DMSO tolerability of the amastigote assay was determined, important for the optimal health of the parasite and host cells during compound incubation. The maximum concentration of DMSO tolerated by T. cruzi amastigotes and 3T3 fibroblasts at a MOI of 10:1 parasite: host cell was 0.37% DMSO, with 0.43% DMSO not affecting the viability of trypomastigotes (results not shown). Both assays developed demonstrated a linear relationship between the T. cruzi trypomastigote inoculum and the resulting detection of parasites. The linearity of detection was optimised for each assay, resulting in a Pearson correlation coefficient of determination (R2) of 0.99 for the detection of parasite infected 3T3 cells; and trypomastigotes.
The minimal detection of amastigotes on the Opera image-based system was defined, imperative to reducing false spot detection, or background, that could result in an over estimation of infected cells. It is of importance to be able to define small numbers of parasites within host cells following compound treatment, as surviving parasites could continue the infective cycle. From screening an in-house library, it was determined that the azole antifungal, clotrimazole, exhibited low efficacy at the Emax against T. cruzi amastigotes following 48 h incubation. Posaconazole, a compound that has recently failed to show efficacy in clinical trials against the chronic phase of Chagas (Molina et al., 2014), was subsequently tested over 48 and 72 h treatment of T. cruzi infected cells and also failed to remove the whole parasite population, with 76% and 94% of parasites removed from host cells, respectively. This could be due to the fact that several cell divisions are required before inhibition and cell death occur with CYP51 treatment of T. cruzi (Neitz et al., 2015). Posaconazole has been recently shown to similarly be sub-efficacious at high concentrations in vitro utilising the DNA marker DRAQ5 to identify Tulahuen strain parasites in U2OS cells following 96 h treatment, in which parasites were reduced by 93% (Moraes et al., 2014). Posaconazole also only reduced Y strain infection to 84% following 72 h exposure and approximately 60% after exposure to 80 nM of compound for 48 h (Moraes et al., 2014). Both image-based assays highlight this effect, which had not previously been reported with image-based or reporter gene methods to identify T. cruzi infection in vitro. This emphasises the importance of using sensitive methods, with time-course exposures to investigate the efficacy of compounds. A benefit of identifying this sub-efficacious effect is that slow-acting compounds could be de-prioritised in screening campaigns if there are faster acting/more effective compounds. Also, the T. cruzi drug discovery pipeline is well populated with CYP51 inhibitors (Pena et al., 2015), which could promote de-prioritisation of this chemical class of compound. The image-based assay however could be used to screen a combination of (sub-efficacious) inhibitors such as posaconazole with other active compounds, to identify if there is a synergistic effect of compound action (Fügi et al., 2015). A medicinal chemistry effort could potentially improve efficacy, dependent upon if it were an intrinsic target problem or could be overcome, as other factors such as solubility may also cause this effect.
From the in-house library that was profiled, non-antifungal compounds that were identified from initial screening against amastigotes, with an IC50 value of <10 μM and demonstrated selectivity, were sodium mycophenolate, clemastine fumarate and camptothecin. Immunosuppressive therapy with mycophenolate, used for heart transplants for patients with chronic Chagas disease, has been associated with an increase in reactivation of the disease therefore leading to a high risk with this compound (Bestetti et al., 2007, Campos et al., 2008, Marchiori et al., 2007). Camptothecin was identified as a lead against T. cruzi some years ago (Bodley and Shapiro 1995), however poor solubility, rapid inactivation and cytotoxicity which has been shown for this compound in human trials as an anticancer drug candidate, have hindered its further development (Li et al., 2006). Clemastine fumarate has recently been identified in the literature as active against T. cruzi however failed to show activity in an in vivo model of acute infection (Planer et al., 2014). There were a number of other antihistamines, both first and second generation (21 in total, results not shown) also screened in this library and there were no others that were active against T. cruzi in the amastigote assay. This compound may have a novel mode of action against T. cruzi amastigotes in vitro and in the future, identification of this target may warrant further investigation. The activity of these compounds highlights the ability of the assay to identify compounds that have historically shown activity against T. cruzi, supporting the use of this assay to profile compounds against the parasite.
The non-azole antifungal, CPX, showed novel activity against T. cruzi with an IC50 value of 3.9 μM against T. cruzi amastigotes and 1 μM against trypomastigotes following the retest of solid sample. However, this compound displayed activity against HEK293 cells and sub-confluent 3T3 cells, detected with resazurin. The mode of action against host cells may therefore be related to cell division/metabolism and potential toxicity remains an issue for this compound. This highlights the benefit of the use of proliferation assays when considering compound activity against infected, contact inhibited cells or non-dividing cells such as macrophages. Compounds that effect replication or cell multiplication for instance will not be detected by exposure to differentiated THP1 cells (Siqueira-Neto et al., 2012). Here, activity against 3T3 cells stands as an initial determination of cytotoxicity. In drug discovery programs, it is common to employ a panel of mammalian cells when considering the potential toxicity of a compound (Sarver et al., 2012). This is particularly important in Chagas disease, whereby the safety and tolerability of current drugs is an issue.
Of those compounds determined to be active from the MMV Malaria Box collection screened, MMV001230, MMV665909, MMV001241 and MMV666080 have recently been identified as hits against T. cruzi (Kaiser et al., 2015). An in vitro assay was used to profile the activity of Malaria Box, in which the parasite used to infect cells was transfected with a β-galactosidase reporter gene, and activity was assessed utilising a colorimetric readout. There were similar levels of activity for a majority of common compounds estimated by both assays although notably, MMV666080 was less active in the image-based assay against T. cruzi amastigotes (1.42 μM versus <0.13 μM in the reporter gene assay). Differences between the results obtained for this compound may be related to the increased time of incubation and therefore also the T. cruzi life cycle stages exposed, as there are 7 days incubation post infection in the β-galactosidase assay. There may also be a differential effect on T. cruzi MRC-5 infected cells or on the assay technology itself. This is always a consideration when comparing different assay formats. MMV666080, MMV665909; and also MMV665941 were found to be active against HEK293 cells and similar to CPX, could have an effect against cell division/other mammalian cells which supports the use of the estimation of cytotoxic effects to prioritise compounds.
There were three selective compounds, MMV665914, MMV665994 and MMV001239 that were identified here that remain as hit compounds for further investigation. Reported biological activity, along with those of related substructures, were identified in SciFinder (http://www.cas.org/products/scifinder). MMV665914, 4-chloro-N-(2-(4-(2-methoxyphenyl)piperazin-1-yl)-2-(pyridin-3yl) ethyl) benzene sulfonamide returned no related literature or similar substructures. Based on the phenyl piperazine structure embedded within this molecule, it could possess ion channel agonism or antagonism properties (Martin, 1985, Swanson et al., 2005), although the presence of a pyridyl moiety could also suggest that this may inhibit CYP51, as pyridine containing compounds have been shown previously to be active against T. cruzi CYP51 (Chen et al., 2009, Hargrove et al., 2013). However, 97% of parasites were removed following 48 h incubation (at 18 μM), and 99% at 72 h, suggesting this compound was more efficient than the CYP51 inhibitors posaconazole and clotrimazole at reducing the parasite load from host cells. MMV665994, 3-(3,3-Dichloro-2-propen-1-yl)-2-methyl-4(1H)-quinolinone, is a quinolinone-based compound, with two similar substructures reported in the literature, of which one was a potential suppressant of inhibition of bacterial lysozymes (Voet et al., 2011). The lack of other specific target-based publications for this class of compound does not necessarily support this as a mode of action. MMV001239, 4-cyano-N-(5-methoxy-1,3-benzothiazol-2-yl)-N-(pyridin-3-ylmethyl)benzamide is not reported in publications in relation to biological activity. As there was no cytotoxicity detected against either 3T3 or HEK 293 cells, this compound could be investigated further. Considering the pyridyl motif contained within this compound, it could again be possible that this is a CYP51 inhibitor. Ninety percent of infected cells were removed following 48 h and 96% were removed following 72 h incubation, therefore this compound is most likely slow acting, although more efficacious at the Emax than posaconazole and clotrimazole after a 48 h incubation period in vitro.
The image-based assay described is reproducible and has been successful in identifying a number of compounds that have already been reported in the literature with activity against T. cruzi, describing the sensitivity of this format. In addition to this, the assay has the advantage of determining the presence of low levels of amastigotes following compound treatment, important for the potential pharmacological consideration of compounds. We are currently investigating viability probes and wash off assays to determine if these remaining amastigotes are viable. Alongside supporting the use of this assay to profile the activity of compounds against T. cruzi, we also report those compounds that can be considered for further biological and chemical profiling.
Acknowledgements
The authors would like to thank Professor Frederick Buckner, from the University of Washington, for supplying the T. cruzi epimastigote stocks of T. cruzi, Dr Victor Contreras from the Universidad de Carabobo for his aid with T. cruzi differentiation protocols from epimastigotes to metacyclic trypomastigotes and Dr Graeme Stevenson from the Eskitis Institute for Drug Discovery for his advice on chemical classes and structures. This work was supported by a Griffith University Postgraduate Research Scholarship.
Footnotes
Supplementary data related to this article can be found at http://dx.doi.org/10.1016/j.ijpddr.2015.10.001.
Appendix A. Supplementary data
The following is the supplementary data related to this article:
References
- Alonso-Padilla J., Cotillo I., Presa J.L., Cantizani J., Pena I., Bardera A.I., Martin J.J., Rodriguez A. Automated high-content assay for compounds selectively toxic to Trypanosoma cruzi in a myoblastic cell line. PLoS Negl. Trop. Dis. 2015;9:e0003493. doi: 10.1371/journal.pntd.0003493. [DOI] [PMC free article] [PubMed] [Google Scholar]
- Bestetti R.B., Souza T.R., Lima M.F., Theodoropoulos T.A., Cordeiro J.A., Burdmann E.A. Effects of a mycophenolate mofetil-based immunosuppressive regimen in Chagas' heart transplant recipients. Transplantation. 2007;84:441–442. doi: 10.1097/01.tp.0000277526.68754.02. [DOI] [PubMed] [Google Scholar]
- Bodley A.L., Shapiro T.A. Molecular and cytotoxic effects of camptothecin, a topoisomerase I inhibitor, on trypanosomes and Leishmania. Proc. Natl. Acad. Sci. U. S. A. 1995;92:3726–3730. doi: 10.1073/pnas.92.9.3726. [DOI] [PMC free article] [PubMed] [Google Scholar]
- Campos S.V., Strabelli T.M., Amato Neto V., Silva C.P., Bacal F., Bocchi E.A., Stolf N.A. Risk factors for Chagas' disease reactivation after heart transplantation. J. Heart Lung Transpl. 2008;27:597–602. doi: 10.1016/j.healun.2008.02.017. [DOI] [PubMed] [Google Scholar]
- Castro J.A., de Mecca M.M., Bartel L.C. Toxic side effects of drugs used to treat Chagas' disease (American trypanosomiasis) Hum. Exp. Toxicol. 2006;25:471–479. doi: 10.1191/0960327106het653oa. [DOI] [PubMed] [Google Scholar]
- Chen C.K., Doyle P.S., Yermalitskaya L.V., Mackey Z.B., Ang K.K., McKerrow J.H., Podust L.M. Trypanosoma cruzi CYP51 inhibitor derived from a Mycobacterium tuberculosis screen hit. PLoS Negl. Trop. Dis. 2009;3:e372. doi: 10.1371/journal.pntd.0000372. [DOI] [PMC free article] [PubMed] [Google Scholar]
- Contreras V.T., Salles J.M., Thomas N., Morel C.M., Goldenberg S. In vitro differentiation of Trypanosoma cruzi under chemically defined conditions. Mol. Biochem. Parasitol. 1985;16:315–327. doi: 10.1016/0166-6851(85)90073-8. [DOI] [PubMed] [Google Scholar]
- Corbett C.E., Ribeiro U., Jr., Prianti M.G., Habr-Gama A., Okumura M., Gama-Rodrigues J. Cell-mediated immune response in megacolon from patients with chronic Chagas' disease. Dis. Colon Rectum. 2001;44:993–998. doi: 10.1007/BF02235488. [DOI] [PubMed] [Google Scholar]
- Engel J.C., Ang K.K., Chen S., Arkin M.R., McKerrow J.H., Doyle P.S. Image-based high-throughput drug screening targeting the intracellular stage of Trypanosoma cruzi, the agent of Chagas' disease. Antimicrob. Agents Chemother. 2010;54:3326–3334. doi: 10.1128/AAC.01777-09. [DOI] [PMC free article] [PubMed] [Google Scholar]
- Faundez M., Pino L., Letelier P., Ortiz C., Lopez R., Seguel C., Ferreira J., Pavani M., Morello A., Maya J.D. Buthionine sulfoximine increases the toxicity of nifurtimox and benznidazole to Trypanosoma cruzi. Antimicrob. Agents Chemother. 2005;49:126–130. doi: 10.1128/AAC.49.1.126-130.2005. [DOI] [PMC free article] [PubMed] [Google Scholar]
- Fügi M.K., Tanner M., Schneiter M., Mäser R., Guan P. Match-making for posaconazole through systems thinking. Trends Parasitol. 2015;31:46–51. doi: 10.1016/j.pt.2014.11.004. [DOI] [PubMed] [Google Scholar]
- Hargrove T.Y., Wawrzak Z., Alexander P.W., Chaplin J.H., Keenan M., Charman S.A., Perez C.J., Waterman M.R., Chatelain E., Lepesheva G.I. Complexes of Trypanosoma cruzi sterol 14alpha-demethylase (CYP51) with two pyridine-based drug candidates for Chagas disease: structural basis for pathogen selectivity. J. Biol. Chem. 2013;288:31602–31615. doi: 10.1074/jbc.M113.497990. [DOI] [PMC free article] [PubMed] [Google Scholar]
- Ibrahim H.M., Al-Salabi M.I., El Sabbagh N., Quashie N.B., Alkhaldi A.A., Escale R., Smith T.K., Vial H.J., de Koning H.P. Symmetrical choline-derived dications display strong anti-kinetoplastid activity. J. Antimicrob. Chemother. 2011;66:111–125. doi: 10.1093/jac/dkq401. [DOI] [PMC free article] [PubMed] [Google Scholar]
- Kaiser M., Maes L., Tadoori L.P., Spangenberg T., Ioset J.R. Repurposing of the open access malaria box for kinetoplastid diseases identifies novel active scaffolds against Trypanosomatids. J. Biomol. Screen. 2015;20:634–645. doi: 10.1177/1087057115569155. [DOI] [PubMed] [Google Scholar]
- Li Q.Y., Zu Y.G., Shi R.Z., Yao L.P. Review camptothecin: current perspectives. Curr. Med. Chem. 2006;13:2021–2039. doi: 10.2174/092986706777585004. [DOI] [PubMed] [Google Scholar]
- Marchiori P.E., Alexandre P.L., Britto N., Patzina R.A., Fiorelli A.A., Lucato L.T., Rosemberg S., Pereira S.L., Stolf N.G., Scaff M. Late reactivation of Chagas' disease presenting in a recipient as an expansive mass lesion in the brain after heart transplantation of chagasic myocardiopathy. J. Heart Lung Transpl. 2007;26:1091–1096. doi: 10.1016/j.healun.2007.07.043. [DOI] [PubMed] [Google Scholar]
- Martin R.J. gamma-Aminobutyric acid- and piperazine-activated single-channel currents from Ascaris suum body muscle. Br. J. Pharmacol. 1985;84:445–461. doi: 10.1111/j.1476-5381.1985.tb12929.x. [DOI] [PMC free article] [PubMed] [Google Scholar]
- Mishina Y.V., Krishna S., Haynes R.K., Meade J.C. Artemisinins inhibit Trypanosoma cruzi and Trypanosoma brucei rhodesiense in vitro growth. Antimicrob. Agents Chemother. 2007;51:1852–1854. doi: 10.1128/AAC.01544-06. [DOI] [PMC free article] [PubMed] [Google Scholar]
- Molina I., Gomez i Prat J., Salvador F., Trevino B., Sulleiro E., Serre N., Pou D., Roure S., Cabezos J., Valerio L., Blanco-Grau A., Sanchez-Montalva A., Vidal X., Pahissa A. Randomized trial of posaconazole and benznidazole for chronic Chagas' disease. N. Engl. J. Med. 2014;370:1899–1908. doi: 10.1056/NEJMoa1313122. [DOI] [PubMed] [Google Scholar]
- Moraes C.B., Giardini M.A., Kim H., Franco C.H., Araujo A.M., Schenkman S., Chatelain E., Freitas L.H. Nitroheterocyclic compounds are more efficacious than CYP51 inhibitors against Trypanosoma cruzi: implications for Chagas disease drug discovery and development. Sci. Rep. 2014;4 doi: 10.1038/srep04703. [DOI] [PMC free article] [PubMed] [Google Scholar]
- Neitz R.J., Chen S., Supek F., Yeh V., Kellar D., Gut J., Bryant C., Gallardo-Godoy A., Molteni V., Roach S.L., Chatterjee A.K., Robertson S., Renslo A.R., Arkin M., Glynne R., McKerrow J., Siqueira-Neto J.L. Lead identification to clinical candidate selection: drugs for Chagas disease. J. Biomol. Screen. 2015;20:101–111. doi: 10.1177/1087057114553103. [DOI] [PubMed] [Google Scholar]
- PAHO/WHO . Pan American Health Organisation; 2015. Chagas Disease.http://www.paho.org/hq/index.php?option=com_topics&view=article&id=10&Itemid=40743 Neglected Infectious Diseases. (last accessed 13/08/2015) [Google Scholar]
- Pena I., Pilar Manzano M., Cantizani J., Kessler A., Alonso-Padilla J., Bardera A.I., Alvarez E., Colmenarejo G., Cotillo I., Roquero I., de Dios-Anton F., Barroso V., Rodriguez A., Gray D.W., Navarro M., Kumar V., Sherstnev A., Drewry D.H., Brown J.R., Fiandor J.M., Julio Martin J. New compound sets identified from high throughput phenotypic screening against three kinetoplastid parasites: an open resource. Sci. Rep. 2015;5:8771. doi: 10.1038/srep08771. [DOI] [PMC free article] [PubMed] [Google Scholar]
- Planer J.D., Hulverson M.A., Arif J.A., Ranade R.M., Don R., Buckner F.S. Synergy testing of FDA-approved drugs identifies potent drug combinations against trypanosoma cruzi. PLoS Negl. Trop. Dis. 2014;8:e2977. doi: 10.1371/journal.pntd.0002977. [DOI] [PMC free article] [PubMed] [Google Scholar]
- Rassi A., Jr., Rassi A., Little W.C. Chagas' heart disease. Clin. Cardiol. 2000;23:883–889. doi: 10.1002/clc.4960231205. [DOI] [PMC free article] [PubMed] [Google Scholar]
- Rossi M.A., Tanowitz H.B., Malvestio L.M., Celes M.R., Campos E.C., Blefari V., Prado C.M. Coronary microvascular disease in chronic Chagas cardiomyopathy including an overview on history, pathology, and other proposed pathogenic mechanisms. PLoS Negl. Trop. Dis. 2010;4 doi: 10.1371/journal.pntd.0000674. [DOI] [PMC free article] [PubMed] [Google Scholar]
- Sarver J.G., Trendel J.A., Bearss N.R., Wang L., Luniwal A., Erhardt P.W., Viola R.E. Early stage efficacy and toxicology screening for antibiotics and enzyme inhibitors. J. Biomol. Screen. 2012;17:673–682. doi: 10.1177/1087057112438769. [DOI] [PubMed] [Google Scholar]
- Siqueira-Neto J.L., Moon S., Jang J., Yang G., Lee C., Moon H.K., Chatelain E., Genovesio A., Cechetto J., Freitas-Junior L.H. An image-based high-content screening assay for compounds targeting intracellular Leishmania donovani amastigotes in human macrophages. PLoS Negl. Trop. Dis. 2012;6:e1671. doi: 10.1371/journal.pntd.0001671. [DOI] [PMC free article] [PubMed] [Google Scholar]
- Spangenberg T., Burrows J.N., Kowalczyk P., McDonald S., Wells T.N., Willis P. The open access malaria box: a drug discovery catalyst for neglected diseases. PLoS One. 2013;8:e62906. doi: 10.1371/journal.pone.0062906. [DOI] [PMC free article] [PubMed] [Google Scholar]
- Swanson D.M., Dubin A.E., Shah C., Nasser N., Chang L., Dax S.L., Jetter M., Breitenbucher J.G., Liu C., Mazur C., Lord B., Gonzales L., Hoey K., Rizzolio M., Bogenstaetter M., Codd E.E., Lee D.H., Zhang S.P., Chaplan S.R., Carruthers N.I. Identification and biological evaluation of 4-(3-trifluoromethylpyridin-2-yl)piperazine-1-carboxylic acid (5-trifluoromethylpyridin-2-yl)amide, a high affinity TRPV1 (VR1) vanilloid receptor antagonist. J. Med. Chem. 2005;48:1857–1872. doi: 10.1021/jm0495071. [DOI] [PubMed] [Google Scholar]
- Sykes M.L., Avery V.M. Approaches to protozoan drug discovery: phenotypic screening. J. Med. Chem. 2013;56:7727–7740. doi: 10.1021/jm4004279. [DOI] [PubMed] [Google Scholar]
- Teixeira A.R., Nascimento R.J., Sturm N.R. Evolution and pathology in chagas disease–a review. Mem. Inst. Oswaldo Cruz. 2006;101:463–491. doi: 10.1590/s0074-02762006000500001. [DOI] [PubMed] [Google Scholar]
- Voet A., Callewaert L., Ulens T., Vanderkelen L., Vanherreweghe J.M., Michiels C.W., De Maeyer M. Structure based discovery of small molecule suppressors targeting bacterial lysozyme inhibitors. Biochem. Biophys. Res. Commun. 2011;405:527–532. doi: 10.1016/j.bbrc.2011.01.053. [DOI] [PubMed] [Google Scholar]
- Zhang J.H., Chung T.D., Oldenburg K.R. A simple statistical parameter for use in evaluation and validation of high throughput screening assays. J. Biomol. Screen. 1999;4:67–73. doi: 10.1177/108705719900400206. [DOI] [PubMed] [Google Scholar]
Associated Data
This section collects any data citations, data availability statements, or supplementary materials included in this article.