

Abstract
As malaria declines in parts of Africa and elsewhere, and as more countries move towards elimination, it is necessary to robustly evaluate the effect of interventions and control programmes on malaria transmission. To help guide the appropriate design of trials to evaluate transmission-reducing interventions, we review eleven metrics of malaria transmission, discussing their accuracy, precision, collection methods and costs, and presenting an overall critique. We also review the non-linear scaling relationships between five metrics of malaria transmission; the entomological inoculation rate, force of infection, sporozoite rate, parasite rate and the basic reproductive number, R0. Our review highlights that while the entomological inoculation rate is widely considered the gold standard metric of malaria transmission and may be necessary for measuring changes in transmission in highly endemic areas, it has limited precision and accuracy and more standardised methods for its collection are required. In areas of low transmission, parasite rate, sero-conversion rates and molecular metrics including MOI and mFOI may be most appropriate. When assessing a specific intervention, the most relevant effects will be detected by examining the metrics most directly affected by that intervention. Future work should aim to better quantify the precision and accuracy of malaria metrics and to improve methods for their collection.
1. INTRODUCTION
Changes in malaria transmission must be measured accurately and precisely in order to evaluate the impact and cost-effectiveness of new and existing interventions. As malaria transmission declines across much of sub-Saharan Africa, there has been renewed focus on the need to codify a set of metrics, expectations about likely changes in those metrics across the spectrum of transmission in response to control, defined endpoints for measuring changes in the intensity of transmission, and the associated reductions in malaria burden (Hay et al., 2008, Corran et al., 2007, Smith and Hay, 2009, Cohen et al., 2010, Steketee and Campbell, 2010), with a concurrent increase in funding directed towards improving capacity for monitoring and evaluation (Nahlen and Low-Beer, 2007, Cibulskis et al., 2007).
Malaria transmission, defined herein as the process by which a malaria parasite completes its life-cycle, involves parasites being passed from a female anopheline mosquito through the skin, during a bloodmeal, and via the liver into human blood, and later from the blood back into the mosquito during a subsequent mosquito bloodmeal, leading to parasite development within a mosquito. The intensity of transmission, described by Macdonald (Macdonald, 1957, Smith et al., 2012), is a general concept describing the potential frequency of transmission, but it may also be defined as the number of times each day that a parasite infection is initiated in a human, or the number of times a pathogen infection is initiated in a mosquito. Transmission intensity varies enormously within malaria endemic areas and is determined not only by the vectorial capacity of local mosquito populations but also by other factors, including human immunity and the interventions in place (Smith et al., 2010). Transmission is intrinsically ‘noisy’ due to fluctuations in underlying mosquito populations, temperature-induced changes in mosquito interactions with the parasite, immunological changes affecting human-parasite interactions and the spatial heterogeneity over which these occur. There is also variation in the efficiency of transmission, the number of uniquely identifiable infections caused by each infectious bite, which is affected by heterogeneous biting, multiple infections and acquired immunity (Smith et al., 2010). Spatio-temporal variability in the quantities of interest raise questions about the precision and accuracy of these metrics that must be understood to interpret these parameters properly and to measure changes over time.
Malaria control interventions slow transmission at specific points during the complex parasite life cycle, and likewise there are several points during this cycle at which the intensity of transmission may be measured, using various metrics pertaining to the three players: mosquitoes, parasites, and humans (Carter and Mendis, 2006, Hay et al., 2008). Each metric represents a quantity that is an important step in the transmission process, as illustrated in Figure 1.
Figure 1. Metrics of malaria transmission.
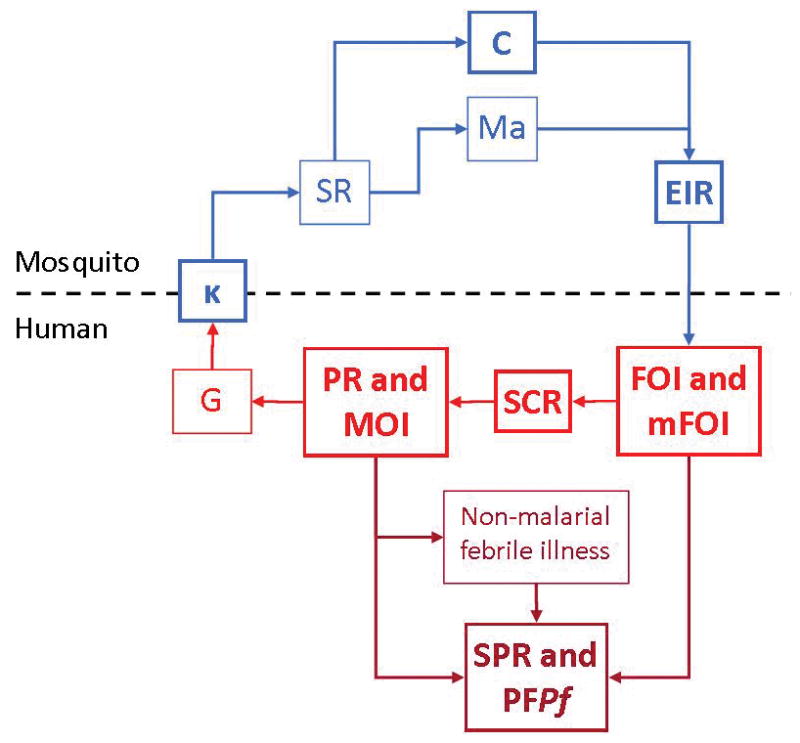
Metrics evaluated in this paper are in bold. Blue indicates entomological metrics; red indicates clinical metrics; dark red indicates asymptomatic and symptomatic infections identified in health facilities. κ: net infectiousness of humans; SR: sporozoite rate; C: vectorial capacity; Ma: human biting rate; EIR: entomological inoculation rate,; FOI: force of infection; mFOI: molecular force of infection; MOI: multiplicity of infection; SCR: sero-conversion rate ; PR: parasite rate; MOI: multiplicity of infection; G: gametocyte rate; SPR: slide positivity rate; PFPf: proportion of fevers parasitaemic.
Parasite rate (PR) is the proportion of the proportion of people who are infected with parasites and the gametocyte prevalence is the proportion of people carrying gametocytes in their blood. The human biting rate is the number of bites by vector mosquitoes received per human per day, denoted Ma, and some portion of mosquitoes biting infectious humans become infected. Since gametocytes must be present for a mosquito to become infected, gametocyte rates give an index of the net infectiousness of the human populations to mosquitoes, which is defined as the probability that a mosquito becomes infected after biting a human, denoted κ. Thereafter, each mosquito gives some number of infectious bites. The average number of human bloodmeals taken by a mosquito over a lifetime has been called the stability index, S, and the proportion of infected mosquitoes that survive long enough to transmit, P. The sporozoite rate, SR, in a stable population is related to κ by a formula . EIR is the expected number of infectious bites per person per day, a product of SR and Ma (Onori and Grab, 1980b). Vectorial capacity, C, describes the relationship between κ and EIR and reflects the efficiency of the malaria vector, or ‘the expected number of humans infected per infected human, per day, assuming perfect transmission efficiency’ (Smith and McKenzie, 2004). The t-day attack rate, denoted A(t), is the proportion of people who become infected over some interval of time of length t. This is the typical metric used to count human infections. The annual force of infection (aFOI) is the number of infections per person per year. In a population with homogenous risk, the attack rate is related to the force of infection by the relationship A(t) = 1 − e−ht. Two measures that are closely related to the AR and the FOI are the clinical attack rate (cAR), and the clinical force of infection (cFOI), which are defined in the same way as their respective clinical measures, but they are accompanied by clinical symptoms. The seroconversion rate describes the rate at which a population develops detectable malaria antibodies in the serum as a result of malaria infection.
Metrics of malaria transmission change on different temporal scales, reflecting the dynamics of mosquito populations, parasite infections in humans, the kinetics of changing human immunity and human demographics. The metrics are causally inter-related (Figure 1), but based on both a priori arguments and a posteriori examinations of patterns, some of these relationships are non-linear when considered across the spectrum of transmission intensity (Smith et al., 2010). These non-linearities, together with variability in transmission and measurement errors, weaken the associations between those metrics separated by a greater number of steps in the transmission cycle. The most substantiated and relevant effects on transmission are found by examining the metric that is most directly affected by an intervention, for example, the biological efficacy of a transmission-blocking vaccine is best assessed directly by measuring κ (Figure 1). However, when it is not possible to measure an effect directly, the study should follow the chain of causation and examine the nearest attainable downstream metric. Generally the endpoints of greatest interest are the direct outcomes of human infections: infection per se, clinical malaria, hospitalization, and death. However the relationships between these clinical metrics and transmission are complex and are among the most difficult to measure (Ghani et al., 2009, Trape and Rogier, 1996).
The future need to approve new interventions and to evaluate existing strategies aimed at reducing transmission highlights the specific requirement for robust methods to measure a change in transmission (invariably a decrease) and the need to account for non-linear patterns and expectations between metrics when interpreting data from intervention studies. To help guide the appropriate design of future trials seeking to evaluate transmission-reducing interventions, we first critically evaluate the precision, accuracy and costs of the metrics that have been developed to measure the transmission of falciparum malaria. To our knowledge this is the first comprehensive review of these attributes. Second, we review the non-linear scaling relationships between five major metrics of malaria transmission: the entomological inoculation rate, force of infection, sporozoite rate, parasite rate and the basic reproductive number, R0.
2. ACCURACY, PRECISION AND COSTS OF MALARIA METRICS
The suitability of malaria transmission metrics as endpoints for measuring changes in transmission is determined by costs, precision, accuracy, the need for and availability of experts, the intrinsic variability of the metric across space and time, and overall familiarity with the metric because of common use. In this paper we review eleven metrics of transmission: (1) net infectiousness of humans, (2) parasite rate in humans, (3) entomological inoculation rate, (4) force of infection and molecular force of infection, (5) multiplicity of infection, (6) seroconversion rate, (7) slide or clinical positivity rate, (8) incidence of clinical malaria or annual parasite index, (9) proportion of fevers with P. falciparum parasitaemia, (10) vectorial capacity and (11) basic reproduction number. In addition to giving a general description of each metric, we also assess (a) methods for collection, (b) accuracy, (c) precision and (d) costs of collection and (e) give an overall critique. The findings of the review are summarised in Table 1.
Table 1.
Summary of sampling issues, accuracy and precision of major malaria transmission metrics
| Sampling issues | Accuracy | Precision | |
|---|---|---|---|
| Net infectiousness of humans to mosquitoes (κ) |
|
|
|
| Parasite rate in humans (PR) |
|
|
|
| Entomological inoculation rate (EIR) |
|
|
|
| Force of infection (FOI), molecular force of infection (mFOI) and |
|
|
|
| Multiplicity of infection (MOI) |
|
|
|
| Seroconversion rate (SCR) |
|
|
|
| Clinical surveillance: slide positivity rate (SPR), incidence of clinical malaria and proportion of fevers with P. falciparum parasitaemia (PFPf) |
|
|
|
| Vectorial capacity (C) and the basic reproduction number (R0) |
|
|
|
Bousema, T., et al., 2012. Mosquito feeding assays to determine the infectiousness of naturally infected Plasmodium falciparum gametocyte carriers. PLoS One, 7, e42821;
Baidjoe, A., et al., In press. Combined DNA extraction and antibody elution from filter papers for the assessment of malaria transmission intensity in epidemiological studies. Malar J;
Koepfli, C., et al., 2011. How much remains undetected? Probability of molecular detection of human Plasmodia in the field. PLoS One 6, e19010;
Bastiens, G., et al., 2011. Malaria diagnostic testing and treatment practices in three different Plasmodium falciparum transmission settings in Tanzania: before and after a government policy change. Malar J. 10, 76.
Accuracy is defined as the closeness of measurements of a quantity to the true value of that quantity, while precision is the degree to which repeat measurements under the same conditions give the same results. When metrics are used to measure changes in some metric, practical consideration must be given to statistical power – the sample sizes required to obtain the required degree of precision. Precision can be improved by increasing sampling effort, and the sample sizes must be sufficiently intense to determine whether a change is statistically significant. This remains true even if the parameter is inaccurate. Further thought is required to determine what a change in the value of a metric means. Many factors can affect the accuracy of these metrics independently of their precision, such that the validity of any measured change must be scrutinized as it may or may not reflect a true change. A persistent issue for interpreting a change in the value of a malaria metric is the source of bias and whether that bias affects the estimates of the metric in the same way in, for example, pre- and post-intervention estimates. To put it in other terms, a biased metric may be useful if is consistent, even if it is inaccurate. Because most metrics are intrinsically biased, as we discuss below, it may be appropriate to utilize consistent and precise metrics as a way of measuring the magnitude of change. Both accuracy and precision are therefore critical considerations when choosing outcomes for the evaluation of interventions and when drawing inferences about changes in malaria transmission using a given metric.
2.1. Net infectiousness of humans to mosquitoes (κ)
The most direct assessments of malaria interventions that aim to reduce malaria transmission measure a change in the net infectiousness of humans to mosquitoes, known as κ and defined as the proportion of mosquitoes that become infected after feeding on humans. The net infectiousness of humans to mosquitoes is affected by processes acting in both humans and mosquitoes. In humans, fluctuations in gametocyte density, naturally acquired transmission blocking immunity and the efficiency with which the gametocytes are taken up by mosquitoes in a blood meal relative to their measured density in blood play a role in determining κ. In mosquitoes, the effective contact rate with humans and factors influencing the susceptibility of mosquitoes to malaria infection determine κ. The susceptibility of anophelines to malaria infection differs between mosquito strains as a result of differences in mosquito innate immunity (Blandin et al., 2004, Molina-Cruz et al., 2012, Smith et al., 2004, Trape et al., 1987). and midgut microbiota (Cirimotich et al., 2011). There may also be differences in malaria susceptibility of different molecular forms of Anopheles gambiae and An. arabiensis. Until the importance of these phenomena in determining transmission efficiency is established, a general estimate of κ is deemed appropriate.
The infectiousness of individual humans can be measured directly using mosquito-feeding assays, but net infectiousness of a human population must be estimated from field data because it is mediated by the complex biting patterns of mosquitoes on humans. This involves entomological sampling since field measures are based on the prevalence of infections in mosquitoes. κ has been collected relatively infrequently, with approximately 37 estimates between 1955 and 2005 (0.7 estimates per year) (Killeen et al., 2006).
a. How to collect
The contributions of individual humans to κ is most commonly measured using direct skin feeding assays, standard membrane feeding assays or using infection rates in natural vector populations.
Skin feeding assay (SFA)
In theory, one of the most reliable ways to measure the individual humans contributions to κ is using a direct skin feeding assay (SFA), where laboratory-reared mosquitoes are directly fed on infected humans to observe the fraction that become infected (Killeen et al., 2006). Human subjects may be either a randomly-selected sample of the whole population (Graves et al., 1988, Burkot et al., 1988, Boudin et al., 1993, Muirhead-Thomson, 1957, Bonnet et al., 2003) or purposely-chosen gametocyte carriers (Bousema et al., 2012).
Membrane feeding assay (MFA)
An alternative and more ethically acceptable method is a membrane feeding assay (MFA) with blood from naturally infected humans. MFAs and SFAs can use both oocyst prevalence and density as outcome measures. This is particularly relevant in the evaluation of transmission-blocking interventions where the transmission-blocking effects may be dependent on parasite exposure (Churcher et al., 2012).
Evidence from a recent meta-analysis of 930 transmission experiments from Cameroon, The Gambia, Mali and Senegal indicates strong correlation between estimates from direct skin feeding and standard membrane-feeding assays (p<0.0001), although direct skin feeding assays generally produced higher mosquito infection rates than membrane feeding assays (OR 2.39, 95%CI 1.94–2.95) (Bousema et al., 2012). In practice, direct skin feeding and standard membrane feeding assays can be difficult and lengthy. Since membrane feeds use mosquitoes of a fixed age (normally 3–5 days) that are kept in optimum conditions, survival rates after feeding are artificially increased. The number of mosquitoes used is also often unrealistically high for a natural setting (i.e. it is unlikely that in reality an individual human would receive 50–75 bites per night). This means that estimates of κ derived from infectiousness in MFAs and SFAs, though accurate, may not be representative in the context of natural mosquito exposure. However, even if the estimates of κ are not representative, these assays may be used to give an accurate assessment of a change in κ.
Infection rates in the natural vector population
To determine net κ, infection rates in the natural vector population can be measured. Mosquitoes are caught and examined for parasites, either in the mid-gut examining for the presence of the oocyst stage, or in the salivary glands for detection of sporozoites. κ is then calculated using biodemographic models of the vector population (Burkot et al., 1990, Charlwood et al., 1997, Saul et al., 1990, Graves et al., 1990). Killeen and colleagues recently added human blood index into the previous model (Charlwood et al., 1997) to allow estimation of κ using oocyst (y) or sporozoite prevalence (z) (Killeen et al., 2006). A simple, but useful rule for approximating these rates is y ≈ Sκpo, and z ≈ Sκpn, where S is the expected number of human bites a mosquito will give over its lifetime, p is the probability of surviving one day, o is the day after infection on which oocysts appear, and n is the day on which sporozoites appear (Killeen et al., 2006). This approximation is in accurate in two ways: first, it assumes that mosquito populations have a stable age distribution, which is violated in populations that are fluctuating; and second, it overestimates by a small amount that is accounted for by reinfection of mosquitoes that were already infected earlier in life, but for realistic values of κ, this effect is very small.
Other methods
If the data for the above parameters is unavailable, alternative approaches to calculating κ are to use oocyst infection rates, sporozoite accumulation rates in aging populations of mosquitoes or age-specific sporozoite prevalence curves (Killeen et al., 2006). κ has also been predicted using stochastic individual-based models, using data from neurosyphilis patients given malariatherapy to predict the probability that a mosquito feeding on an infected patient becomes infected, as a function of recent history of asexual parasite density, together with data on EIR to predict the parasite density distributions for populations exposed since birth to seasonal transmission (Killeen et al., 2006).
b. Accuracy
Values of κ simulated using EIR and data from neurosyphilis patients given malariatherapy have been shown to correlate well with EIR at relatively low transmission intensities (EIR<10), yet a paucity of field estimates of κ from areas with EIR<10 has precluded evaluations of this relationship at low transmission intensities using field data (Killeen et al., 2006). Where EIR >10, empirical data from 37 sites across Papua New Guinea and Africa indicates little relationship between field estimates of κ and EIR (Killeen et al., 2006). This suggests little association between the infectiousness of humans to mosquitoes and mosquito-to-human transmission intensity at higher transmission intensities. It is unlikely that this is explained by the acquisition of transmission-blocking immunity since there is little evidence that this type of immunity varies with cumulative exposure (Killeen et al., 2006, Boudin et al., 2004, Sauerwein et al., 2011). Therefore κ is currently not thought to be an accurate assay of malaria transmission intensity, although more data is required to substantiate this. Furthermore, estimates of κ that are based on mosquito feeding assays need to take into account natural mosquito exposure and possible differences between membrane feeding and skin feeding mosquito infection rates to be accurate.
c. Precision
The limited number of observations make an assessment of the precision of κ difficult. It will be influenced by seasonality and both the frequency and intensity of mosquito sampling. The number of estimates may increase with the use of more frequent mosquito sampling techniques (Chaki et al., 2012) and that κ may a potential endpoint for transmission blocking interventions.
d. Costs
The cost of measuring κ depends on the method used. If SFAs or MFAs are used, laboratory rearing of mosquitoes is required, along with associated laboratory equipment for the assay. These assays have proven difficult to establish and only a handful of laboratories are routinely measuring human infectiousness to mosquitoes (Bousema et al., 2012). If κ is indirectly measured using data on sporozoite or oocyst prevalence in mosquitoes, costs may be comparable to and usually associated with an estimation of EIR (see below).
e. Critique
Some transmission-reducing interventions are likely to have a direct effect on κ, such as transmission-blocking vaccines or gametocyte-reducing chemotherapy. However, due to its relatively low precision and accuracy, κ is not considered a robust metric for detecting a change in malaria transmission intensity. SFAs or MFAs will probably play a role in assessing the biological efficacy of a transmission blocking vaccine. However most interventions including LLINs, IRS and other methods of vector control will have an indirect effect on κ, and such assays have limited value in community assessments of transmission.
2.2. Parasite rate in humans (PR)
Parasite prevalence in humans is the proportion of individuals with parasitaemia at a given point in time. The parasite rate (PR), the metric that was designed to estimate prevalence, measures the proportion of individuals who are found to be carrying parasites in their blood, which varies by the method used. The PR is intrinsically inaccurate because parasite densities fluctuate over the course of an infection, and because there are methodological limits on the ability to find parasites in a sample of blood when they are present at low densities. PR has been the traditional metric for classifying malaria endemicity and was used to measure malaria transmission during the era of the Global Malaria Eradication Programme, wherever PR exceeded 1–3% (Hay et al., 2008, Macdonald and Gockel, 1964). PR has been widely collected, with 22,212 estimates between 1985 and 2010 (888.5 estimates per year) (Gething et al., 2011).
a. How to collect
PR can be rapidly measured by examining blood from a cross-sectional survey of a representative sample of the population; e.g the whole community or school survey. Light microscopy is considered the gold standard assay for clinical diagnosis, but RDTs or PCR are alternate assays with advantages over light microscopy in some contexts. These assays should ideally be double-read to improve accuracy. PCR and microscopy both distinguish between malaria species and RDTs to detect both P. falciparum and P. vivax have also now been developed (WHO-GMP, 2012).
b. Accuracy
The accuracy of PR is affected by 1) the distribution of parasite densities in a population at some point in time; 2) the method used for parasite detection; and 3) human factors of the blood donor. Parasite densities are observed to vary over the course of a simple infection (Eyles and Young, 1951 ), and they vary in some unknown way in populations where humans of various ages are being exposed to mosquitoes at different points in time. Parasite densities in an infection can vary from a single parasite to more than 1011 parasites in hyper-parasitaemic patients. A parasite must be present in a blood sample to be counted by light microscopy, but field methods (typically a thick blood film) take approximately 5 microliter of blood and then examine only a fraction of this blood volume. The ability to detect a parasite is thus linked to the number of parasites per microliter, with the probability of detecting a parasite increasing with the number of parasites in the sample. With such a small amount of blood examined, many active infections will inevitably be missed, and these are called sub-patent. While this is not the only factor, it is one of the most important factors, so PR patterns must be interpreted in light of other facts that are known about parasites infections.
Evidence suggests that parasite densities vary systematically by the age of the infection, and thus vary seasonally (i.e., because “older” infections are less likely to have high parasite densities). Parasite densities also tend to be lower in those with well-developed immunity, so they are lower in older patients (Smith et al., 2007b). Finally, parasite densities are strongly affected by the recent history of antimalarial drug use and parasite resistance to those drugs. To accurately capture PR, sampling must be frequent since patent parasitaemia is dynamic and can be short-lived. Single cross-sectional surveys may therefore not accurately capture PR (O’Meara et al., 2007, Corran et al., 2007). O’Meara and colleagues enrolled 51 individuals known to have a primary infection of malaria (i.e. with a true overall infection prevalence of 100%) and sampled these individuals 400 times on random days. Observed prevalence by light microscopy was 80% (95% CI 64–92%) in this particular set of infected patients, a 20% underestimation of true PR, produced by fluctuations in parasite density (O’Meara et al., 2007).
The accuracy of PR estimates is also affected by the age group sampled. PR in children aged 2–10 years has been widely used as a metric of transmission intensity since PR remains fairly constant in this age group regardless of endemicity (Smith et al., 2007b). PR can follow alternative age-patterns if the epidemiology of malaria diverges from the standard model of household biting, for example where certain occupations such as gold miners or forest or agricultural workers are at greater risk of malaria. Highly seasonal transmission also produces variation in age-specific PR patterns (Carneiro, 2010). Given the a priori relationship between parasite densities and the sensitivity of a test, and given the relationship between transmission intensity and parasite densities, it is likely that PR is more accurate during periods of high exposure than low exposure (McElroy et al., 1994).
The accuracy of PCR and RDTs are related to the accuracy of the PR, but with certain caveats. PCR measures the prevalence of parasite DNA in a sample, and it may be much more sensitive than light microscopy. While DNA will always be present when there are viable parasites present, DNA might also be present when there are no viable parasites present. It is currently unclear whether this is affecting the accuracy of PR determined by PCR, studies in rodent malaria suggest that non-viable parasites are rapidly removed from the circulation and false-positive PCR results are unlikely 48 hours after injection with dead parasites. RDTs that are based on the detection of histidine-rich protein 2 (HRP-2), currently the most commonly used RDTs, detect a parasite antigen that is secreted by the parasite into the bloodstream and may persist for several weeks after parasite clearance. This persistence of antigen after viable parasites have been cleared affects the accuracy of RDTs in measuring PR. This explains differences in PR estimates between microscopy and RDT (Batwala et al., 2010). The sensitivity of light microscopy, RDT and PCR are related to the number of parasites. While microscopy and RDT can miss sub-microscopic infections at all transmission settings but particularly at low transmission intensity, PCR is more sensitive and will detect sub-patent infections. A recent review found that in 106 studies, PR measured by microscopy was 54.1% (95% CI 50.3%–58.2%) that of PR measured by PCR, but the proportional differences were larger when the PR was smaller (Okell et al., 2012).
c. Precision
All of the factors affecting accuracy of the PR will also affect its precision, but depending on the sampling design. Since PR varies with seasonality, the precision of estimates can be improved by measuring PR at the same time of the year, such as at the peak of the transmission season, or by conducting repeat surveys year-round. At small spatial scales, intensive sampling is needed to provide robust estimates, as a result of heterogeneity in PR within small areas (Stewart et al., 2009). Most cross-sectional surveys deploy a cluster-randomized design, but this can substantially reduce the precision of the estimates when the distribution of malaria is itself clustered.
Uncertainty around PR estimates relative to other metrics increases at high transmission levels (where EIR>10) (O’Meara et al., 2007, Smith et al., 2005). This is because the relationship between transmission intensity and PR is mediated by acquired immunity, antimalarial drug use, multiple infections and heterogeneous biting. Another constraint to the accuracy of PR is the sensitivity and specificity of the assay used. PR measured through school-based surveys may be subject to certain biases, for example the relative prevalence of parasitaemia in school age children will be higher at lower transmission intensities, due to the peak age shift (Okiro et al., 2009 ).
Despite these concerns about accuracy and precision, it is worth noting that the PR can have sufficient precision to be useful. If repeated surveys use the same methodology, the same population and the same time of the season, estimates are likely to have sufficient precision for valid comparisons between surveys. It was used during the GMEP to monitor progress towards elimination, and it may be highly useful, even if it is biased (Macdonald and Gockel, 1964).
d. Costs
The costs of measuring PR vary from setting to setting and according to the size of the sample and the assay used (Table 2). The cost of each RDT varies from $1–10 USD. In some settings PCR will be the more expensive assay, however the cost per sample will be relatively inexpensive when a large number of samples are processed and where labour costs are relatively high. Microscopy in some settings is relatively expensive, however costs for all assays are laboratory- and country-specific, and in a hospital setting, good microscopists are needed for other reasons. Overall, PR may be a relatively inexpensive metric for making a rapid assessment of transmission intensity where nothing is known about endemicity. However baseline PR should be carefully established if PR is to be used to rigorously measure a change in transmission.
Table 2.
Comparison of costs of survey-based metrics
| Cost | Measures of infection | Measures of exposure | ||
|---|---|---|---|---|
| RDTa | Microscopya | PCRa | Serologyb | |
| Cost per sample | $1.50 | $0.25 | $2.00 | $0.5 |
| Detection limit | 100 to 200 p/μL | 4 to 100 p/μL | <4 p/μL (individual PCR); 100 p/μL (pooled PCR) | n/a |
| Point-of-care test? | Yes | Yes, if basic laboratory services are available | No | n/a |
| Capital equipment required | None | Microscope | PCR machine, pipettes, gel tanks. | Microplate reader |
| Training and rigour | Minimal | Moderate | Very extensive | Extensive |
| Turnaround time per sample | 15 minutes | 30 minutes | 2 days | 3 days |
| Turnaround time for 1000 samples | n/a | Weeks | Typically a week for individual PCR and days for pooled PCR, however the turnaround time depends on staff costs and the type of PCR conducted. | Week |
Unpublished data.
e. Critique
PR is the most frequently actively collected metric (Hay and Snow, 2006) and therefore is easily interpreted by malaria control programme managers. It is the only metric sufficiently ubiquitous for large-scale mapping of malaria transmission (Gething et al., 2011). However, the suitability of PR for assessing changes in transmission intensity varies with the endemicity. While PR is useful for obtaining rapid initial estimates of endemicity, PR is not a direct indicator of transmission intensity and becomes saturated at higher transmission intensities (wherever EIR>10), due to heterogeneous biting, multiple infections and acquired immunity. In other words, large changes in the EIR can lead to reasonably small changes in the PR. The utility of PR for measuring changes in transmission is also limited at very low endemicity due to the sample sizes required to achieve the appropriate degree of statistical power. In addition, at very low transmission intensity, microscopy will also have low discriminative value. Specifically, below a PR of 1–5% it will be very difficult to use PR to detect an impact of interventions (Hay et al., 2008). This limits its utility for accurately measuring the efficacy of transmission-reducing interventions.
2.3 Entomological Inoculation Rate (EIR)
The annual entomological inoculation rate (EIR) is the number of infectious bites received per person per period of time (typically year) (Onori and Grab, 1980a, Davey and Gordon, 1933). It is the product of the human biting rate (Ma, the number of bites per person per year) and the sporozoite rate (SR, the proportion of mosquitoes with sporozoites in their salivary glands). Human biting rates are estimated by catching and counting the number of mosquitoes that attempt to feed on a human, and the SR is found by examining those mosquitoes for the presence of sporozoites. It is widely considered the gold standard metric of malaria transmission, though this is usually an a priori assertion made without regard to precision and accuracy. It has been relatively frequently collected, with 233 estimates between 1980 and 2000 (11.7 estimates per year) (Hay et al., 2000).
a. How to collect
EIR can be measured using direct field measurements of SR and Ma, supplemented by models of mosquito populations. Standard methods for measuring Ma are indoor or outdoor human landing catches, pyrethroid spray catches, exit traps, and CDC light traps (Table 3). The SR is then calculated by examining the caught mosquitoes for sporozoites. It is also possible to separately estimate many of the elements of EIR using mark-release-recapture methodology, such as the population density of the mosquito population and the interval between consecutive bloodmeals.
Table 3.
Frequency of use of methods to measure annual P. falciparum EIR (1980–2004)
| Sporozoite detection and method of determining biting rate | Year intervals | All years | ||||
|---|---|---|---|---|---|---|
| 1980–1984 | 1985–1989 | 1990–1994 | 1995–1999 | 2000–2004 | ||
| Dissection + HLC | 13 | 19 | 18 | 11 | 61 | |
| Dissection + PSC | 8 | 8 | ||||
| Dissection + Exit Trap | 2 | 2 | ||||
| Dissection + ELISA + HLC | 1 | 1 | ||||
| ELISA + HLC | 9 | 14 | 13 | 2 | 38 | |
| ELISA + PSC | 11 | 31 | 42 | |||
| ELISA + Light Trap | 13 | 10 | 9 | 32 | ||
| ELISA + HLC + PSC | 4 | 4 | ||||
| ELISA + HLC + PSC + Light Trap | 3 | 3 | ||||
| ELISA + HLC + Exit Trap | 5 | 5 | ||||
| ELISA + PCR + HLC | 3 | 3 | ||||
| All methods | 21 | 43 | 62 | 71 | 2 | 199 |
HLC: Human Landing Catch; PSC: Pyrethrum Spray Catch; ELISA: enzyme-linked immuno-sorbent assays; PCR: polymerase chain reaction. Table reproduced from Kelly-Hope and McKenzie (2009) and originally published by BioMed Central, London.
Direct field measurements of SR and Ma
The gold standard method for estimating EIR is to directly measure SR and Ma, and to calculate the product of their values:
Using this method, it is reasonably difficult to calculate appropriate confidence intervals since Ma and SR are not independent of each other (i.e., In seasonal areas there is an inverse association over time between SR and changes in population density), and an estimation of the covariance of these is required in order to carry out the calculation (Charlwood et al., 1995). An alternative method has been proposed, in which it is possible to calculate confidence intervals (Drakeley et al., 2003). This method assumes that sporozoite data are available for all mosquitoes caught:
Often, mosquito catch data conform to negative binomial distributions, suggesting an alternative method can be developed to assess the confidence intervals (Shilane et al., 2010, Nedelman, 1983).
Methods for collecting data on SR and Ma have not been standardised and improved biostatistics are needed to establish the appropriate intensity of sampling (Nedelman, 1983, Hay et al., 2000). A recent review of 230 geo-referenced EIR estimates in Africa between 1980 and 2004 found a total of 11 different methods of measuring EIR (Table 3) (Kelly-Hope and McKenzie, 2009, Hay et al., 2000). Ma had been estimated most frequently using human landing catch or pyrethrum spray catch, although light traps and window exit traps had also been used. While human landing catches are deemed the gold standard, measurements may be not accurately reflect exposure when personal protection is in place and there are ethical issues surrounding the risk to those conducting catches.
In the same review, SR was most commonly estimated through dissection of mosquito salivary glands or by ELISA, however polymerase chain reaction (PCR) has also been used (Kelly-Hope and McKenzie, 2009). Of these methods, PCR is the most sensitive yet is also most prone to contamination, resulting in false-positives. False-positivity in the ELISA may also affect the validity of EIR estimates (Durnez et al., 2011). Dissection is a visual method and is therefore subjective. All three approaches for assessing sporozoites rates therefore have their shortcomings. Some studies have attempted to quantify the relationship between different methods of measuring Ma (Mbogo et al., 1993, Lines et al., 1991) and SR (Adungo et al., 1991, Boudin et al., 1991) however there remains uncertainty over how measures compare. Site-specific validation of alternative methods may be increasingly recommended.
Modelling of mosquito populations
EIR can be estimated through a detailed study of the mosquito population and through the formulation of models incorporating the reproductive age of the mosquito. For example Killeen and colleagues adapted an existing cyclical model (Saul et al., 1990) to allow calculation of EIR as a product of (1) the potential of individual vectors to transmit malaria over their lifetime, (2) vector emergence rate in relation to the size of the human population size and (3) the infectiousness of humans to vectors (Killeen et al., 2000). This model of EIR gave predicted values in the same range as those observed in the field at four sites in Papua New Guinea, Tanzania and Nigeria (Killeen et al., 2000). However, although such models may have a use in predicting the effect of interventions, the gold standard for EIR remains direct field measurement.
b. Accuracy
One of the most important questions about the accuracy of the EIR concerns the relationship between the methods used to catch mosquitoes and the actual number of bites received by a person over any given interval of time. A major concern is that different methods for catching mosquitoes have different and poorly characterized biases in their ability to sample different mosquito populations and different mosquito species in different places (Silver, 2008). The number of mosquitoes that are caught differs considerably between different mosquito trapping approaches and sampling efficiency may differ between mosquito species (Wong et al., 2013). If traps are used to sample mosquitoes, the placement of trap – whether inside or outside – and the properties of the trap itself have been shown to differ in the number of vectors species that are being caught (Jawara et al., 2011, Wong et al., 2013)). Inter-individual differences in attractiveness to mosquitoes (Knols et al., 1995) may in turn affect the accuracy of human landing catches. Another concern about the accuracy of mosquito sampling methods is the poor understanding of outdoor biting patterns and if these capture all the relevant vector species (Stevenson et al., 2012). Most methods have been developed and standardized for indoor sampling and might miss outdoor biting, whether outdoor biting comprises a proportion of the biting by a single vector species or type or many types. This will also influence the precision of any estimate.
c. Precision
Without precise measurements of Ma and SR, the uncertainty in EIR can be so large that it is difficult to measure a change in EIR, particularly at low transmission levels. Ma is difficult to measure precisely due to spatial, temporal and seasonal variability in vector density, which necessitates intensive sampling. Sampling methods have yet to be standardised, so it remains unclear what spatial and temporal schemes would give the most precise measures of Ma. SR is also difficult to measure precisely, since it is dependent on the initial infectiousness and average age or survival times of adult mosquitoes in a population. It may also necessary to measure mosquito species-specific S. Unless all mosquitoes caught are examined for sporozoites, calculation of confidence intervals around the EIR is difficult, with several implications: i) it is not possible to extrapolate to other sites, ii) sample size calculations for entomological studies are difficult to carry out and iii) in any study it is unlikely that the number of catches used to calculate EIR will fully represent the total number of person nights within a village. It is therefore difficult to put results in context without confidence intervals. Another concern related to accuracy is the sampling approach. To improve yields, entomological sampling may purposefully select household where a high mosquito density is expected. This affects the extent to which findings can be extrapolated to other households.
d. Costs
Costs for measuring EIR are difficult to generalise since they are heavily dependent on the intensity of entomological sampling, the setting and the methods used. Table 3 summarizes the number of times each sampling method for computing the Ma has been used to estimate the EIR. Table 4 shows the costs of different methods of determining SR, which do not account for manpower. Though exact costs are laboratory-specific, ELISA is the least expensive assay when manpower is taken into account, since salivary gland dissections are laborious and PCR requires extensive training and rigour.
Table 4.
Comparison of costs of methods for determining the sporozoite rate
| Cost | Dissectiona | ELISAb | PCRa |
|---|---|---|---|
| Cost per sample (approximate) | $0.25 | $0.50 | $2.00 |
| Capital equipment required | Microscope | Microplate reader | PCR machine |
| Training and rigour | Moderate | Extensive | Very extensive |
| Turnaround time per sample | 30 minutes | 3 days | 2 days |
| Turnaround time per 1000 samples | Weeks | Weeks | Week (individual PCR); Days (pooled PCR) |
Unpublished data.
e. Critique
Traditionally considered the gold standard, estimates of EIR are relatively commonplace and considered easily interpreted by policy makers and national malaria control programme managers alike. However EIR is not suited to obtaining rapid estimates of transmission intensity. The large uncertainty inherent in measuring Ma and the need for standardised methods for measuring both Ma and SR (Kelly-Hope and McKenzie, 2009, Hay et al., 2000) limit the precision and accuracy of EIR and its potential for measuring a change in transmission. This is especially so at low transmission intensities, where it is difficult to catch sufficient mosquitoes. Furthermore, methods that do not require humans are not well developed for exophagic vectors. There is also small-scale spatial variability in vector abundance and EIR (Mbogo et al., 2003). Despite its limitations, EIR may be necessary in certain settings where serological age profiles or parasitological or clinical measures become insensitive to changes in transmission, for example at very high levels of transmission.
EIR estimates the rate of human exposure to infectious bites, which does not directly translate into population measures of either incidence or clinical disease, nor does it accurately represent exposure when interventions are in place. There are also species- and site-specific discrepancies between the different methods of measuring Ma, including human landing catches, light trap catches and pyrethrum spray catches (Lines et al., 1991). While the Ross-Macdonald model assumed a linear relationship between the force of infection and EIR, the efficiency of transmission (force of infection/EIR or SCR/EIR) actually declines in high transmission settings (Najera, 1974, Smith et al., 2010). There are three main hypotheses to explain the lower transmission efficiency at high intensity: (1) immunity, (2) heterogeneous biting and (3) systematic bias in estimation of the EIR (Smith et al., 2006). Long-lasting immunity is unlikely to be able to account for short-term variation in transmission efficiency however, while bias could explain the nonlinear patterns in transmission efficiency only if the magnitude of the bias increased sharply with EIR. Heterogeneous biting may therefore be the most plausible explanation; if 20% of the population receives 80% of bites, this is consistent with temporal variation in transmission efficiency correlated with EIR, observed at several sites, for example Saradidi in Kenya (Beier et al., 1999, Smith et al., 2010). The loss of transmission efficiency, in addition to the above described concerns about accuracy and precision, raises concern that entomological measures may not be the most appropriate method for measuring malaria transmission.
2.4. Force of Infection (FOI)/Molecular force of infection (mFOI)
The force of infection (FOI) is the number of infections per person per unit time. mFOI is the molecular FOI, the number of new parasite clones acquired per unit time (Mueller et al., 2012). FOI counts all patent incident human malaria infections (symptomatic or asymptomatic) during a given time period and also takes into account whether or not a person is already infected.
a. How to collect
FOI can be measured using cohort studies or repeat cross-sectional surveys.
Cohort studies
FOI can be measured in a naturally uninfected cohort (e.g. uninfected immigrants or infants) or by artificially creating a cohort of uninfected individuals through treatment with antimalarial drugs and following up the cohort to measure the attack rate over some time period (the proportion becoming infected) (Smith et al., 2010), as has been done in Kenya, Ghana, and Senegal (Beier et al., 1994, Owusu-Agyei et al., 2001, Baird et al., 2002, Rogier et al., 1999). A few studies have estimated the FOI by observing the patterns of parasite positives and negatives over time, but some of these transitions may represent natural fluctuations in existing populations, rather than new infections (Bekessy et al., 1976, Charlwood et al., 1998). To resolve some of these questions, new methods have been developed to examine the FOI using genetic methods (see below) to type new infections, called the mFOI. Since the number of newly acquired infections can be measured in the presence of previously acquired infections, there is no need to clear infections prior to longitudinal measurements (Mueller et al., 2012, Felger et al., 2012).
Cross-sectional surveys
Cross-sectional surveys can be conducted and FOI estimated by fitting reverse catalytic models to the increase in PR with age, controlling for infections that have been cleared (Smith et al., 2010, Davey and Gordon, 1933, Davidson and Draper, 1953, Pull and Grab, 1974). For mFOI these models can allow for the imperfect detection of all circulating parasite clones (Felger et al., 2012).
b. Accuracy
Since the density of parasites fluctuates within an infected individual, the sensitivity and specificity of microscopy in detecting infections varies. Sampling on one day only will lead to a small proportion of infections remaining undetected and imprecision in FOI (Koepfli et al., 2011). This may be less problematic for mFOI, since PCR methods involved have greater sensitivity than microscopy (Mueller et al., 2012, Felger et al., 2003). Estimates of mFOI may be biased if certain parasite clones are not detected when fluctuating below the PCR detection threshold (Koepfli et al., 2011, Mueller et al., 2012, Felger et al., 2012) and will also affected by seasonality, age, ITN use and chemotherapy (Mueller et al., 2012).
c. Precision
Estimates from several different studies suggests that FOI is relatively consistent (Smith et al., 2010, Bekessy et al., 1976, Charlwood et al., 1998, Rogier and Trape, 1993). The efficiency of transmission declines as transmission intensity increases, partly due to heterogeneous biting. Therefore FOI saturates above an EIR of around 10 (Smith et al., 2010). Where the FOI is very high, the frequency of sampling limits the maximum value of estimates. The strong association between mFOI seasonality, age and ITN use indicates that it is a reasonable measure of exposure to infection. Significant variation in mFOI between villages also reflects small-scale heterogeneity in transmission (Mueller et al., 2012). mFOI is a more realistic estimate of FOI, since it is possible to monitor natural superinfections in asymptomatic individuals and will also have higher discriminative power at higher transmission intensity.
d. Costs
Costs for FOI and mFOI depend on whether a cohort or cross-sectional survey is used. PCR, required for mFOI, is more expensive than microscopy and requires a higher level of training and/or technical capacity (Table 2).
e. Critique
mFOI has greater sensitivity and specificity than FOI and overall a relatively high precision and accuracy in areas of low transmission. Due to the decline in transmission efficiency at high transmission levels, FOI plateaus above a certain transmission intensity, and is therefore not useful for measuring a change in transmission in highly endemic areas. mFOI is likely to reach a plateau later than FOI. A plateau in mFOI may not be reached if this metric is interpreted as a dynamic multiplicity of infection (MOI), at least in age groups where infections reach blood stage and if the method of detection is highly inclusive.
2.5. Multiplicity of Infection (MOI)
MOI is the number of concurrent parasite clones per P. falciparum-positive host. It has only relatively recently been pioneered as a metric of malaria transmission (Beck et al., 1999, Kolakovich et al., 1996, Mbugi et al., 2006, Arnot, 1998, Schleiermacher et al., 2001). Mathematical theory suggests that, in a cohort of uninfected people acquiring infections and clearing infections independently and naturally, that MOI would reach a Poisson distribution with mean given by the FOI divided by the clearance rates (Dietz, 1988). With heterogeneous biting, this would become a negative binomial distribution. All of these distributions would be affected by within-host competition among parasites (Dietz, 1988) and by sporadic treatment with anti-malarial drugs. The general pattern expected is a higher MOI with local transmission intensity and with time since parasites were last cleared with antimalarial drugs.
a. How to collect
MOI can be measured by genotyping infections using polymorphic markers such as the merozoite surface protein-1 (MSP-1) (Atroosh et al., 2011), MSP-2 (Mueller et al., 2012, Vafa et al., 2008), Glutamate-Rich Protein (GLURP) (Akter et al., 2012) or microsatellite markers (Guitard et al., 2010). MOI has been measured in cross-sectional or longitudinal samples.
b. Accuracy
Accurate molecular typing is essential for measuring MOI and the number of molecular markers and the number of sampling days that are needed for this depend on transmission setting. The more rounds of sampling conducted, the more clones collected and the more precise the MOI estimate (Koepfli et al., 2011). Sampling parasites from the same individual repeatedly will improve the accuracy of the MOI estimate, but as sampling frame grows longer, new infections may decrease the accuracy of MOI. The capacity of MOI to accurately reflect transmission is also likely to be dependent on the diversity of malaria clones in a particular setting, however the relationship between this genetic diversity and transmission intensity is not yet well quantified. Where parasite populations are less diverse, estimates of transmission may be underestimated due to a saturation effect where multiple clones are not distinguished by the molecular markers used (Mueller et al., 2012). In addition, although methods for estimating haplotype frequencies have been developed (Li et al., 2009), haplotypes are not typically considered. This may lead to underestimation of the true MOI, a bias that will change with transmission intensity.
c. Precision
MOI will be affected by interventions such as chemotherapy or chemoprophylaxis that influence susceptibility to infection. In malaria-endemic regions, multiple infections are common, and MOI closely correlates with endemicity (Arnot et al., 1985, Beck et al., 1997, Ntoumi et al., 1995, Paul et al., 1995, Mueller et al., 2012). Reduced MOI has also been observed to be associated with increased ITN use, indicating that it is a reasonable indicator of transmission intensity (Mueller et al., 2012). In a study in children aged 0.9–3.2 years in Papua New Guinea, variation in average MOI over time and between and within villages was not statistically significant. Parasite densities show seasonal fluctuations and the detectability of parasite clones may therefore also depend on season. This will affect the precision of MOI estimates. If this is taken into account and if the extraction of nucleotides and efficiency of PCR amplification remain constant over time, MOI estimates are expected to be relatively precise.
d. Costs
Whilst information can be obtained from single time point surveys, in general repeat sampling is required for accurate estimates of MOI, together with sophisticated procedures including genotyping, which makes it a relatively expensive measure. Costs are also laboratory-specific.
e. Critique
MOI has been developed as a metric of malaria transmission only recently as tools for disentangling the molecular complexity of natural parasite infections emerge, as such methods for validation require development. Two limiting factors on the maximum value of MOI are (1) the frequency of sampling and (2) the local diversity of parasite populations. In the absence of these constraints, MOI shows promise as a robust measure of changing malaria transmission.
2.6. Seroconversion Rate (SCR)
The seroconversion rate is a function of antimalarial antibodies in the population and indicates exposure to infection. It is calculated by fitting a reversible catalytic model to age-specific malarial antibody prevalence (seroprevalence) data (Drakeley et al., 2005b, Grab and Pull, 1974). SCR takes into account malaria exposure (infection) over time (Corran et al., 2007), allowing temporal patterns in transmission to be studied (Stewart et al., 2009, Cook et al., 2011).
a. How to collect
Methods for ascertaining seroconversion rates have been described in detail (Stewart et al., 2009, Corran et al., 2007). In brief, data on seroprevalence to malaria parasite specific antigens (e.g. AMA-1, MSP-119, P. falciparum schizont extract (PfSE)) is collected across all age groups and converted to SCR by fitting a simple reversible catalytic model to the seroprevalence data, stratified into yearly age groups, using maximum likelihood methods (Pull and Grab, 1974). Exclusion of individuals aged <1 year from estimates of SCR minimises the effect of maternally-derived antibodies.
Types of assay
The antibody assay can be adapted to different transmission settings using different antigens (Corran et al., 2007). Historical methods for measuring seroprevalence include the complement fixation test (CFT), indirect haemagglutination assay (IHA) and immunofluorescence antibody test (IFAT), enzyme-linked immunosorbent assay (ELISA) and most recently, protein micro-array (Drakeley et al., 2005b). ELISA is simple, easily standardised and has been used in many recent sero-epidemiological studies of malaria (Cook et al., 2011, Drakeley et al., 2005b).
Types of survey
Blood samples for generating seroprevalence data can be collected in cross-sectional surveys (Cook et al., 2010), school surveys or in health facilities (which necessitates sampling all individuals attending a facility over a fixed period of time, or until sufficient samples have been obtained). In a comparison of the relative advantages of cross-sectional survey and health facility data in north eastern Tanzania, a lower PR was recorded in cross-sectional surveys than health facility data (4.7% vs 2.%, p<0.001), a lower seroprevalence for MSP-119 recorded in the health facility (29.1% vs 40.5%, p=0.005) and similar AMA-1 antibody prevalence found between the two (46.9% vs 47.9%, p=8) (Drakeley et al., 2005a)..
There are three major limitations to the use of health facility seroprevalence data that are relevant to other measures. First, children aged <5 years and women of child-bearing age may be over-represented (which can be partly compensated for by sampling accompanying family members). Second, most health centre attendees are ill, therefore a substantial proportion will have active malaria infections which could influence seroprevalence rates (Stewart et al., 2009). Third, unless the village of residence is recorded, estimates may be skewed by the recruitment of individuals from outside the catchment area, especially at referral facilities. The advantages of using health facility data are its speed of collection and low cost (Drakeley et al., 2005a).
b. Accuracy
Seroprevalence represents cumulative exposure to infection. The accuracy of serology must be addressed on both the individual level and at the level of a population. While the accuracy of serology for one antigen in one individual is probably not a highly accurate measure of previous infection, SCR may become a very useful and accurate measure of transmission in a population when it is taken on many individuals of different ages, and using multiple antigens. Indeed, one of the advantages of serology is the potential to measure seropositivity in humans of different ages, to multiple different responses to the parasite, all lasting different periods of time, to paint a fairly detailed profile of transmission in a population in the present and at various points in the past. One strong advantage of serology is that, due to the long duration of specific antibody responses, seroprevalence can be less affected by seasonality and short-term fluctuations in transmission than other measures (Cook et al., 2010). The long duration of antibody responses has important consequences for areas with changing transmission intensity where seroprevalence in older age groups may reflect historical rather than current transmission intensity.
c. Precision
At low transmission intensities, SCR has high sensitivity since the longevity of the antibody response generates higher seroprevalence rates than equivalent PR (Stewart et al., 2009). At very high transmission intensities, SCR is less sensitive due to saturation of infection in the population. Heterogeneous immunity (not all individuals respond to all antigens) produces a lower estimate of SCR, hence higher SCR estimates (that are closer to FOI) are observed when two or more markers are combined (Smith et al., 2010). The use of antibody titres rather than prevalence data may increase the sensitivity of estimates to changes in transmission intensity (Stewart et al., 2009).
d. Costs
Health facility data is cheaper to collect than cross-sectional survey data (in Tanzania, health facility data was 5–10-fold cheaper than cross-sectional data (Drakeley et al., 2005a)). Collecting blood samples to generate seroprevalence data is relatively simple since antibodies can be eluted from filter paper, making sample collection and storage straightforward (Stewart et al., 2009)). Using an ELISA-based antibody assay is relatively simple, cheap and quick (Table 2) (Corran et al., 2007).
e. Critique
SCR has high precision and accuracy, although its accuracy may decline at very low or high transmission levels. A strong advantage of SCR is the ability to reconstruct the history of exposure, which is especially useful in the common situation of missing baseline data (Corran et al., 2007). With regard to measuring a change in transmission, it has not been established whether SCR can measure less than log-fold differences in transmission (Drakeley et al., 2005b). Currently SCR is not sensitive to short term changes in transmission since antibodies can persist for years after the period of exposure, so it is necessary to wait for the population to age (Corran et al., 2007). However some studies have reported SCR in the youngest children (<5 years) (Ceesay et al., 2010) and this is a method for making SCR estimates more useful for determining recent yearly reductions in transmission intensity. Antigens that prove useful components of malaria vaccines may become redundant in SCR assays if such a vaccine becomes widely used (Corran et al., 2007). Fluctuations in recent exposure can also be determined by examining antibody titres, since seropositivity can last for many years, with currently infected individuals having the highest antibody responses, and levels slowly declining as parasites are reduced. The frequency distribution of antibody titres can therefore be used to describe endemicity if titres are drawn from an age-representative cross-sectional survey (Kagan et al., 1969, Lobel et al., 1973, Cook and Drakeley, 2009). Compared to antibody prevalence, antibody titres will have greater discriminatory power where transmission is high and when a very sensitive assay is used (Cook and Drakeley, 2009).
2.7. Clinical surveillance
Metrics for clinical surveillance include the slide positivity rate (SPR) (also known as the clinical positivity rate (CPR) or test positivity rate (TPR)), which is the proportion of those examined who test positive for parasitaemia. The annual parasite index (API) is a proxy measure of incidence that is derived from SPR takes into account the total population at risk of malaria and the rate at which that population is examined. This differs from incidence of clinical malaria, the rate at which new cases of clinical malaria arise in a population over time, directly measured by active or passive case detection. Finally, the proportion of fevers with P. falciparum parasitaemia (PFPf) represents the total number of febrile malaria cases as a proportion of all febrile cases.
SPR
SPR is the proportion of those examined by microscopy or RDT with parasitaemia. This differs from the annual blood examination rate (ABER), which is the proportion of the total population examined for parasitaemia.
Incidence of clinical malaria
Incidence of clinical malaria is the rate at which new cases of clinical malaria (fever plus parasitaemia) occur in a population (e.g., total number of cases per 1000 person years at risk) and it is therefore a direct measure of disease burden. The annual parasite incidence (API) is the product of the SPR and ABER: API = (ABER*SPR)/10. Division by 10 is necessary because SPR and ABER are expressed per 100 and API per 1000. Incidence of clinical malaria has been relatively frequently collected; a recent review documented 83 estimates between 1985 and 2005 (4.2 estimates per year) (Snow et al., 2005).
PFPf
PFPf is the number of parasitologically-confirmed cases divided by the total number of presumptive malaria (febrile) cases. This differs from the malaria-attributable fraction (AF, or proportion of febrile cases attributable to malaria), which is the proportion of fever morbidity that would be removed if malaria were eliminated. AF is defined as p(fp − fp0)/fp, where p is the proportion of febrile individuals with parasites, fp is the proportion of parasitaemic individuals with fever, and fp0 is the proportion of aparasitaemic individuals with fever (Smith et al., 1994). There are relatively few estimates of PFPf; a recent review documented 39 studies measuring PFPf between 1986 and 2007 (1.9 estimates per year) in sub-Saharan Africa (D’Acremont et al., 2010), while another study identified 67 estimates between 2000 and 2009 (7.4 estimates per year) (Gething et al., 2010). Differences between the two estimates may have arisen due to different review inclusion; in the in the first review the PFPf denominator was the total number of presumptive malaria cases (D’Acremont et al., 2010), while in the second the PFPf denominator was the selection criteria for detailed microscopy, which varied from definitions of fever to unspecified criteria such as ‘suspected’ or ‘presumed malaria’ (Gething et al., 2010).
a. How to collect
SPR
SPR is collected through routine health facility data, using RDTs or blood slides, which ideally should be double-read. The total number of positive slides or RDTs is divided by the total number of slides or RDTs (assuming one test per person).
Incidence of clinical malaria
Incidence can be measured by active or passive case detection, or indirectly estimated using mortality data or spatial techniques.
Active case detection
Incidence can be measured by active case detection by following up a cohort of children artificially cleared of infection and recording new incident infections (Beier et al., 1994). Active case detection captures more cases than passive case detection (Utarini et al., 2007). However it is much more expensive, requires many staff and is time-consuming.
Passive case detection
Incidence can also be measured by passive case detection where new incident infections are recorded once they present at (health) facilities. Measuring incidence through passive case detection makes three assumptions: (1) complete spatial coverage (every health facility reports and every incident infection has access to a facility), (2) complete temporal coverage (every month is reported by a health facility), (3) all disease events present to/are reported by the health facilities (Snow et al., 2005). Hospital admissions data can be used to measure incidence however this does not always reflect malaria incidence in the wider community (Okiro et al., 2009).
Indirect estimation
Malaria incidence has been estimated at the country level using reported malaria mortality data as raw starting data, and extrapolating this to incidence using (1) an adjustment for under-reporting of mortality, (2) an estimate of the likely P. falciparum case fatality rate and (3) the proportion of cases attributable to P. falciparum (to which nearly all mortality is attributed) for each set of national data (Carter and Mendis, 2006, Mendis et al., 2001). However this method is likely to underestimate incidence (Snow et al., 2005). In this study the global clinical malaria burden was estimated using evidence of the epidemiological risks of disease outcome from active case-detection studies together with estimates of populations at risk of various P. falciparum transmission conditions.
There has been debate over the relative merits of estimating incidence directly and indirectly (Cibulskis et al., 2011). Routine data has the dual advantages of being more immediately sensitive to changes in incidence, and since it is collected as part of malaria control programmes it can be easily integrated with other types of data to help evaluate and improve programmes. However, its reliability depends on the coverage and quality of the surveillance system. Strong mandates for the notification of all malaria cases in both public and private sectors may improve reliability (malERA, 2011). Model-based approaches provide estimates for areas with poor or no surveillance and can be used to examine trends over wide areas and over time. However extrapolation in areas of limited data may not be reliable. Combining both approaches may give stronger estimates overall (Mueller et al., 2011).
PFPf
PFPf can be directly calculated from routine health facility or cross-sectional survey data. The total number of cases with confirmed parasitaemia should then be divided by the total number of presumptive malaria cases. Indirectly, PFPf has also been estimated by combining estimates of childhood fevers and treatment-seeking rates from MIS or other survey data with estimates of the risk of febrile children being infected when reporting to clinics within three classes of endemicity. Using this method it was estimated that of 656 million fevers in children aged 0–4 years in Africa in 2007, 182 million presented to public health facilities of which 78 million (42.9%) had parasitaemia (Gething et al., 2010).
b. Accuracy
SPR
Although SPR applies a consistent case definition of malaria, it is calculated from routine health facility data and therefore estimates will be affected by any seasonal or other changes in the incidence of non-malaria fever which influence the presentation of febrile cases (Jensen et al., 2009). As such there is likely to be variation in repeat estimates over time, limiting the value of SPR as a robust assay for measuring changes in transmission. Consistency in diagnostic practices, e.g. the likelihood that a febrile individual is referred for laboratory diagnosis, is essential for accurate and precise estimates. High quality and consistency in microscopy or the use of RDTs is also necessary for accurate data.
Incidence of clinical malaria
The incidence of clinical malaria increases rapidly with transmission intensity. However at high transmission levels, incidence does not exceed that observed at intermediate transmission levels, partly due to acquired immunity and multiple infections (Ghani et al., 2009, Trape and Rogier, 1996). Therefore as transmission falls, a threshold must be crossed before a significant reduction in cases and hospital admissions is observed (Smith et al., 2004, Trape et al., 1987). Incidence estimated using hospital admissions will be unreliable if over-diagnosis leads to an overestimation of the number of cases presenting to health facilities, and cases in the community are missed. Incidence varies with immunity; some individuals may be infected yet asymptomatic and this proportion will differ according to endemicity. Especially at low transmission levels, there is considerable heterogeneity in incidence that results from heterogeneity in transmission between households and may also be affected be human genetic factors that influence the progression of infections to symptomatic disease (Mackinnon et al., 2005).
PFPf
There is likely to be large variation in estimates of PFPf since the causes of fever differ between populations and over time. Furthermore, if health facility data is used, then inaccuracy is introduced into PFPf since a varying proportion of febrile individuals within a population will present at clinics. In areas of very high transmission intensity, estimates may be inaccurate since nearly all individuals have parasitaemia. In addition, non-malaria fevers may suppress malaria parasitaemia, resulting in biased estimates (Smith et al., 1994 ).
c. Precision
SPR
Changes in SPR have been used as evidence of a decline in malaria in parts of Africa (Ceesay et al., 2008), yet the accuracy of SPR as a metric of transmission is less well established than for other metrics. SPR can explain variation in incidence of malaria (Bi et al., 2012) and has been found to be directly associated with the relative change in malaria incidence, assuming that there is no sampling bias in the subgroup of suspected malaria cases undergoing laboratory testing, and that the incidence of non-malaria fevers is constant over time. Since SPR incorporates only laboratory-confirmed cases, the denominator very clearly represents the number of laboratory tests (Francis et al., 2012). The decision making by which laboratory confirmation is requested should remain consistent over time to allow precise and comparable estimates to be made. SPR cannot be used to estimate the incidence of clinical malaria (Jensen et al., 2009) since health facility data may not accurately represent the entire population, especially if the health facilities are chosen because they have laboratories with trained staff and high standards.
Incidence of clinical malaria
At low transmission levels, a very large sample size is required to precisely measure incidence. Similar to SPR, the precision of estimates of clinical malaria depends on the consistency in diagnostic practices. In addition, if there are substantial variations in health-seeking behaviour over time, estimates of clinical malaria that depend on passive case detection will be imprecise.
PFPf
In a review of 39 studies measuring PFPf in sub-Saharan Africa, a 50% reduction in PFPf was observed in the periods pre- and post-2000 (22% versus 44%) (D’Acremont et al., 2010). This mirrors the recent decline in malaria across sub-Saharan Africa (O’Meara et al., 2010), indicating that PFPf may be useful as a rough indicator of transmission intensity. However, in a review of 67 independent estimates of the proportion of febrile children attending clinics with parasitaemia, the ranges of PFPf overlapped in medium (5–40% PR2–10 years) and high (>40% PR2–10 years) classes of endemicity, indicating low precision of PFPf as an indicator of malaria transmission. Furthermore, the pattern of causes of fever in malaria patients is not uniform within populations and between areas (D’Acremont et al., 2010, Gething et al., 2010). Additionally, fever will not be caused by malaria infection in a certain proportion of parasitaemic fever cases. Like the PR, the PFPf likely saturates at high transmission.
d. Costs
SPR
Measurement of SPR is relatively cheap since data is obtained from health facility records and routine diagnostic procedure. Table 2 summarises the comparative costs of RDTs and microscopy.
Incidence of clinical malaria
Indirect estimation of incidence using previously collected data is relatively inexpensive, apart from staff costs. Direct estimation through passive case detection is cheaper than direct estimation through active case detection. Both active and passive detection have the same costs per individual tested (i.e. cost of RDT and cost of ACT) however active detection involves more frequent testing, which requires more RDTs or slides (Utarini et al., 2007), and is logistically more challenging since it will involve repeated scheduled visits of cohort members.
PFPf
The cost of measuring PFPf directly is dependent on whether it is collected via health facility or survey data. Costs for microscopy and RDTs are given in Table 2. Surveys are more expensive to conduct.
e. Critique
SPR
SPR has the advantage that it can be calculated from routine health data and for this reason it is used by WHO as an indicator of reduced transmission at the country level (WHO, 2011). SPR is therefore useful as a rapid indicator broad trends in malaria transmission within a site. However trends in SPR may be affected by confounding factors such as age, area of residence, testing frequency, access to healthcare and type of diagnostic tests used (Francis et al., 2012), so that it is much more difficult to interpret the SPR across sites. Overall, the relatively low accuracy and precision of SPR negate its use as a robust metric of changes in malaria transmission.
Incidence of clinical malaria
At high transmission intensities, acquired immunity limits the accuracy of incidence as a measure of transmission intensity. Therefore, incidence may not be appropriate for accurately recording a decline in incidence from high to medium endemicity. In the context of a trial of a transmission-reducing intervention, clearing baseline and incident infections with drugs at the beginning of a study will affect the subsequent susceptibility of an individual to infection and disease, complicating the measurement of incidence. The clinical presentation of malaria is independently influenced by age (Marsh, 1999, Reyburn et al., 2005) and it has not yet been established which age groups should be monitored for measuring the efficacy of different transmission-reducing interventions.
PFPf
The costs of measuring PFPf are low since it can be readily incorporated into existing routine data collection, therefore PFPf may be useful as a rough indicator of changes in transmission for malaria control programmes. However it has low precision and accuracy therefore should not be relied upon as a reliable assay of changing transmission.
2.8. Vectorial capacity (C) and the Basic Reproduction Number (R0)
Vectorial capacity
Vectorial capacity (C) was developed as part of the early work done by Macdonald to identify the entomological factors responsible for transmission (Macdonald, 1952). A few years later, it was modified slightly to include the human blood index, the methods for measuring it were described, and it was then named (Garrett-Jones, 1964). The quantity describes the potential intensity of transmission by malaria vectors and it is defined as the ‘daily reproductive rate’ or more precisely, the expected number of infectious bites that could eventually arise (i.e., assuming perfect efficiency of transmission) from all the mosquitoes that bite a single human on a single day (Garrett-Jones, 1964). It is calculated as:
Where M is the density of adult mosquitoes, a is their feeding frequency on humans, p is their daily survival rate and n is the duration of parasite development in humans. It can also be understood as the product of the human biting rate (Ma is the human biting rate), the probability a mosquito survives through sporogony (pn), and the expected number of human bloodmeals that would be given by a mosquito after it has become infectious (S = a/−lnp). approximate
When more than one vector species present, the total vectorial capacity is the sum of vectorial capacity of each vector: C = C1 + C2 + ….
R0
The malaria basic case reproduction number (R0) is the ‘expected number of hosts who would be infected after one generation of the parasite by a single infectious person who had been introduced into an otherwise naïve population’. It is found by multiplying vectorial capacity by the net efficiency of transmission, and by the duration of an infection: R0=bcCD, where D describes the average infectiousness of a human infection expressed in the equivalent number of fully infectious days (Johnston et al., 2013) Where transmission is stable the value of R0 is high, exceeding the value (R0 = 1) needed to sustain transmission. Vectorial capacity-based estimates of R0 range from 1 to 3000 in 121 African populations (Smith et al., 2007a, Gething et al., 2011).
a. How to collect
Vectorial capacity
All of the components of vectorial capacity can, in theory, be collected through studies of mosquito populations, usually through studies that capture, mark, release and recapture mosquitoes. Vectorial capacity has been estimated in this way by collecting data on its individual components together with cyclical feeding models of transmission (Saul et al., 1990, Graves et al., 1990, Charlwood et al., 1997). However, measuring all the entomological components to calculate vectorial capacity is technically difficult, and the measurement of each term introduces error that is compounded by taking the product. An alternative method has been proposed, where the dominant entomological variables only are included to be used as a comparative index (Dye, 1986). For example, the Garki project human biting rate data were combined with an amalgamation of the remaining components of vectorial capacity to create a comparative index of vectorial capacity in different Garki villages (Dye, 1986). However this method produces estimates with a comparative use only.
R0
R0 can be estimated directly by taking the product of estimates of each parameter in the formula for vectorial capacity. Under the classical assumptions (that human populations are infinite and the human biting rate is constant), R0 = bVD, where b is the probability that a human becomes infected after being bitten by an infectious mosquito, V is the vectorial capacity (the number of infectious bites by mosquitoes arising from all mosquitoes infected by one person during one day), and D is the mean duration of infectiousness of a single human.
One estimate of b has been made using the control arms of experimental challenge studies (Smith et al., 2010). Since transmission from infectious humans to mosquitoes is often inefficient, depending inter alia on the fluctuating density of gametocytes, it may be best expressed as the number of days an untreated person would be fully infectious; analysis of data from malariatherapy patients and from models of it suggest that a person is infectious, on average, for a period that amounts to approximately 36 infectious days (Johnston et al., 2013). The first estimates were done this way (Davidson and Draper, 1953, Davidson, 1955), but it is technically difficult and expensive (Smith et al., 2007a).
There are, however, several other methods available for estimating R0 (Dietz, 1993 ), based on a data describing 1) the EIR; 2) the FOI (Najera, 1974); 3) the average age at which infection with malaria occurs; and 4) the ratio of malaria infections during successive generations (Freeman et al., 1999). Most estimates of R0 for malaria have been derived from estimates of the EIR, but the other methods have also been used.
A simple method for estimating vectorial capacity from EIR is based on a model of mosquito infections that is consistent with the Ross-Macdonald model. By the formulas, vectorial capacity is closely related to the EIR: E ≈ Cκ, so , or more precisely:
Transmission is slightly more efficient when humans who are more frequently bitten are at increased risk of infection and consequently infect more mosquitoes. This increases R0 by a factor proportional to the squared coefficient of variation of biting rates (1+∝. Making the assumption that net infectiousness is proportional to the PR (i.e. κ ≈ cX), and that the duration of a simple human infection is (1/r), estimates of the EIR and the PR were used to estimate R0 in 121 African populations (Smith et al., 2007a), based on the formula:
The underlying model provides a good fit to the observed empirical relationship between the EIR and the PR as well as the empirical relationship between the EIR and the FOI (Smith et al., 2010, Smith et al., 2005). This relationship has now been updated to use empirical estimates of κ and the revised method was used to produce a global map of the reproductive numbers for P. falciparum that reflects current levels of control (Gething, et al. 2011).
R0 may also be estimated using the initial growth-rate of an epidemic in a previously unexposed population (Macdonald, 1956), this is not feasible in malaria-endemic regions (Smith et al., 2007a), but it has been applied to measure R0 in at least one epidemic situation (Freeman). More generally, R0 has also been estimated from equilibrium situations, using age-independent and age-specific prevalence data (Dietz, 1993).
b. Accuracy
Vectorial capacity
The formula for vectorial capacity makes a number of assumptions: (1) each parasite species has one type of invertebrate vector and one type of vertebrate host, (2) the vector daily survival rate is constant over time and with age, (3) mosquitoes randomly take blood meals, (4) mosquitoes take a fixed number of blood meals per unit time, (5) an infective bite always leads to infection in a susceptible host. However these assumptions frequently fail, for example mosquitoes do not feed at random (Dye, 1986). Vectorial capacity is only as accurate as its constituent parameters. Methods for estimating all parameters for vectorial capacity have not been validated and any errors in collection are subsequently compounded during the final calculation, giving large sampling error (Dye, 1986). Mosquito survival through a day, or p, in particular must be carefully measured since vectorial capacity is sensitive to changes in adult survival, and other factors such as the distribution of bites on humans are not well understood. An alternative method for calculating vectorial capacity that attempts to address these issues has been developed (Dye, 1986).
R0
Like vectorial capacity, R0 is only as accurate as the individual parameters used in its calculation, for which there are practical difficulties in obtaining reliable measurements. In particular, it is difficult to acquire an accurate value for the human biting rate. Any errors in the measurement of individual components of R0 will be compounded.
c. Precision
Vectorial capacity
Vectorial capacity is closely related to EIR; vectorial capacity multiplied by the transmission efficiency gives the gradient of the relationship between EIR and PR at low transmission levels. Unlike EIR, vectorial capacity is not a function of the proportion of humans who are infectious or of the sporozoite rate. Therefore vectorial capacity gives an independent indication of human infection prevalence because its calculation does not use information on the proportion of humans infectious (Smith and McKenzie, 2004). The concerns about precision that are listed under EIR and PR are also concerns for the precision of estimates of vectorial capacity. Natural fluctuations in vector densities, biting patterns and variation in performance of trapping methods affect the precision of estimates of vectorial capacity. Similarly, the precision of PR in humans is affected by the chosen methodology, sampling population and timing of sampling.
R0
R0 is the gold standard, theoretical measure of malaria transmission, which all other metrics of transmission aim to reflect. When obtaining direct field measurements of R0, systematic sampling bias is introduced if PR is used as a measure of the probability that a mosquito becomes infected after biting a human. This is due to heterogeneous biting and immunity, which reduces the infectivity of both mosquitoes to humans, and humans to mosquitoes. Initially, at low transmission levels, the proportion of mosquitoes that become infected after biting a human is higher than PR, due to heterogeneous biting, however at high EIR, while PR continues to rise, transmission-blocking immunity causes the proportion of mosquitoes becoming infected to decline. Smith et al. therefore proposed a revision to the classic formula for R0 which takes into account this variation in the infectivity of humans and mosquitoes with variation in EIR (Smith et al., 2007a).
d. Costs
The costs of collecting vectorial capacity and R0 constitute the cost of measuring its individual components and since this involves detailed clinical and entomological surveys to measure EIR and PR, these are high.
e. Critique
Vectorial capacity
Vectorial capacity is not as useful a measure as EIR for predicting malaria transmission intensity, since it is less meaningful epidemiologically and is not testable by direct field measurement (Killeen et al., 2000). It is also difficult to obtain precise field measurements of vectorial capacity.
R0
While R0 remains the gold standard, idealised measure of malaria transmission, it is difficult to measure accurately and precisely in the field, and the relatively small number of studies (Davidson and Draper, 1953, Davidson, 1955, Burkot et al., 1988, Hagmann et al., 2003) that have attempted to measure R0 is testament to this. In particular the percentage of infected humans that infect a mosquito, c, and the duration of human infections in populations with some level of immunity remain poorly parameterised. Since R0 is derived from other metrics, it is not suitable for measuring changes in transmission, but it is more useful as a way of interpreting those metrics within a common framework for control.
3. SCALING RELATIONSHIPS BETWEEN MALARIA METRICS
The metrics of transmission are all causally interrelated: infectious mosquitoes transmit parasites to humans causing new infections, and infectious humans transmit the parasite back to parasites that eventually appear as sporozoites in the mosquito. The potential rate at which these events occur increases with vectorial capacity or R0. The ease of measuring these metrics varies from place to place, depending in part, on the value of these parameters.
In order to understand which metrics are generally more useful in which settings, and to correctly interpret the results of trials or programmes aimed at reducing malaria transmission, it is necessary to understand the underlying scaling relationships between metrics; for example, does a 50% change in one variable correspond with a 50% change in another, and if so, does a second 50% change in one also correspond with a 50% change in the other? The expectations of these relationships derive from three sources: first, from well-designed epidemiological studies or large-scale controlled trials; second, from the examination of studies where two or more of these metrics have been measured in the same place; and third, from the output of malaria transmission models that are consistent with these changes and that provide a priori expectations about the shapes of those curves. Using previously published work, the relationships between five major metrics of malaria transmission: the entomological inoculation rate (EIR), force of infection (FOI), parasite rate (PR), sporozoite rate (SR), and the basic reproductive number (R0) are modeled in Figure 2 (Smith et al., 2006). Additionally, it is useful to visualise what metric(s) might be most appropriate in terms of accuracy and precision in measuring and detecting changes transmission at different levels of endemicity. To this end, the relative utility of PR, EIR, R0 and SCR at different levels of transmission are modelled in Figure 3a,b and c. This model does not explicitly incorporate any sampling variation around each particular measures nor the associated precision and accuracy. However, by expressing the measures on the same scales, it does illustrate the range of transmission over which different measures might be used and the likely optimal combination of these measures. The limitations pertinent to each measure are described in the respective sections above but the figures show that at all but the highest settings EIR and PR can be used whilst at lower transmission levels molecular and serological endpoints are likely to be most informative.
Figure 2. Relationship between metrics of malaria transmission.

(a) Annual FOI versus R0; Annual EIR versus R0: Derived from a malaria transmission model, with assumptions of heterogeneous biting and superinfection, of PfPR versus PfEIR (Smith et al., 2010). (b) SR versus R0: Derived from a malaria transmission model, with assumptions of heterogeneous biting and superinfection, of PfPR versus PfRc (Smith et al., 2010), assuming sporozoite rate is linearly proportional to PfPR. PR versus R0: Malaria transmission model, with assumptions of heterogeneous biting and superinfection (Smith et al., 2010). (c) Annual FOI versus annual EIR: Model of heterogeneous biting fitted to synthetic cohort data from Saradidi, Kenya (Smith et al., 2010). (d) SR versus annual EIR: Derived from a log-linear model of PfPR versus EIR (Gething et al., 2011), with the assumption that sporozoite rate is linearly proportional to PfPR; PR versus annual EIR: Log-linear model of PfPR versus EIR (Gething et al., 2011). (e) PR versus annual FOI: Derived from a log-linear model of PfPR versus EIR (Gething et al., 2011). (f) SR versus PR: Best-fit model for reported sporozoite rate-PfPR pairs (Smith et al., 2005).
Figure 3. Potential utility of metrics at different levels of endemicity.

Figure 3a: A plot of the logarithm of the annual PfEIR against itself (red), the logarithm of the PfSCR (orange), the PfPR2–10 (blue), and the logarithm of the PfR0 (purple). These relationships are based on one particular model for the steady state relationships. The annual EIR is difficult to measure when the annual EIR is less than one because of the large sample sizes required to catch sufficient vectors both infected and non infected. Similarly, the PR is difficult to measure when it is less than about 1% because of the large sample population sizes that need to be screened. For both measures the solid line indicates those values where it can be measured accurately with reasonable effort, while the dashed line illustrates where the accuracy will wane. The cut-offs for “reasonable effort” could vary depend on costs and priorities. The SCR has some advantages because it can be measured across the spectrum. Nothing is implied about the effort required to measure R0, since it is generally inferred from the other metrics, based on some transmission model. The shapes of the curves have all been standardized to have the same minimum and maximum over the observed range of values to illustrate how the shapes of these curves affect the relative amount of information about transmission at different points along the spectrum. The steeper the curve, the more information that is conveyed about one metric relative to another. Figure 3b and 3c are the same curves with the PfPR2–10 and the logarithm of the R0 on the x-axis respectively. We have not attempted to incorporate any estimates of error in to these plots.
3.1. EIR, FOI, PR, and the SR
The bites of infectious mosquitoes give rise to new infections, and if not treated properly, these can resolve into a chronic infection. Given these causal relationships, the EIR must be related to both the FOI and to the PR. Ross developed the first model relating EIR and prevalence (Ross, 1911), and he also described the mathematical basis for the relationship between the EIR and the FOI (Ross, 1916). Ross’s work motivated the first studies to examine these relationships (Davey, 1933). In 1950 Macdonald assembled these data and examined the relationships. In theory, the FOI could increase linearly with the EIR, but Macdonald’s analysis provided the first quantitative evidence they did not (Macdonald, 1950). The preponderance of evidence assembled since then suggests that there is a highly non-linear relationship between the EIR and the FOI that holds regardless of the method used to measure the FOI (Najera, 1974; Smith 2010).
Several mechanisms and models (Smith et al., 2010, Smith et al., 2006, Filipe et al., 2007) have been proposed to explain this relationship, including immunity, heterogeneous biting (Smith et al., 2010, Smith et al., 2005), and a reduction in the proportion of entomologically assessed inoculations leading to an infection (Smith et al., 2006). There is evidence, meanwhile, that biting frequency increases with age; that the proportion of infections becoming patent declines somewhat with age and exposure, possibly due to greater immunity in older children; and that there may be additional reasons why mosquitoes fail to feed at very high transmission intensity. Weighing the relative effects of these different putative causes is difficult because the associated models tend to give similar predictions.
As part of baseline measurements for a malaria vaccine trial, Beier and colleagues conducted a cohort study in Saradidi, Kenya, in which 44 cohorts of children were cleared of infection before being followed up for two weeks. A linear model was fit to the relationship between EIR and FOI however, this model made false assumptions about that rate of transmission when EIR equals zero (Beier et al., 1994). Smith and colleagues re-analysed this data from Saradidi, introducing heterogeneous biting (Gamma-distributed biting rates) to refine the model:
Where b= the proportion of infectious bites that cause a patent infection in a population previously unexposed to malaria, E= EIR, α = index of heterogeneous biting, t= number of days. Although the fit of this model was not as good as the unrooted linear relationship, it is not plausible that the relationship between EIR and FOI is linear, therefore the model with heterogeneous biting is the most pragmatic (Smith et al., 2010) (Figure 2c). More importantly, the non-linear patterns showed up in cohorts drawn from the same population and changed with the EIR, a pattern that is broadly inconsistent with the hypothesis of immunity.
The model by Ross had been shown to work poorly in the African Savannah (Najera, 1974, Smith et al., 2005), and an analysis from 31 sites in Africa found that the relationship between the EIR and the PR was approximately log-linear. An immediate consequence of this formula is that the PR is not likely to fall until EIR is less than 1 per person per year (Beier et al., 1999). Smith and colleagues found that a simple model with heterogeneous biting fit the patterns of an expanded dataset at least as well as the log-linear model (Smith et al., 2005). 119 estimates of EIR matched to PR in African children aged 0–15 years were identified. The best overall model was a simple extension of the Ross-Macdonald model, with heterogeneous biting:
Where b=transmission efficiency, k=variance of infection rate distribution, ε=annual EIR, 1/r=expected time to infection clearance. The dataset of paired EIR-PfPR estimates was recently update and a log-linear model of EIR versus PR fitted (Figure 2d) (Gething et al., 2011).
Since gametocytes arise from asexual parasites and give rise to infections in mosquitoes, there should be a causal relationship between the PR and κ, and κ and the SR. Far more often, studies have focused instead on the relationship between the EIR and the SR, which is also of interest, but also partially confusing since the EIR is the product of the SR and the HBR. Studies of the EIR and the SR have not found any statistically significant relationship. There is, however, a statistically significant relationship between the PR and the SR.
3.2 SCR and other metrics
Much of the attraction of measuring PR and SCR is that they can be ascertained as part of the same sample collection process and measured using the same blood sample. However, while measures of current infection and past exposure can be derived concurrently, the relationship between the two parameters has to date not been examined in a systematic manner. In two cross-sectional surveys of 250 people conducted in each of 12 villages in Tanzania, the correlation between seroprevalence to merozoite antigens and PR was found to be highly correlated in children aged 4 years or less but decreased with increasing age (MSP-119, r=0.41, 0.29 and 0.17; MSP-2, r=0.24, 0.20 and 0.13; AMA-1, r=0.28, 0.19 and 0.05 in individuals aged 0–4, 5–14 and 15–45 years respectively) (Drakeley et al., 2005a). This is to be expected, since although the antibody responses measured may not be directly linked to immune protection, they will likely reflect increased immunity in older individuals, who have a lower parasite burden. Indeed, where both parasitological and serological measures are age-adjusted, there is good correlation between the two (Figure 3b). For example, in a cross-sectional survey of 7387 people across 18 sentinel sites across Bioko, Equatorial Guinea, site-specific PfPR2–10 was positively correlated with SCR (r=0.85) (Cook et al., 2011). The absence of parasitaemia observed in Tanzania in individuals with merozoite antigens may also be due to seasonality, since a correlation between SCR and incidence of infection was observed at the same site (MSP-119 r= 0.78, AMA-1 r=0.91) (Stewart et al., 2009). Similarly, in Bioko there was good correlation between the reduction in SCR, PR and incidence pre- and post-intervention (Cook et al., 2011).
4. DISCUSSION
The goal of measuring malaria transmission and changes in its intensity has many challenges. To critically compare the most commonly used methods for measuring malaria transmission, this paper evaluates the (a) methods of collection, (b) accuracy, (c) precision and (d) costs of collection of eleven major metrics of transmission. The review highlights some of the most important questions about the accuracy and precision of each metric of transmission and discusses differences in the utility of these metrics in light of these shortcomings. On one hand, there are open questions about the accuracy and precision of all these metrics; specifically, how well do these metrics measure the true value and with what fidelity? On the other hand, there is another and closely related question about how well these metrics can be used as measures of transmission. Each metric has some utility, but to be useful as a measure of the current level of or a change in transmission, a metric must be sufficiently precise. When all else is equal, precision can usually be increased by increasing the sampling effort. Yet this becomes a challenge for measuring some of the metrics at low intensities when the number of events (infected people or mosquitoes) is low and when the inherent heterogeneity in transmission is likely to be most pronounced. With regard to accuracy, however, there are many open questions about the biases contributing to each one of these metrics at every level of transmission. The importance of these biases across the spectrum remains to be evaluated robustly. This review does not make any attempt to quantify the accuracy or precision for each metric, and while these have to some extent been characterized for PR (Smith et al., 2007b, Gething et al., 2012), there is a need for future work to address this for other metrics. A pragmatic approach is to continue to measure transmission, subject to the relative costs of different metrics, while being cognizant of the possibility that bias can also change and undermine the findings of a study.
With respect to the interpretation of these metrics, other issues become more important, most notably the non-linear relations of these metrics across the spectrum of transmission. Because of these issues, together with concerns about accuracy and precision, it is prudent and necessary to measure malaria transmission in several different ways to paint a robust picture of transmission, and to compare these with mechanistic models of transmission. We have illustrated the patterns for EIR, FOI, SR, PR and R0, in order to understand how these relationships scale across the spectrum of transmission intensity.
Traditionally, the EIR has been considered the gold standard measure of transmission intensity (Hay et al., 2000). While the precision and accuracy of EIR have not been well-quantified, these are likely to be low because there are intrinsic difficulties in obtaining precise measurements of the human biting rate (Ma) and the sporozoite rate (SR), due in large part to the highly variable nature of mosquito populations (Mbogo et al., 2003), together with the lack of standardised sampling methods (Kelly-Hope and McKenzie, 2009, Hay et al., 2000). In addition, the accuracy of EIR is mediated by transmission efficiency, which declines as transmission increases (Figure 2).
Another widely collected metric is PR, with over 22,000 estimates documented to date (Gething et al., 2011). PR is useful for obtaining a rapid initial estimate of transmission, however has limited precision and accuracy at higher transmission intensities and its accuracy is determined by the sensitivity of the assay used. At low endemicity, PR is likely to lose accuracy where EIR<0.5, since malaria becomes more focal and population sampling may miss infections (Guerra et al., 2008) (Figure 3). PCR-PR estimates, once they become more widely available, may improve sensitivity at very low endemicity but are unlikely to improve the value of PR at high endemicity (Okell et al., 2012). Genotyping approaches can also be used to make cross-sectional and longitudinal surveys more informative by determining the multiplicity of infection (MOI) and the molecular force of infection (mFOI). mFOI and MOI show great promise for assessing changes in malaria transmission. MOI is a single time-point quantification of the complexity of infections and increases the dynamic range over which infection estimates are informative: MOI saturates at a higher transmission intensity than PR. Similarly, mFOI has greater precision and accuracy than FOI. FOI can be seen as a dynamic PR where newly acquired infections are measured over time; mFOI can interpreted as a dynamic MOI. mFOI may not lose accuracy when transmission efficiency declines with increasing transmission intensity (Koepfli et al., 2011, Mueller et al., 2012). While methods for validation of MOI and mFOI need developing, this metric could prove a robust measure of changing malaria transmission in the absence of limits on sampling frequency and the local diversity of parasite populations (Mueller et al., 2012).
Metrics derived from clinical surveillance, including SPR, incidence of clinical malaria and PFPf have the advantage of being estimable by routine health facility data, which keeps costs low and is useful for obtaining rapid or routine measures of transmission intensity (D’Acremont et al., 2010). Yet the precision and accuracy of both SPR and PFPf is affected by factors such as access to and frequency of testing and in the case of PFPf, the incidence of other febrile illness. Incidence of clinical malaria remains the gold standard outcome for clinical trials of malaria control interventions, however it may have limited accuracy at higher transmission intensities for assessing changes in transmission, due to acquired immunity and superinfection which limit the efficiency of transmission.
SCR has high precision and accuracy at all but the extremes of the transmission spectrum (Figure 3) and is useful for assessing long-term changes in transmission. In its current form SCR has limited use for assessing the short term effects of an intervention (Cook et al., 2011, Drakeley et al., 2005b), however estimating SCR in children aged less than five years or measuring antibody levels rather than prevalence may allow these short-term changes to be measured (Corran et al., 2007, Cook et al., 2011).
For interventions that directly reduce the infectiousness of humans to mosquitoes, including transmission-blocking vaccines or gametocyte-reducing chemotherapy, κ may have the most relevance. However, within the context of a Phase III trial, this must be measured from field data in order to take into account the effect of mosquito densities and biting rates. Field measurements of κ will have low precision due to natural variation and measurement error, yet methods to address this have not been overcome. Increased vector sampling will go some way to improving these limitations (Chaki et al., 2012) but these approaches have yet to be validated in different settings. Lastly, while it is important to consider the theoretical effects of a transmission-reducing intervention on vectorial capacity and R0, neither metric has practical utility due the difficulties inherent in achieving precise and accurate field measurements (Killeen et al., 2000, Davidson and Draper, 1953, Davidson, 1955, Burkot et al., 1988, Hagmann et al., 2003).
This review highlights the considerable variation in both the costs and ease of collection of different metrics, which are setting-specific and difficult to generalise. Although expertise, equipment and materials required drive costs, the scale and frequency of sampling is also important. For example, although MOI requires sophisticated procedures including genotyping, single time-point measurements may be taken, meaning it is cheaper overall than FOI. Similarly, since EIR requires intensive sampling, it is likely the most expensive metric overall. The mode of sampling also affects costs; health system data likely to be less expensive than cohort or survey data since the majority of costs are already covered. The costs of survey-based metrics, such as PR and SCR, are roughly comparable, with some variation arising from the differing expense of the assays required (Hsiang et al., 2012). The fact that these metrics can be collected from the same sampling procedure is an additional advantage. The relative costs of metrics are an important consideration for routine monitoring by malaria control programmes, although may be less relevant to the design of internationally-funded intervention trials. It is also important to consider that ancillary information not directly relevant to measures of transmission may be collected for most measures such as speciation of both mosquito and parasite, molecular characterisation of insecticide and drug resistance etc.
Understanding how metrics vary across the transmission spectrum, and how they relate, can also help pinpoint which metrics are useful for measuring transmission in different settings. This review illustrates that two basic kind of non-linearity arises from the simple dynamics in the Ross-Macdonald model: thresholds and saturating responses. Other kinds of non-linearities are introduced by heterogeneous biting and by human immunity (Figure 2) (Smith et al., 2010, Smith et al., 2005). These four basic kinds of non-linearities play out differently in different transmission contexts, and the design of large-scale interventions should be cognizant of them. For example, the relationship between EIR and prevalence is fairly linear below a threshold value of EIR (typically where EIR is less than 10, where transmission is ‘unstable’ or ‘low to moderate’), therefore malaria control results in an almost proportionate reduction in prevalence. When EIR exceeds this threshold, the relationship between EIR and prevalence is non-linear and a reduction in EIR will not reduce prevalence (Smith et al., 2005, Beier et al., 1999, Griffin et al., 2010).
Based on the findings of the review, we advocate that at low transmission levels, appropriate metrics for measuring a change in transmission will generally include PR, although where EIR<0.5, where PR by microscopy becomes very low, molecular methods such as PR by PCR or mFOI may have greater precision and accuracy. SCR also becomes increasingly suitable at lower transmission intensities. At very high levels of transmission, EIR may be necessary since serological age profiles or parasitological or clinical measures can become insensitive to changes in transmission, although it is important to recognise its low precision and accuracy and the need to standardise methods for sampling variable mosquito populations. However when assessing a specific intervention, the most relevant effects may be detected by also examining those metrics most directly affected by an intervention and/or tailoring these to focus on age groups likely to have benefitted most from the intervention (e.g. reduction of exposure to infection defined by antibody levels in children aged less than 5 years).
In conclusion, the precision and accuracy of malaria metrics has not been well quantified, nor have robust sampling methods to address low precision and accuracy been developed. This has important ramifications for both ongoing malaria surveillance and for the evaluation of malaria intervention and control programmes, especially given that the lack of consensus on precision and accuracy extends to some of the most widely used metrics, including EIR, PR and incidence of clinical malaria. Generic issues affecting the precision and accuracy of all malaria metrics include measurement issues, bias (especially for processes that are observed passively) and seasonality or inter-annual variability in the values of these parameters, including trends that are attributable to other factors. In order to measure a change in transmission, a baseline must first be established, which is problematic against a background of seasonal, trending and otherwise variable signals and this complicates the attribution of effects. Further work is required to establish which metrics are most appropriate in which settings, and the most robust and inexpensive methods for their collection.
Acknowledgments
The authors acknowledge the financial support of the PATH Malaria Vaccine Initiative and the Wellcome Trust (#WT091924). The work of TB and CJD is supported by the European FP7 project REDMAL (#242079).
References
- Adungo P, et al. Comparative determination of Plasmodium falciparum sporozoite rates in Afrotropical Anopheles from Kenya by dissection and ELISA. Ann Trop Med Parasitol. 1991;85:387–94. doi: 10.1080/00034983.1991.11812581. [DOI] [PubMed] [Google Scholar]
- Akter J, et al. Genotyping of Plasmodium falciparum using antigenic polymorphic markers and to study anti-malarial drug resistance markers in malaria endemic areas of Bangladesh. Malar J. 2012;11:386. doi: 10.1186/1475-2875-11-386. [DOI] [PMC free article] [PubMed] [Google Scholar]
- Arnot D. Unstable malaria in Sudan: the influence of the dry season. Clone multiplicity of Plasmodium falciparum infections in individuals exposed to variable levels of disease transmission. Trans R Soc Trop Med Hyg. 1998;92:580–585. doi: 10.1016/s0035-9203(98)90773-8. [DOI] [PubMed] [Google Scholar]
- Arnot D, et al. Circumsporozoite protein of Plasmodium vivax: gene cloning and characterization of the immunodominant epitope. Science. 1985;230:815–8. doi: 10.1126/science.2414847. [DOI] [PubMed] [Google Scholar]
- Atroosh W, et al. Genetic diversity of Plasmodium falciparum isolates from Pahang, Malaysia based on MSP-1 and MSP-2 genes. Parasit. Vectors. 2011;13:233. doi: 10.1186/1756-3305-4-233. [DOI] [PMC free article] [PubMed] [Google Scholar]
- Baidjoe A, et al. Combined DNA extraction and antibody elution from filter papers for the assessment of malaria transmission intensity in epidemiological studies. Malaria J. doi: 10.1186/1475-2875-12-272. In press. [DOI] [PMC free article] [PubMed] [Google Scholar]
- Baird JK, et al. Seasonal malaria attack rates in infants and young children in northern Ghana. Am J Trop Med Hyg. 2002;66:28–06. doi: 10.4269/ajtmh.2002.66.280. [DOI] [PubMed] [Google Scholar]
- Bastiens G, et al. Malaria diagnostic testing and treatment practices in three different Plasmodium falciparum transmission settings in Tanzania: before and after a government policy change. Malar J. 2011;10:76. doi: 10.1186/1475-2875-10-76. [DOI] [PMC free article] [PubMed] [Google Scholar]
- Batwala V, Magnussen P, Nuwaha Are rapid diagnostic tests more accurate in diagnosis of plasmodium falciparum malaria compared to microscopy at rural health centres? Malar J. 2010;9:349. doi: 10.1186/1475-2875-9-349. [DOI] [PMC free article] [PubMed] [Google Scholar]
- Beck HP, et al. Analysis of Multiple Plasmodium falciparum Infections in Tanzanian children during the Phase III Trial of the Malaria Vaccine SPf66. J Infect Dis. 1997;175:921–926. doi: 10.1086/513991. [DOI] [PubMed] [Google Scholar]
- Beck HP, et al. 8. Effect of iron supplementation and malaria prophylaxis in infants on Plasmodium falciparum genotypes and multiplicity of infection. Trans R Soc Trop Med Hyg. 1999;93(Supplement 1):41–45. doi: 10.1016/s0035-9203(99)90326-7. [DOI] [PubMed] [Google Scholar]
- Beier JC, Killeen GF, Githure JI. Short report: entomologic inoculation rates and Plasmodium falciparum malaria prevalence in Africa. Am J Trop Med Hyg. 1999;61:109–113. doi: 10.4269/ajtmh.1999.61.109. [DOI] [PubMed] [Google Scholar]
- Beier JC, et al. Plasmodium falciparum incidence relative to entomologic inoculation rates at a site proposed for testing malaria vaccines in western Kenya. Am J Trop Med Hyg. 1994;50:529–36. doi: 10.4269/ajtmh.1994.50.529. [DOI] [PubMed] [Google Scholar]
- Bekessy A, Molineaux L, Storey J. Estimation of incidence and recovery rates of Plasmodium falciparum parasitaemia from longitudinal data. Bull World Health Organ. 1976;54:685–93. [PMC free article] [PubMed] [Google Scholar]
- Bi Y, et al. Can slide positivity rates predict malaria transmission? Malar J. 2012;11:117. doi: 10.1186/1475-2875-11-117. [DOI] [PMC free article] [PubMed] [Google Scholar]
- Blandin S, et al. Complement-like protein TEP1 is a determinant of vectorial capacity in the malaria vector Anopheles gambiae. Cell. 2004;116:661–670. doi: 10.1016/s0092-8674(04)00173-4. [DOI] [PubMed] [Google Scholar]
- Bonnet S, et al. Estimation of malaria transmission from humans to mosquitoes in two neighbouring villages in south Cameroon: evaluation and comparison of several indices. Trans R Soc Trop Med Hyg. 2003;97:53–59. doi: 10.1016/s0035-9203(03)90022-8. [DOI] [PubMed] [Google Scholar]
- Boudin C, et al. Epidemiology of Plasmodium falciparum in a rice field and a savanna area in Burkina Faso: seasonal fluctuations of gametocytaemia and malarial infectivity. Ann Trop Med Parasitol. 1991;85:377–85. doi: 10.1080/00034983.1991.11812580. [DOI] [PubMed] [Google Scholar]
- Boudin C, et al. High human malarial infectivity to laboratory-bred Anopheles gambiae in a village in Burkina Faso. Am J Trop Med Hyg. 1993;48:700–706. doi: 10.4269/ajtmh.1993.48.700. [DOI] [PubMed] [Google Scholar]
- Boudin C, et al. Plasmodium falciparum transmission blocking immunity under conditions of low and high endemicity in Cameroon. Parasite Immunol. 2004;26:105–110. doi: 10.1111/j.0141-9838.2004.00689.x. [DOI] [PubMed] [Google Scholar]
- Bousema T, et al. Mosquito feeding assays to determine the infectiousness of naturally infected Plasmodium falciparum gametocyte carriers. PLoS One. 2012;7:e42821. doi: 10.1371/journal.pone.0042821. [DOI] [PMC free article] [PubMed] [Google Scholar]
- Burkot TR, et al. Variations in malaria transmission rates are not related to Anopheline survivorship per feeding cycle. Am J Trop Med Hyg. 1990;43:321–327. doi: 10.4269/ajtmh.1990.43.321. [DOI] [PubMed] [Google Scholar]
- Burkot TR, et al. Human malaria transmission studies in the Anopheles punctulatus complex in Papua New Guinea: sporozoite rates, inoculation rates, and sporozoite densities. Am J Trop Med Hyg. 1988;39:135–44. doi: 10.4269/ajtmh.1988.39.135. [DOI] [PubMed] [Google Scholar]
- Carneiro I, et al. Age-patterns of malaria vary with severity, transmission intensity and seasonality in Sub-Saharan Africa: a systematic review and pooled analysis. PLoS One. 2010;5 doi: 10.1371/journal.pone.0008988. [DOI] [PMC free article] [PubMed] [Google Scholar]
- Carter R, Mendis K. Measuring malaria. Am J Trop Med Hyg. 2006;74:187–188. [PubMed] [Google Scholar]
- Ceesay S, et al. Changes in malaria indices between 1999 and 2007 in The Gambia: a retrospective analysis. Lancet. 2008;372:1545–54. doi: 10.1016/S0140-6736(08)61654-2. [DOI] [PMC free article] [PubMed] [Google Scholar]
- Ceesay S, et al. Continued decline of malaria in The Gambia with implications for elimination. PLoS One. 2010;5:e12242. doi: 10.1371/journal.pone.0012242. [DOI] [PMC free article] [PubMed] [Google Scholar]
- Chaki P, et al. An affordable, quality-assured community-based system for high resolution entomological surveillance of vector mosquitoes that reflects human malaria infection risk patterns. Malar J. 2012;11:172. doi: 10.1186/1475-2875-11-172. [DOI] [PMC free article] [PubMed] [Google Scholar]
- Charlwood JD, et al. Survival and infection probabilities of anthropophagic anophelines from an area of high prevalence of Plasmodium falciparum in humans. Bull Ent Res. 1997;87:445–453. [Google Scholar]
- Charlwood JD, et al. Density independent feeding success of malaria vectors (Diptera: Culicidae) in Tanzania. Bull Ent Res. 1995;85:29–35. [Google Scholar]
- Charlwood JD, et al. Incidence of Plasmodium falciparum infection in infants in relation to exposure to sporozoite-infected anophelines. Am J Trop Med Hyg. 1998;59:243–251. doi: 10.4269/ajtmh.1998.59.243. [DOI] [PubMed] [Google Scholar]
- Churcher TA, et al. Measuring the blockade of malaria transmission – An analysis of the Standard Membrane Feeding Assay. Int J Parasitol. 2012;42:1037–1044. doi: 10.1016/j.ijpara.2012.09.002. [DOI] [PubMed] [Google Scholar]
- Cibulskis ER, et al. Worldwide incidence of malaria in 2009: Estimates, time trends, and a critique of methods. PLoS Med. 2011;8:e1001142. doi: 10.1371/journal.pmed.1001142. [DOI] [PMC free article] [PubMed] [Google Scholar]
- Cibulskis RE, et al. Estimating trends in the burden of malaria at country level. Am J Trop Med Hyg. 2007;77:133–137. [PubMed] [Google Scholar]
- Cirimotich C, et al. Natural microbe-mediated refractoriness to Plasmodium infection in Anopheles gambiae. Science. 2011;332:855–8. doi: 10.1126/science.1201618. [DOI] [PMC free article] [PubMed] [Google Scholar]
- Cohen JM, et al. How absolute is zero? An evaluation of historical and current definitions of malaria elimination. Malar J. 2010;9:213. doi: 10.1186/1475-2875-9-213. [DOI] [PMC free article] [PubMed] [Google Scholar]
- Cook J, Drakeley C. Potential contribution of sero-epidemiological analysis for monitoring malaria control and elimination: historical and current perspectives. Adv Parasitol. 2009;69:299–352. doi: 10.1016/S0065-308X(09)69005-9. [DOI] [PubMed] [Google Scholar]
- Cook J, et al. Serological markers suggest heterogeneity of effectiveness of malaria control interventions on Bioko Island, Equatorial Guinea. PLoS One. 2011;6:e25137. doi: 10.1371/journal.pone.0025137. [DOI] [PMC free article] [PubMed] [Google Scholar]
- Cook J, et al. Using serological measures to monitor changes in malaria transmission in Vanuatu. Malar J. 9:169. doi: 10.1186/1475-2875-9-169. [DOI] [PMC free article] [PubMed] [Google Scholar]
- Corran P, et al. Serology: a robust indicator of malaria transmission intensity? Trends Parasitol. 2007;23:575–82. doi: 10.1016/j.pt.2007.08.023. [DOI] [PubMed] [Google Scholar]
- D’Acremont V, et al. Reduction in the proportion of fevers associated with Plasmodium falciparum parasitaemia in Africa: a systematic review. Malar J. 2010;9:240. doi: 10.1186/1475-2875-9-240. [DOI] [PMC free article] [PubMed] [Google Scholar]
- Davey TH, Gordon RM. The estimation of the density of infective anophelines as a method of calculating the relative risk of inoculation with malaria from different species or in different localities. Ann Trop Med Parasitol. 1933;27:27–52. [Google Scholar]
- Davidson G. Further studies of the basic factors concerned in the transmission of malaria. Trans R Soc Trop Med Hyg. 1955;49:339–350. doi: 10.1016/0035-9203(55)90056-0. [DOI] [PubMed] [Google Scholar]
- Davidson G, Draper C. Field studies on some of the basic factors concerned in the transmission of malaria. Trans R Soc Trop Med Hyg. 1953;47:522–535. doi: 10.1016/s0035-9203(53)80005-2. [DOI] [PubMed] [Google Scholar]
- Dietz K. Mathematical models for transmission and control of malaria. In: Wernsdorfer W, McGregor I, editors. Principles and Practice of Malaria. Churchill Livingstone; Edinburgh: 1988. [Google Scholar]
- Dietz K. The estimation of the basic reproduction number for infectious diseases Stat. Meth Med Res. 1993;2:23–41. doi: 10.1177/096228029300200103. [DOI] [PubMed] [Google Scholar]
- Drakeley C, et al. Altitude-dependent and -independent variations in Plasmodium falciparum prevalence in northeastern Tanzania. J Infect Dis. 2005a;191:1589–1598. doi: 10.1086/429669. [DOI] [PubMed] [Google Scholar]
- Drakeley C, et al. Estimating medium- and long-term trends in malaria transmission by using serological markers of malaria exposure. Proc Nat Acad Sci. 2005b;102:5108–5113. doi: 10.1073/pnas.0408725102. [DOI] [PMC free article] [PubMed] [Google Scholar]
- Drakeley C, et al. An estimation of the entomological inoculation rate for Ifakara: a semi-urban area in a region of intense malaria transmission in Tanzania. Trop Med Int Health. 2003;8:767–74. doi: 10.1046/j.1365-3156.2003.01100.x. [DOI] [PubMed] [Google Scholar]
- Durnez L, et al. False positive circumsporozoite protein ELISA: a challenge for the estimation of the entomological inoculation rate of malaria and for vector incrimination. Malar J. 2011;10:195. doi: 10.1186/1475-2875-10-195. [DOI] [PMC free article] [PubMed] [Google Scholar]
- Dye C. Vectorial capacity: Must we measure all its components? Parasitol. Today. 1986;2:203–209. doi: 10.1016/0169-4758(86)90082-7. [DOI] [PubMed] [Google Scholar]
- Eyles D, Young M. The duration of untreated or inadequately treated Plasmodium falciparum infections in the human host. J Nat, Malaria Soc. 1951;10:327–336. [PubMed] [Google Scholar]
- Felger I, et al. Molecular monitoring in malaria vaccine trials. Trends Parasitol. 2003;19:60–63. doi: 10.1016/s1471-4922(02)00066-1. [DOI] [PubMed] [Google Scholar]
- Felger I. The dynamics of natural Plasmodium falciparum infections. PLoS One. 2012;7:e45542. doi: 10.1371/journal.pone.0045542. [DOI] [PMC free article] [PubMed] [Google Scholar]
- Filipe JAN, et al. Determination of the mechanisms driving the acquisition of immunity to malaria using a mathematical transmission model. PLoS Comp Biol. 2007;3:e255. doi: 10.1371/journal.pcbi.0030255. [DOI] [PMC free article] [PubMed] [Google Scholar]
- Francis D, et al. Health facility-based malaria surveillance: the effects of age, area of residence and diagnostics on test positivity rates. Malar J. 2012;11:229. doi: 10.1186/1475-2875-11-229. [DOI] [PMC free article] [PubMed] [Google Scholar]
- Freeman J, et al. Effect of chemotherapy on malaria transmission among Yanomami Amerindians: Simulated consequences of placebo treatment. Am J Trop Med Hyg. 1999;60:774–780. doi: 10.4269/ajtmh.1999.60.774. [DOI] [PubMed] [Google Scholar]
- Garrett-Jones C. The human blood index of malaria vectors in relation to epidemiological assessment. Bull World Health Organ. 1964;30:241–261. [PMC free article] [PubMed] [Google Scholar]
- Gething PW, et al. A long neglected world malaria map: Plasmodium vivax endemicity in 2010. PLoS Negl Trop Dis. 2012;6:e1814. doi: 10.1371/journal.pntd.0001814. [DOI] [PMC free article] [PubMed] [Google Scholar]
- Gething PW, et al. Estimating the number of paediatric fevers associated with malaria infection presenting to Africa’s public health sector in 2007. PLoS Med. 2010;7:e1000301. doi: 10.1371/journal.pmed.1000301. [DOI] [PMC free article] [PubMed] [Google Scholar]
- Gething PW, et al. A new world malaria map: Plasmodium falciparum endemicity in 2010. Malar J. 2011;10:378. doi: 10.1186/1475-2875-10-378. [DOI] [PMC free article] [PubMed] [Google Scholar]
- Ghani AC, et al. Loss of population levels of immunity to malaria as a result of exposure-reducing interventions: consequences for interpretation of disease trends. PLoS One. 2009;4:e4383. doi: 10.1371/journal.pone.0004383. [DOI] [PMC free article] [PubMed] [Google Scholar]
- Grab B, Pull JH. Statistical considerations in serological surveys of population with particular reference to malaria. J Trop Med Hyg. 1974;77:222–232. [PubMed] [Google Scholar]
- Graves PM, et al. Measurement of malarial infectivity of human populations to mosquitoes in the Madang area, Papua, New Guinea. Parasitol. 1988;96:251–63. doi: 10.1017/s003118200005825x. [DOI] [PubMed] [Google Scholar]
- Graves PM, et al. Estimation of Anopheline survival rate, vectorial capacity and mosquito infection probability from malaria vector infection rates in villages near Madang, Papua New Guinea. J Appl Ecol. 1990;27:134–147. [Google Scholar]
- Griffin JT, et al. Reducing Plasmodium falciparum malaria transmission in Africa: a model-based evaluation of intervention strategies. Plos Med. 2010;7 doi: 10.1371/journal.pmed.1000324. [DOI] [PMC free article] [PubMed] [Google Scholar]
- Guerra CA, et al. The limits and intensity of Plasmodium falciparum transmission: implications for malaria control and elimination worldwide. PLoS Med. 2008;5:300–311. doi: 10.1371/journal.pmed.0050038. [DOI] [PMC free article] [PubMed] [Google Scholar]
- Guitard J, et al. Plasmodium falciparum population dynamics in a cohort of pregnant women in Senegal. Malar J. 2010;16:165. doi: 10.1186/1475-2875-9-165. [DOI] [PMC free article] [PubMed] [Google Scholar]
- Hagmann R, et al. Malaria and its possible control on the island of Principe. Malar J. 2003;2:15. doi: 10.1186/1475-2875-2-15. [DOI] [PMC free article] [PubMed] [Google Scholar]
- Hay S, et al. Measuring malaria endemicity from intense to interrupted transmission Lancet Infect. Dis. 2008;8:369–378. doi: 10.1016/S1473-3099(08)70069-0. [DOI] [PMC free article] [PubMed] [Google Scholar]
- Hay S, Snow RW. The Malaria Atlas Project: developing global maps of malaria risk. PLoS Med. 2006;3:e473. doi: 10.1371/journal.pmed.0030473. [DOI] [PMC free article] [PubMed] [Google Scholar]
- Hay SI, et al. Annual Plasmodium falciparum entomological inoculation rates (EIR) across Africa: literature survey, internet access and review. Trans R Soc Trop Med Hyg. 2000;94:113–126. doi: 10.1016/s0035-9203(00)90246-3. [DOI] [PMC free article] [PubMed] [Google Scholar]
- Hsiang MS, et al. Surveillance for malaria elimination in Swaziland: A national cross-sectional study using pooled PCR and serology. PLoS One. 2012;7:e29550. doi: 10.1371/journal.pone.0029550. [DOI] [PMC free article] [PubMed] [Google Scholar]
- Jawara M, et al. Field testing of different chemical combinations as odour baits for trapping wild mosquitoes in The Gambia. PLoS One. 2011;6:e19676. doi: 10.1371/journal.pone.0019676. [DOI] [PMC free article] [PubMed] [Google Scholar]
- Jensen TP, et al. Use of the slide positivity rate to estimate changes in malaria incidence in a cohort of Ugandan children. Malar J. 2009;8:213. doi: 10.1186/1475-2875-8-213. [DOI] [PMC free article] [PubMed] [Google Scholar]
- Johnston GL, et al. Malaria’s missing number: calculating the human component of R0 by a within-host mechanistic model of Plasmodium falciparum infection and transmission. PLoS Comput Biol. 2013;9:e1003025. doi: 10.1371/journal.pcbi.1003025. [DOI] [PMC free article] [PubMed] [Google Scholar]
- Kagan IG, et al. The serology of malaria: Recent applications. Bull N Y Acad Med. 1969;45:1027–1042. [PMC free article] [PubMed] [Google Scholar]
- Kelly-Hope LA, McKenzie FE. The multiplicity of malaria transmission: a review of entomological inoculation rate measurements and methods across sub-Saharan Africa. Malar J. 2009;8:19. doi: 10.1186/1475-2875-8-19. [DOI] [PMC free article] [PubMed] [Google Scholar]
- Killeen GF, et al. A simplified model for predicting malaria entomologic inoculation rates based on entomologic and parasitologic parameters relevant to control. Am J Trop Med Hyg. 2000;62:535–44. doi: 10.4269/ajtmh.2000.62.535. [DOI] [PMC free article] [PubMed] [Google Scholar]
- Killeen GF, et al. Infectiousness of malaria-endemic human populations to vectors. Am J Trop Med Hyg. 2006;75:38–45. doi: 10.4269/ajtmh.2006.75.2_suppl.0750038. [DOI] [PubMed] [Google Scholar]
- Knols BGJ, et al. Differential attractiveness of isolated humans to mosquitoes in Tanzania. Trans R Soc Trop Med Hyg. 1995;89:604–606. doi: 10.1016/0035-9203(95)90406-9. [DOI] [PubMed] [Google Scholar]
- Koepfli C, et al. How much remains undetected? Probability of molecular detection of human Plasmodia in the field. PLoS One. 2011;6:e19010. doi: 10.1371/journal.pone.0019010. [DOI] [PMC free article] [PubMed] [Google Scholar]
- Kolakovich KA, et al. Plasmodium vivax: favored gene frequencies of the merozoite surface protein-1 and the multiplicity of infection in a malaria endemic region. Exp Parasitol. 1996;83:11–19. doi: 10.1006/expr.1996.0044. [DOI] [PubMed] [Google Scholar]
- Li X, et al. Estimating and testing haplotype-trait association in non-diploid populations. Appl Statist. 2009;58:663–678. doi: 10.1111/j.1467-9876.2009.00673.x. [DOI] [PMC free article] [PubMed] [Google Scholar]
- Lines JD, et al. Monitoring human-biting mosquitoes (Diptera: Culicidae) in Tanzania with light traps hung beside mosquito nets. Bull Ent Res. 1991;81:77–84. [Google Scholar]
- Lobel HO, et al. Interpretation of IHA titres for the study of malaria epidemiology. Bull World Health Organ. 1973;49:485–492. [PMC free article] [PubMed] [Google Scholar]
- Macdonald G. The analysis of the sporozoite rate. Trop Dis Bull. 1952;49:569–585. [PubMed] [Google Scholar]
- Macdonald G. Epidemiological basis of malaria control. Bull World Health Organ. 1956;15:613–626. [PMC free article] [PubMed] [Google Scholar]
- Macdonald G. The epidemiology and control of malaria. Oxford University Press; London: 1957. [Google Scholar]
- Macdonald G, Gockel G. The malaria parasite rate and interruption of transmission. Bull World Health Organ. 1964;31:365–377. [PMC free article] [PubMed] [Google Scholar]
- MacKinnon M, et al. Heritability of malaria in Africa. PLoS Med. 2005;2:1253–1259. doi: 10.1371/journal.pmed.0020340. [DOI] [PMC free article] [PubMed] [Google Scholar]
- MALERA. A research agenda for malaria eradication: health systems and operational research. The Malaria Eradication Research Agenda (malERA) Consultative Group on Health Systems. PLoS Med. 2011;8:e1000397. doi: 10.1371/journal.pmed.1000397. [DOI] [PMC free article] [PubMed] [Google Scholar]
- Marsh K. Malaria transmission and morbidity. Parassitologia. 1999;41:241–246. [PubMed] [Google Scholar]
- Mbogo CM, et al. Spatial and temporal heterogeneity of Anopheles mosquitoes and Plasmodium falciparum transmission along the Kenyan Coast. Am J Trop Med Hyg. 2003;68:734–742. [PubMed] [Google Scholar]
- Mbogo CN, et al. Evaluation of light traps for sampling anopheline mosquitoes in Kilifi, Kenya. J Am Mosq Control Assoc. 1993;9:260–3. [PubMed] [Google Scholar]
- Mbugi EV, et al. Multiplicity of infections and level of recrudescence in Plasmodium falciparum malaria in Mlimba, Tanzania. Afr J Biotech. 2006;5:1655–1662. [Google Scholar]
- McElroy PD, et al. Predicting outcome in malaria: correlation between rate of exposure to infected mosquitoes and level of Plasmodium falciparum parasitaemia. Am J Trop Med Hyg. 1994;51:523–532. [PubMed] [Google Scholar]
- Mendis K, et al. The neglected burden of Plasmodium vivax malaria. Am J Trop Med Hyg. 2001;64:97–106. doi: 10.4269/ajtmh.2001.64.97. [DOI] [PubMed] [Google Scholar]
- Molina-Cruz A, et al. Some strains of Plasmodium falciparum, a human malaria parasite, evade the complement-like system of Anopheles gambiae mosquitoes. Proc Natl Acad Sci. 2012;109:1957–62. doi: 10.1073/pnas.1121183109. [DOI] [PMC free article] [PubMed] [Google Scholar]
- Mueller I, et al. Force of infection is key to understanding the epidemiology of Plasmodium falciparum malaria in Papua New Guinean children. Proc Nat Acad Sci. 2012;109:10030–10035. doi: 10.1073/pnas.1200841109. [DOI] [PMC free article] [PubMed] [Google Scholar]
- Mueller I. Estimating the burden of malaria: the need for improved surveillance. PLos Med. 2011;8:e1001144. doi: 10.1371/journal.pmed.1001144. [DOI] [PMC free article] [PubMed] [Google Scholar]
- Muirhead-Thomson RC. The malarial infectivity of an African village population to mosquitoes (Anopheles gambiae) Am J Trop Med Hyg. 1957;6:971–979. doi: 10.4269/ajtmh.1957.6.971. [DOI] [PubMed] [Google Scholar]
- Nahlen BL, Low-Beer D. Building to collective impact: the Global Fund support for measuring reduction in the burden of malaria. Am J Trop Med Hyg. 2007;77:321–327. [PubMed] [Google Scholar]
- Najera JA. A critical review of the field application of a mathematical model of malaria eradication. Bull World Health Organ. 1974;50:449–457. [PMC free article] [PubMed] [Google Scholar]
- Nedelman J. A negative binomial model for sampling mosquitoes in a malaria survey. Biometrics. 1983;39:1009–1020. [PubMed] [Google Scholar]
- Ntoumi F, et al. Age-dependent carriage of multiple Plasmodium falciparum merozoite surface antigen-2 alleles in asymptomatic malaria infections. Am J Trop Med Hyg. 1995;52:81–88. doi: 10.4269/ajtmh.1995.52.81. [DOI] [PubMed] [Google Scholar]
- O’Meara W. Changes in the burden of malaria in sub-Saharan Africa. Lancet Infect Dis. 2010;10:505–576. doi: 10.1016/S1473-3099(10)70096-7. [DOI] [PubMed] [Google Scholar]
- O’meara WP, et al. Parasite prevalence: a static measure of dynamic infections. Am J Trop Med Hyg. 2007;77:246–249. [PMC free article] [PubMed] [Google Scholar]
- Okell LC, et al. Factors determining the occurrence of submicroscopic malaria infections and their relevance for control. Nature Comm. 2012;3:1237. doi: 10.1038/ncomms2241. [DOI] [PMC free article] [PubMed] [Google Scholar]
- Okiro E, et al. Age patterns of severe paediatric malaria and their relationship to Plasmodium falciparum transmission intensity. Malar J. 2009;8:4. doi: 10.1186/1475-2875-8-4. [DOI] [PMC free article] [PubMed] [Google Scholar]
- Okiro E, et al. Malaria paediatric hospitalization between 1999 and 2008 across Kenya. BioMed Central Med. 2009;7:75. doi: 10.1186/1741-7015-7-75. [DOI] [PMC free article] [PubMed] [Google Scholar]
- Onori E, Grab B. Indicators for the forecasting of malaria epidemics. Bull World Health Organ. 1980a;58:91–98. [PMC free article] [PubMed] [Google Scholar]
- Onori E, Grab B. Quantitative estimates of the evolution of a malaria epidemic in Turkey if remedial measures had not been applied. Bull World Health Organ. 1980b;58:32–16. [PMC free article] [PubMed] [Google Scholar]
- Owusu-Agyei S, et al. Incidence of symptomatic and asymptomatic Plasmodium falciparum infection following curative therapy in adult residents of northern Ghana. Am J Trop Med Hyg. 2001;65:197–203. doi: 10.4269/ajtmh.2001.65.197. [DOI] [PubMed] [Google Scholar]
- Paul REL, et al. Mating patterns in malaria parasite populations of Papua New Guinea. Science. 1995;269:1709–1711. doi: 10.1126/science.7569897. [DOI] [PubMed] [Google Scholar]
- Pull JH, Grab B. A simple epidemiological model for evaluating the malaria inoculation rate and the risk of infection in infants. Bull World Health Organ. 1974;51:507–516. [PMC free article] [PubMed] [Google Scholar]
- Reyburn H, et al. Association of transmission intensity and age with clinical manifestations and case fatality of severe Plasmodium falciparum malaria. J Am Med Assoc. 2005;293:1461–1470. doi: 10.1001/jama.293.12.1461. [DOI] [PubMed] [Google Scholar]
- Rogier C, et al. Plasmodium falciparum clinical malaria: lessons from longitudinal studies in Senegal. Parassitologia. 1999;41:255–259. [PubMed] [Google Scholar]
- Rogier C, Trape J. Malaria attacks in children exposed to high transmission: who is protected? Trans. R SocTrop Med Hyg. 1993;87:245–6. doi: 10.1016/0035-9203(93)90110-c. [DOI] [PubMed] [Google Scholar]
- Ross R. The prevention of malaria. E.P. Dutton & Company; New York: 1911. [Google Scholar]
- Sauerwein R, et al. Experimental human challenge infections can accelerate clinical malaria vaccine development. Nat Rev Immunol. 2011;11:57–64. doi: 10.1038/nri2902. [DOI] [PubMed] [Google Scholar]
- Saul AJ. A cyclical feeding model for pathogen transmission and its application to determine vectorial capacity from vector infection rates. J Appl Ecol. 1990;27:123–133. [Google Scholar]
- Schleiermacher D, et al. Increased multiplicity of Plasmodium falciparum infections and skewed distribution of individual msp1 and msp2 alleles during pregnancy in Ndiop, a Senegalese village with seasonal, mesoendemic malaria. Am J Trop Med Hyg. 2001;64:303–9. doi: 10.4269/ajtmh.2001.64.303. [DOI] [PubMed] [Google Scholar]
- Shilane D, et al. Confidence intervals for negative binomial random variables of high dispersion. Int J Biostat. 2010;6:10. doi: 10.2202/1557-4679.1164. [DOI] [PubMed] [Google Scholar]
- Silver JB. Mosquito Ecology: Field Sampling Methods. Springer; New York: 2008. [Google Scholar]
- Smith D, et al. Ross, Macdonald, and a theory for the dynamics and control of mosquito-transmitted pathogens. Plos Pathogens. 2012;8:e1002588. doi: 10.1371/journal.ppat.1002588. [DOI] [PMC free article] [PubMed] [Google Scholar]
- Smith D, et al. The entomological inoculation rate and Plasmodium falciparum infection in African children. Nature. 2005;438:492–495. doi: 10.1038/nature04024. [DOI] [PMC free article] [PubMed] [Google Scholar]
- Smith D, Hay S. Endemicity response timelines for Plasmodium falciparum elimination. Malar J. 2009;8:e87. doi: 10.1186/1475-2875-8-87. [DOI] [PMC free article] [PubMed] [Google Scholar]
- Smith D, McKenzie FE. Static and dynamics of malaria infection in Anopheles mosquitoes. Malar J. 2004;3:1–14. doi: 10.1186/1475-2875-3-13. [DOI] [PMC free article] [PubMed] [Google Scholar]
- Smith D, et al. Revisiting the basic reproductive number for malaria and its implications for malaria control. PLoS Biol. 2007a;5:e42. doi: 10.1371/journal.pbio.0050042. [DOI] [PMC free article] [PubMed] [Google Scholar]
- Smith DL. A quantitative analysis of transmission efficiency versus intensity for malaria. Nat Commun. 2010;1:108. doi: 10.1038/ncomms1107. [DOI] [PMC free article] [PubMed] [Google Scholar]
- Smith DL, et al. Standardising estimates of the Plasmodium falciparum parasite rate. Malar J. 2007b;6:131. doi: 10.1186/1475-2875-6-131. [DOI] [PMC free article] [PubMed] [Google Scholar]
- Smith T, et al. Relationships between the outcome of Plasmodium falciparum infection and the intensity of transmission in Africa. Am J Trop Med Hyg. 2004;71:80–86. [PubMed] [Google Scholar]
- Smith T, et al. Relationship between the entomologic inoculation rate and the force of infection for Plasmodium falciparum malaria. Am J Trop Med Hyg. 2006;75:11–18. doi: 10.4269/ajtmh.2006.75.2_suppl.0750011. [DOI] [PubMed] [Google Scholar]
- Smith T, et al. Attributable fraction estimates and case definitions for malaria in endemic areas. Stats Med. 1994;13:2345–2358. doi: 10.1002/sim.4780132206. [DOI] [PubMed] [Google Scholar]
- Snow R, et al. The global distribution of clinical episodes of Plasmodium falciparum malaria. Nature. 2005;434:214–217. doi: 10.1038/nature03342. [DOI] [PMC free article] [PubMed] [Google Scholar]
- Steketee R, et al. Impact of national malaria control scale-up programmes in Africa: magnitude and attribution of effects. Malar J. 2010;9:299. doi: 10.1186/1475-2875-9-299. [DOI] [PMC free article] [PubMed] [Google Scholar]
- Stevenson J, et al. Novel vectors of malaria parasites in the western highlands of Kenya [letter] Emerg Infect Dis. 2012;18:154–79. doi: 10.3201/eid1809.120283. [DOI] [PMC free article] [PubMed] [Google Scholar]
- Stewart L, et al. Rapid assessment of malaria transmission using age-specific sero-conversion rates. PLoS One. 2009;4:e6083. doi: 10.1371/journal.pone.0006083. [DOI] [PMC free article] [PubMed] [Google Scholar]
- Trape JF, Rogier C. Combating malaria morbidity and mortality by reducing transmission. Parasitol Today. 1996;12:236–240. doi: 10.1016/0169-4758(96)10015-6. [DOI] [PubMed] [Google Scholar]
- Trape JF, et al. Malaria and urbanization in Central Africa: The example of Brazzaville. Part V: Pernicious attacks and mortality. Trans Roy Soc Trop Med Hyg. 1987;81:34–42. doi: 10.1016/0035-9203(87)90475-5. [DOI] [PubMed] [Google Scholar]
- Utarini A, et al. Comparison of active and passive case cetection systems in Jepara District, Indonesia. Asia-Pacific J Publ Health. 2007;19:14–17. doi: 10.1177/10105395070190010401. [DOI] [PubMed] [Google Scholar]
- Vafa M. Multiplicity of Plasmodium falciparum infection in asymptomatic children in Senegal: relation to transmission, age and erythrocyte variants. Malar J. 2008;7:17. doi: 10.1186/1475-2875-7-17. [DOI] [PMC free article] [PubMed] [Google Scholar]
- WHO-GMP. Information note on recommended selection criteria for procurement of malaria rapid diagnostic tests (RDTs) WHO Global Malaria Programme; Geneva: 2012. [Google Scholar]
- WHO. World Malaria Report. WHO; Geneva: 2011. [Google Scholar]
- Wong J, et al. Standardizing operational vector sampling techniques for measuring malaria transmission intensity: evaluation of six mosquito collection methods in western Kenya. Malar J. 2013;12:143. doi: 10.1186/1475-2875-12-143. [DOI] [PMC free article] [PubMed] [Google Scholar]