

Abstract
Background:
Available evidence from India shows that the control of diabetes is poor in majority of the population. This escalates the risk of complications. There is no systematic review to estimate the magnitude of diabetic retinopathy (DR) in India.
Materials and Methods:
A systematic literature search was carried out in Ovid Medline and EMBASE databases using Mesh and key search terms. Studies which reported the proportion of people with diabetes with DR in a representative community population were included. Two independent reviewers reviewed all the retrieved publications. Data were extracted using a predefined form. Review Manager software was used to perform meta-analysis to provide a pooled estimate. Studies included were assessed for methodological quality using selected items from the STROBE checklist.
Results:
Seven studies (1999–2014; n = 8315 persons with diabetes) were included in the review. In the meta-analysis, 14.9% (95% confidence interval [CI] 10.7–19.0%) of known diabetics aged ≥30 years and 18.1% (95% CI 14.8–21.4) among those aged ≥50 years had DR. Heterogeneity around this estimate ranged from I2= 79–87%. No linear trend was observed between age and the proportion with DR. The overall methodological quality of included studies was moderate.
Conclusions:
Early detection of DR is currently not prioritized in public health policies for noncommunicable diseases and blindness programs. Methodological issues in studies suggest that the proportion of diabetics with DR is underestimated in the Indian population. Future research should emphasize more robust methodology for assessing diabetes and DR status.
Keywords: Diabetes, diabetic retinopathy, India, meta-analysis, screening
INTRODUCTION
Worldwide, the number of persons with diabetes is expected to increase exponentially, and 80% will be living in low- and middle-income countries (LMICs), particularly in India and China.[1] In 2000, 31.7 million people were reported to have diabetes in India, and this number is expected to rise to 79.4 million by 2030.[2] Between 1989 and 2005, a two-fold increase in the prevalence of diabetes was observed in urban areas (from 8.3% to 18.6%) with a more than a three-fold increase in rural populations (from 2.2% to 9.2%).[3] It has been estimated that 50–70% of diabetics in India have poor glycemic control, which increases the risk of complications such as diabetic retinopathy (DR).[4,5]
Worldwide, DR is a leading cause of vision loss in middle-aged populations,[6] and globally 34.6% of diabetics are estimated to have DR, i.e., approximately 93 million people worldwide.[7] However, there is no regional or country specific estimate for India which could be used to inform health policies and service delivery. Our preliminary search for published reviews conducted in PubMed Medline database used the following search terms(((”Diabetic Retinopathy” [Mesh]) AND (”Prevalence” [Mesh] OR “Epidemiology” [Mesh])) OR (”Review” [Publication Type] OR “Review Literature as Topic” [Mesh])) AND “India” [Mesh]), found only one narrative review that inadequately reported the prevalence of DR in the Indian population.[8] Recent global reviews of DR neither presented country-specific estimates nor assessed the methodological quality of the prevalence studies.[7,8,9] Therefore, we first systematically searched the literature and synthesized the data reporting rates of DR among persons with diabetes in Indian studies. Second, data from the Indian studies was pooled to estimate the overall rate of DR among persons with diabetes. Third, a detailed quality assessment was performed to report major methodological limitations.
MATERIALS AND METHODS
We conducted a systematic review and meta-analysis in accordance with the Preferred Reporting Items for Systematic Reviews statement.[10] A review protocol was developed which included the search strategy, inclusion and exclusion criteria, data extraction form, plan for analysis, and outline of evidence synthesis.
Identification of studies
The search for studies in electronic databases was conducted on May 01, 2015. Studies were identified through the following strategy:
A search for literature was conducted in Ovid Medline and EMBASE databases to identify studies reporting rates of DR among diabetics in the Indian population. The search terms used are described in [Appendix 1]. No start date was specified
Cross-referencing of eligible articles to identify additional studies that met our inclusion criteria was done
Key informants (i.e., known DR experts, including authors of the eligible studies) were contacted to identify other studies that could be included in our review
Bibliography of recent papers on DR [11] was hand searched to identify studies that may have been missed through the electronic database search.
Inclusion criteria
Population-based cross-sectional studies that provided information on the number of persons with type 1 and 2 or other forms of diabetes as well as the number of diabetics with DR
Studies conducted among adults aged 20 years and above
Studies which reported DR regardless of the modality used for diagnosis of DR were included.
Exclusion criteria
Facility based studies or studies of participants recruited through screening camps
Studies which did not describe the study design or method of enumeration or base-population (denominator).
Data collation and extraction
Initial screening was performed by two reviewers (NL and SN) independently to identify papers for inclusion and data extraction. Titles and abstracts of each citation were identified and inspected with reference to the inclusion and exclusion criteria. Relevant full-text papers were then assessed and reviewed by the two reviewers independently. Any disagreements were resolved by consensus and when this could not be reached, a third reviewer (ATJ) adjudicated. The quality of the studies included was assessed using the STROBE checklist. Corresponding authors of all papers were contacted to retrieve any additional or missing information.
Data extraction
Data were extracted on the following parameters: Year of study, setting of the study (urban and rural), region, study design, sample size and sampling frame, characteristics of participants, number of persons diagnosed with DR, and methods used to diagnose diabetes and to assess and grade DR.
Assessment of methodological quality of studies
Parameters used for quality assessment were sample size, whether peer-reviewed or not, participant response rate, study measurement, methods. The studies which mentioned these parameters clearly are categorized as at low risk of bias. Studies which mentioned these parameters vaguely and unclearly are categorized as at high risk of bias and unclear risk of bias, respectively.
Data analysis
Meta-analysis was performed using Review Manager Version 5.1 (Cochrane Informatics and Knowledge Management Centre, London, UK) and “metan” command in STATA Version 13 (Stata Corp, Texas, US). The I2 test was used to measure statistical heterogeneity across studies. A random–effects model was used when substantial heterogeneity was observed.[12] The uncertainty around heterogeneity was explored using subgroup analyses. Confidence intervals (CIs) for the prevalence estimate were calculated using the following formula (95% CI = prevalence ± 1.96 × standard error).[13] When standard deviations for the mean age were not reported, these were calculated using the formula (maximum − minimum/4).[14]
RESULTS
Search results
After removing duplicates, the electronic search identified 358 studies. Seven studies fulfilled the inclusion criteria [Figure 1].[11,15,16,17,18,19,20]
Figure 1.
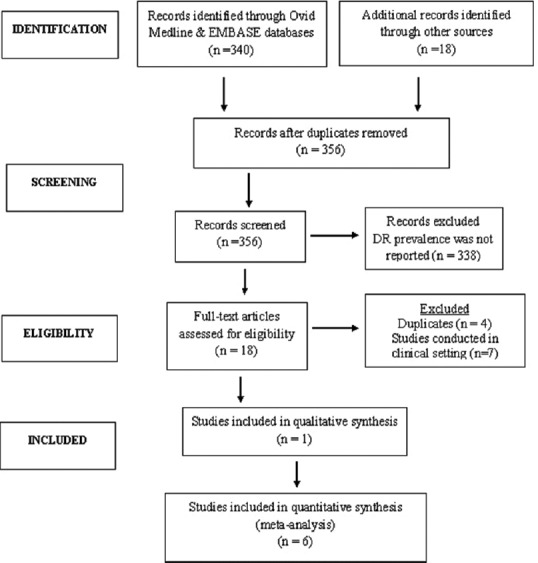
Preferred Reporting Items for Systematic Reviews flowchart
Study characteristics
Five of the seven studies were conducted in an urban population, particularly in the South of India [Table 1]. Five out of the seven studies were conducted in an urban population.[11,12,13,14,15,18,20] One study recruited both urban and rural populations,[17] and another recruited a semi-rural population.[16] Three studies were conducted in Tamil Nadu: two in urban Chennai [19,20] and one in Theni district.[17] Another two studies were conducted in the state of Maharashtra; Mumbai [11] and Nagpur.[16] The other studies were from Hyderabad, Telangana,[15] and Palakkad, Kerala.[18]
Table 1.
Characteristics of studies included in the review

Study design
All studies were population-based cross-sectional surveys. Four of the seven studies used a two-phase study design [Table 1].[11,17,19,20,21] In phase 1, potential and known diabetics (KD) were identified and invited for phase II, when a detailed retinal examination was performed. In two studies, both phases were conducted in a community setting,[17,18] whereas, in three studies, phase II evaluation took place in hospital settings.[11,19,20] In a further study free transport was arranged for all eligible participants to the base hospital for phase I and II clinical examinations. One study conducted phase I and phase II evaluations at temporary clinics established in the study catchment area.[15]
Characteristics of participants
Three of the seven studies recruited participants aged 30 years and above.[15,17] Two studies recruited those aged 40 years and above,[11,19] and the remaining studies recruited participants aged 50[18] and 20 years and above [Table 1].[20] The proportion of female participants ranged from 47.3% to 55.5%. One ongoing study did not provide information on the gender distribution.[17]
Diagnosis of diabetes
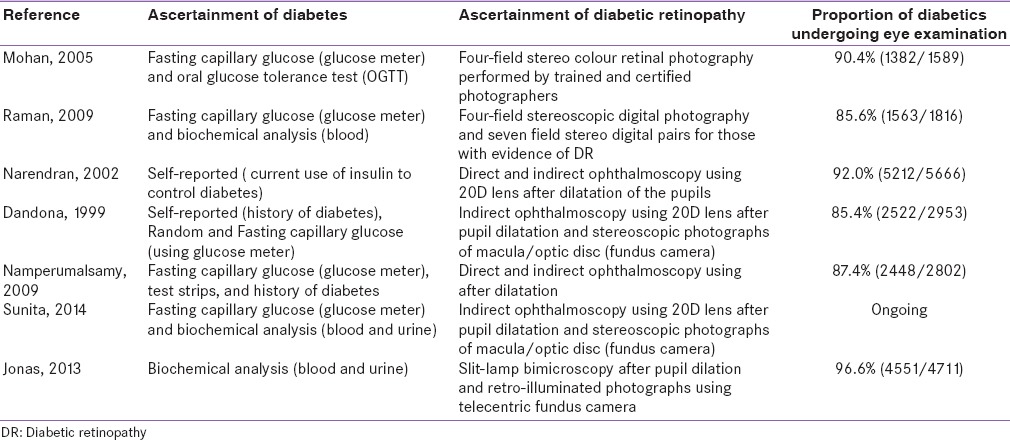
Diagnostic measurement and classification of diabetes varied greatly among studies [Table 2]. Most recruited both KD and newly detected diabetics (NDD). Five studies asked about a medical history of diabetes and tested blood glucose levels for those unaware of their diabetic status.[11,16,17,19,20] One study included only KD.[18] Another study assessed diabetes status only for participants whose fundus examination indicated the presence of DR.[15] Except one,[16] all the other studies mentioned the criteria for the diagnosis of diabetes. Study participants who reported a medical history of diabetes and were using drugs (either oral or insulin) were categorized as KD. For NDD, five of the seven studies performed fasting blood glucose (FBG) test using glucometer,[11,15,17,19,20] and of these, three studies conducted additional biochemical investigations, for example, oral glucose tolerance test, glycosylated hemoglobin estimation to confirm the diagnosis of diabetes.[11,19,20] In three out of seven studies, participants with FBG level ≥126 mg/dl were categorized as NDD;[11,17,20] whereas another study used FBG ≥110 mg/dl as the cutoff.[19] In one study, FBG was measured after the DR diagnosis and, fasting glucose level of more than 120 mg/dl was used to confirm the diagnosis.[15] One study mentioned that diabetes status was assessed by a blood glucose test and glycosylated hemoglobin, but cut-points were not presented.[16] Five out of seven studies used digital fundus cameras,[11,15,16,19,20] and two other studies used direct and indirect ophthalmoscopy alone for DR diagnosis.[17,18]
Table 2.
Methods used to aascertain diabetes and diabetic retinopathy
Methodological quality of studies
Overall, the methodological quality of the studies was moderate [Figure 2]. All included studies provided details of the sampling frame and sampling method used. In three studies the sample size calculation was unclear.[16,18] Two studies assessed FBG using a glucometer, and no further confirmatory investigations were performed for those who were not previously diagnosed as diabetic.[15,17] Another study applied self-reported information for diagnosis.[18] Two studies that applied direct and indirect ophthalmoscopy were rated as unclear for risk of bias.[17,18] In two studies, information on nonparticipants was not mentioned clearly and so were rated as having an unclear risk of bias.[11,15,16] External validity was discussed in all studies. However, in two studies, the findings were generalizable only to the study participants: One recruited participants from an urban slum,[11] and another recruited participant from an undefined catchment area that may not be representative of the target population.[18]
Figure 2.
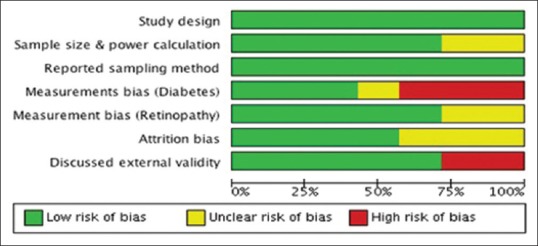
Risk of bias summary: Review authors' judgment about risk of bias
Proportion of diabetics with diabetic retinopathy
It was observed that between 9.6% and 26.8% of participants with diabetes had some degree of DR [Table 1]. Rates of DR were high among adults aged over 50 years, but there was no linear association of DR with age [Figure 3]. The prevalence was slightly higher among males as compared to females.
Figure 3.
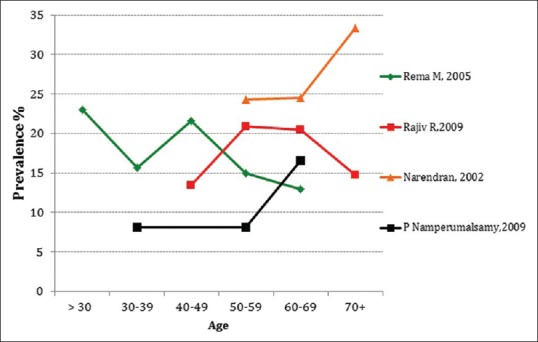
Proportion of diabetics with diabetic retinopathy by age group
Although age eligibility criteria differed among studies, most presented data by age group, allowing data to be pooled in the meta-analysis. About 14.9% (95% CI: 10.7–19.0%) of the diabetics aged 30 years and above had DR compared with 16.7% (95% CI: 14.2–19.2%) of those aged 40 years and above, and 18.09% (95% CI: 14.8–21.4%) of those aged 50 years and above [Figure 4]. High heterogeneity was observed around these estimates I2 = 79–87%.
Figure 4.

The meta-analyzed data showing the overall proportion of diabetics with diabetic retinopathy
DISCUSSION
The pooled prevalence of DR among known or NDD was 14.8% in persons aged 30 years and older, 16.7% in persons aged 40 years and older, and 18.1% in persons aged 50 years and older in the Indian population. We also observed sizeable variations in the prevalence of DR reported in these studies. Putative reasons for observed heterogeneity include differences in sample size, data collection methods, the definition of diabetes used, duration of diabetes, and procedure followed for diagnosis of retinopathy.
Our review found that the overall prevalence of DR among persons with diabetes in India to be lower than in high-income countries and other LMICs.[9,22,23] The DR prevalence is influenced by the risk factors such as poor control of blood glucose, undiagnosed diabetes, and high rates of blood pressure.[1] Although these risk factors are equally or highly prevalent in the Indian population,[24,25] interestingly, Indian studies found low prevalence. One possible explanation could be the difference in life expectancy of the population; the other could be the methodology issues in the Indian studies. It will be useful to identify the methodological issues so that better estimates can be generated.
We observed two major methodological problems in the Indian studies: (a) Accuracy of measurement of diabetes and (b) study design.[26,27]
Accuracy of measurement of diabetes
Blood glucose testing using a glucometer (which was used in the majority of studies), is recommended as a monitoring tool but not as a screening device. This is unlikely to achieve 100% sensitivity and specificity.[28,29] Low sensitivity will result in false negatives who would not be assessed for DR regardless of the study design, whereas low specificity will result in the assessment of those who are not diabetic. Low sensitivity and low specificity will, therefore, be likely to bias the studies of DR, with low specificity leading to an underestimation of the proportion with DR.
Study design issues
Two-phase versus one-phase design
A two-phase study design was common among the studies included in this review where a large random sample is first screened for diabetes, with referral for detailed eye examination of those known to be diabetic/newly diagnosed as diabetic. Although there are logistical advantages to this approach, there are important limitations. The main limitation is that not all those identified as diabetic will attend for ophthalmic examination. Indeed, in the studies included in the review response rates were lower in studies using a two-phase study design (range 85.6–90%) compared with those using a one-phase design (92% and 96%). If those that do not attend differ from those who do in relation to risk factors for DR, then estimates of the proportion with DR will be biased. This seems likely, as those with other complications of long-standing, poorly controlled diabetes, such as heart disease, amputations, or renal failure are less likely to attend but more likely to have DR. Indeed, those already blind from DR may see little value in attending for ophthalmic examination. A two-phase approach is, therefore, likely to underestimate the proportion with DR. At least 10% of negatives should be invited for phase two assessment, and in case, DR is detected in 10 false negatives that number should be weighted back to the composition of the base population for precise prevalence estimates.
In phase one, none of these studies invited persons scoring negative according to the screening test in the phase one. They should have been invited for phase two clinical and laboratory examination to confirm the diagnosis of diabetes and DR. None of the included studies adequately assessed the diabetes status. In this case, the denominator, number of persons with diabetes, is imprecise: Prevalence estimated in these studies may be underestimated.
Accuracy of diabetes diagnosis
All the DR studies in the review were subject to measurement bias. We noticed two main measurement issues: (a) Self-reported assessment and (b) use of glucometer for diabetes assessment.
Studies measuring diabetes status by self-reported information are likely to yield higher prevalence of DR. In India, 20% of patients with type 2 diabetes have retinopathy at the time of diagnosis and prevalence of undiagnosed diabetes range from 4.2% to 10.5%, which is two times more than KD.[30,31] One study, recruiting only KD by self-reporting, observed a higher prevalence of DR than other studies of the same age group.[18] Possibly, in this study, self-reported assessment could have yielded only diagnosed cases; hence, the denominator (number of persons with diabetes) is likely to be smaller and result in an overestimation of DR prevalence for persons aged 50 years and older.[18]
Estimation of DR prevalence among persons with diabetes requires the inclusion of all persons with diabetes (denominator). Inaccuracy in ascertainment of diabetic status might result in either overestimating or underestimating the prevalence of DR among persons with diabetes. In four of the seven included studies, FBG was measured using a glucometer for first line screening or to confirm the diagnosis of diabetes.[15,17,19,20] Several studies which have tested the efficacy of a glucometer for diagnosis of diabetes have reported a low sensitivity and specificity as compared to the measurement of plasma glucose concentration using venous samples with enzymatic assay techniques.[32,33] Technically, a screening test that produces a considerable number of false positives or negatives would pose a major problem for prevalence estimation. In the case of DR, precise estimation of prevalence depends on an accurate denominator (total number of persons with diabetes). Hence more than sensitivity, the specificity of a screening test is arguably important. A study conducted in a South Indian population applied the WHO fasting plasma glucose (FPG) ≥110 mg/dl criteria and found that sensitivity and specificity of FBG measured by glucometer were 62.8% and 62.9%.[34] Both sensitivity and specificity were even lower (58.3% and 58.6%) for the American Diabetes Association criteria for diabetes FPG ≥100 mg/dl.[34] In another study, participants classified as having provisional diabetes using a glucometer were reassessed by a laboratory venous sample at the base hospital. Surprisingly, one-third participants received nondiabetic value in the laboratory investigations.[35] Although the impact of a diagnostic test on the prevalence of DR is difficult to judge, it is possible that DR is underestimated in the Indian population as no studies assessed false negatives.
Limitations
The literature search was conducted only in electronic databases, and we did not attempt to retrieve gray literature (university thesis, conference proceeding, and unpublished reports from services organization). Second, a database search was restricted to Ovid Medline and EMBASE databases, and other electronic databases were not extensively searched. However, expert's group consultation provided reassurance that no published eligible studies from India were excluded in this review. Third, we could not perform meta-regression (as the number of studies was <10) to explore factors contributing to heterogeneity around the prevalence estimate.
CONCLUSIONS
India is experiencing an unprecedented health transition as well as a demographic shift. A major public health concern is the increasing magnitude of noncommunicable diseases, which already account for 80% of the global burden of disease. [36] While cancer and heart disease mainly contribute to mortality, conditions such as diabetes and blindness increase the number of years lived with disability. [37] In 2013, it was estimated that 20% (35.5 million) of world's population with undiagnosed diabetes live in India.[38] Compared to type 1 diabetes, people with type 2 diabetes can remain undiagnosed for many years and remain unaware of the complications caused by the disease. Therefore, early detection and management of diabetes and DR among persons with diabetes are quintessential for attenuating adverse consequences. Simultaneous efforts to bring changes at multiple levels in the health system and effective health education needed for diabetic patients would result in early detection of both DM and DR, thereby reducing the blindness due to DR.
Financial support and sponsorship
The study was supported by a grant from the Queen Elizabeth Diamond Jubilee Trust, London, UK
Conflicts of interest
There are no conflicts of interest
Acknowledgment
We acknowledge the support received from Arpit Awasthi, Gayathri Rao, Hemant Kumar Naik, Keerthi Reddy, Lobsang Tsering, Saurabh Gupta, Shilpy Bhat, Sreekrishna, and Susheela all of whom were involved in conducting the search for gray literature and screening included and excluded studies.
APPENDIX 1: SEARCH TERMS
Retinopathy.mp.
Exp diabetic retinopathy
Diabetic retinopathy.mp.
(diabet$ adj3 retinopath$).tw.
(preproliferative adj3 diabetic adj3 retinopathy).tw.
(proliferative adj3 diabetic adj3 retinopathy).tw.
Or/1-6
exp prevalence/
exp mass screening/
exp vision screening/
exp visual acuity/
Epidemiology.mp
Exp cross-sectional study/
Exp epidemiological studies/
Exp population surveillance/
Or/8-15
India.mp. or exp India/
7 and 16 and 17
Limit 18 to human
Limit 19 to (comment or editorial or letter)
REFERENCES
- 1.Scanlon PH, Aldington SJ, Stratton IM. Epidemiological issues in diabetic retinopathy. Middle East Afr J Ophthalmol. 2013;20:293–300. doi: 10.4103/0974-9233.120007. [DOI] [PMC free article] [PubMed] [Google Scholar]
- 2.Wild S, Roglic G, Green A, Sicree R, King H. Global prevalence of diabetes: Estimates for the year 2000 and projections for 2030. Diabetes Care. 2004;27:1047–53. doi: 10.2337/diacare.27.5.1047. [DOI] [PubMed] [Google Scholar]
- 3.Jayawardena R, Ranasinghe P, Byrne NM, Soares MJ, Katulanda P, Hills AP. Prevalence and trends of the diabetes epidemic in South Asia: A systematic review and meta-analysis. BMC Public Health. 2012;12:380. doi: 10.1186/1471-2458-12-380. [DOI] [PMC free article] [PubMed] [Google Scholar]
- 4.Joshi SR, Saboo B, Vadivale M, Dani SI, Mithal A, Kaul U, et al. Prevalence of diagnosed and undiagnosed diabetes and hypertension in India – Results from the screening India's twin epidemic (SITE) study. Diabetes Technol Ther. 2012;14:8–15. doi: 10.1089/dia.2011.0243. [DOI] [PubMed] [Google Scholar]
- 5.Venkataraman K, Kannan AT, Mohan V. Challenges in diabetes management with particular reference to India. Int J Diabetes Dev Ctries. 2009;29:103–9. doi: 10.4103/0973-3930.54286. [DOI] [PMC free article] [PubMed] [Google Scholar]
- 6.Roodhooft JM. Leading causes of blindness worldwide. Bull Soc Belge Ophtalmol. 2002;283:19–25. [PubMed] [Google Scholar]
- 7.Yau JW, Rogers SL, Kawasaki R, Lamoureux EL, Kowalski JW, Bek T, et al. Global prevalence and major risk factors of diabetic retinopathy. Diabetes Care. 2012;35:556–64. doi: 10.2337/dc11-1909. [DOI] [PMC free article] [PubMed] [Google Scholar]
- 8.Rema M, Pradeepa R. Diabetic retinopathy: An Indian perspective. Indian J Med Res. 2007;125:297–310. [PubMed] [Google Scholar]
- 9.Sivaprasad S, Gupta B, Crosby-Nwaobi R, Evans J. Prevalence of diabetic retinopathy in various ethnic groups: A worldwide perspective. Surv Ophthalmol. 2012;57:347–70. doi: 10.1016/j.survophthal.2012.01.004. [DOI] [PubMed] [Google Scholar]
- 10.Moher D, Liberati A, Tetzlaff J, Altman DG. PRISMA Group. Preferred reporting items for systematic reviews and meta-analyses: The PRISMA statement. Int J Surg. 2010;8:336–41. doi: 10.1016/j.ijsu.2010.02.007. [DOI] [PubMed] [Google Scholar]
- 11.Sunita M, Desai S, Vinay P, Moolani S, Rai N, Deepen S, et al. Aditya Jyot-diabetic retinopathy in Urban Mumbai Slums study (AJ-DRUMSS): Study design and methodology – Report 1. Ophthalmic Epidemiol. 2014;21:51–60. doi: 10.3109/09286586.2013.867509. [DOI] [PubMed] [Google Scholar]
- 12.Higgins JP, Thompson SG, Deeks JJ, Altman DG. Measuring inconsistency in meta-analyses. BMJ. 2003;327:557–60. doi: 10.1136/bmj.327.7414.557. [DOI] [PMC free article] [PubMed] [Google Scholar]
- 13.Campbell MJ. Statistics at Square One. 9th ed. London: BMJ Publishing Group; 1997. [Google Scholar]
- 14.Cox AR. Improving on the Range – Rule of thumb. Rose Hulman Undergrad Math J. 2012;13:1–13. [Google Scholar]
- 15.Dandona L, Dandona R, Naduvilath TJ, McCarty CA, Rao GN. Population based assessment of diabetic retinopathy in an urban population in Southern India. Br J Ophthalmol. 1999;83:937–40. doi: 10.1136/bjo.83.8.937. [DOI] [PMC free article] [PubMed] [Google Scholar]
- 16.Jonas JB, Nangia V, Khare A, Matin A, Bhojwani K, Kulkarni M, et al. Prevalence and associated factors of diabetic retinopathy in rural central India. Diabetes Care. 2013;36:e69. doi: 10.2337/dc12-2377. [DOI] [PMC free article] [PubMed] [Google Scholar]
- 17.Namperumalsamy P, Kim R, Vignesh TP, Nithya N, Royes J, Gijo T, et al. Prevalence and risk factors for diabetic retinopathy: A population-based assessment from Theni district, South India. Br J Ophthalmol. 2009;93:429–34. doi: 10.1136/bjo.2008.147934. [DOI] [PubMed] [Google Scholar]
- 18.Narendran V, John RK, Raghuram A, Ravindran RD, Nirmalan PK, Thulasiraj RD. Diabetic retinopathy among self reported diabetics in Southern India: A population based assessment. Br J Ophthalmol. 2002;86:1014–8. doi: 10.1136/bjo.86.9.1014. [DOI] [PMC free article] [PubMed] [Google Scholar]
- 19.Raman R, Rani PK, Reddi Rachepalle S, Gnanamoorthy P, Uthra S, Kumaramanickavel G, et al. Prevalence of diabetic retinopathy in India: Sankara nethralaya diabetic retinopathy epidemiology and molecular genetics study report 2. Ophthalmology. 2009;116:311–8. doi: 10.1016/j.ophtha.2008.09.010. [DOI] [PubMed] [Google Scholar]
- 20.Rema M, Premkumar S, Anitha B, Deepa R, Pradeepa R, Mohan V. Prevalence of diabetic retinopathy in urban India: The Chennai Urban rural epidemiology study (CURES) eye study, I. Invest Ophthalmol Vis Sci. 2005;46:2328–33. doi: 10.1167/iovs.05-0019. [DOI] [PubMed] [Google Scholar]
- 21.Song SJ, Wong TY. Current concepts in diabetic retinopathy. Diabetes Metab J. 2014;38:416–25. doi: 10.4093/dmj.2014.38.6.416. [DOI] [PMC free article] [PubMed] [Google Scholar]
- 22.Sivaprasad S, Gupta B, Gulliford MC, Dodhia H, Mohamed M, Nagi D, et al. Ethnic variations in the prevalence of diabetic retinopathy in people with diabetes attending screening in the United Kingdom (DRIVE UK) PLoS One. 2012;7:e32182. doi: 10.1371/journal.pone.0032182. [DOI] [PMC free article] [PubMed] [Google Scholar]
- 23.Zhang X, Saaddine JB, Chou CF, Cotch MF, Cheng YJ, Geiss LS, et al. Prevalence of diabetic retinopathy in the United States, 2005-2008. JAMA. 2010;304:649–56. doi: 10.1001/jama.2010.1111. [DOI] [PMC free article] [PubMed] [Google Scholar]
- 24.Kearney PM, Whelton M, Reynolds K, Whelton PK, He J. Worldwide prevalence of hypertension: A systematic review. J Hypertens. 2004;22:11–9. doi: 10.1097/00004872-200401000-00003. [DOI] [PubMed] [Google Scholar]
- 25.Beagley J, Guariguata L, Weil C, Motala AA. Global estimates of undiagnosed diabetes in adults. Diabetes Res Clin Pract. 2014;103:150–60. doi: 10.1016/j.diabres.2013.11.001. [DOI] [PubMed] [Google Scholar]
- 26.McNamee R. Efficiency of two-phase designs for prevalence estimation. Int J Epidemiol. 2003;32:1072–8. doi: 10.1093/ije/dyg230. [DOI] [PubMed] [Google Scholar]
- 27.Prince M. Commentary: Two-phase surveys. A death is announced; no flowers please. Int J Epidemiol. 2003;32:1078–80. doi: 10.1093/ije/dyg321. [DOI] [PubMed] [Google Scholar]
- 28.Altman DG, Bland JM. Diagnostic tests 1: Sensitivity and specificity. BMJ. 1994;308:1552. doi: 10.1136/bmj.308.6943.1552. [DOI] [PMC free article] [PubMed] [Google Scholar]
- 29.Loong TW. Understanding sensitivity and specificity with the right side of the brain. BMJ. 2003;327:716–9. doi: 10.1136/bmj.327.7417.716. [DOI] [PMC free article] [PubMed] [Google Scholar]
- 30.Mohan V, Sandeep S, Deepa R, Shah B, Varghese C. Epidemiology of type 2 diabetes: Indian scenario. Indian J Med Res. 2007;125:217–30. [PubMed] [Google Scholar]
- 31.Garg S, Davis RM. Diabetic retinopathy screening update. Clin Diabetes. 2009;27:140–5. [Google Scholar]
- 32.Bennett CM, Guo M, Dharmage SC. HbA(1c) as a screening tool for detection of Type 2 diabetes: A systematic review. Diabet Med. 2007;24:333–43. doi: 10.1111/j.1464-5491.2007.02106.x. [DOI] [PubMed] [Google Scholar]
- 33.American Diabetes Association. Screening for type 2 diabetes. Diabetes Care. 2003;26(suppl 1):s21–4. doi: 10.2337/diacare.26.2007.s21. [DOI] [PubMed] [Google Scholar]
- 34.Somannavar S, Ganesan A, Deepa M, Datta M, Mohan V. Random capillary blood glucose cut points for diabetes and pre-diabetes derived from community-based opportunistic screening in India. Diabetes Care. 2009;32:641–3. doi: 10.2337/dc08-0403. [DOI] [PMC free article] [PubMed] [Google Scholar]
- 35.Sharma T. How necessary is the second estimation of fasting plasma glucose level by laboratory venous blood to diagnose Type 2 diabetes, particularly in epidemiological studies? Ophthalmic Epidemiol. 2006;13:281–2. doi: 10.1080/09286580600695008. [DOI] [PubMed] [Google Scholar]
- 36.Murray CJ, Vos T, Lozano R, Naghavi M, Flaxman AD, Michaud C, et al. Disability-adjusted life years (DALYs) for 291 diseases and injuries in 21 regions, 1990-2010: A systematic analysis for the global burden of disease study 2010. Lancet. 2012;380:2197–223. doi: 10.1016/S0140-6736(12)61689-4. [DOI] [PubMed] [Google Scholar]
- 37.Vos T, Flaxman AD, Naghavi M, Lozano R, Michaud C, Ezzati M, et al. Years lived with disability (YLDs) for 1160 sequelae of 289 diseases and injuries 1990-2010: A systematic analysis for the global burden of disease study 2010. Lancet. 2012;380:2163–96. doi: 10.1016/S0140-6736(12)61729-2. [DOI] [PMC free article] [PubMed] [Google Scholar]
- 38.Guariguata L, Whiting DR, Hambleton I, Beagley J, Linnenkamp U, Shaw JE. Global estimates of diabetes prevalence for 2013 and projections for 2035. Diabetes Res Clin Pract. 2014;103:137–49. doi: 10.1016/j.diabres.2013.11.002. [DOI] [PubMed] [Google Scholar]