Abstract
The expansion of lipid droplets (LDs) and the differentiation of preadipocytes are two important aspects of mammalian lipid storage. In this study, we examined the role of CDP-diacylglycerol (DAG) synthases (CDSs), encoded by CDS1 and CDS2 genes in mammals, in lipid storage. CDS enzymes catalyze the formation of CDP-DAG from phosphatidic acid (PA). Knocking down either CDS1 or CDS2 resulted in the formation of giant or supersized LDs in cultured cells. Moreover, depleting CDS1 almost completely blocked the differentiation of 3T3-L1 preadipocytes, whereas depleting CDS2 had a moderate inhibitory effect on adipocyte differentiation. The levels of many PA species were significantly increased upon knocking down CDS1. In contrast, only a small number of PA species were increased upon depleting CDS2. Importantly, the amount of PA in the endoplasmic reticulum was dramatically increased upon knocking down CDS1 or CDS2. Our results suggest that the changes in PA level and localization may underlie the formation of giant LDs as well as the block in adipogenesis in CDS-deficient cells. We have therefore identified CDS1 and CDS2 as important novel regulators of lipid storage, and these results highlight the crucial role of phospholipids in mammalian lipid storage.
Keywords: lipin-1, peroxisome proliferator-activated receptor γ, phosphatidic acid, phosphatidylcholine, phosphatidylglycerol, phosphatidylinositol, phosphatidylinositol synthase, SEIPIN, triacylglycerol, cytidine 5′-diphosphate
Lipid droplets (LDs) are highly dynamic organelles that play a central role in mammalian energy storage. LDs are also involved in many cellular functions, including protein storage and degradation, and membrane and lipid trafficking (1–4). Each LD contains a hydrophobic neutral lipid core enclosed by a phospholipid monolayer (5). In mammals, the lipid core comprises mainly triacylglycerols (TAGs) and cholesteryl esters. The molecular events underlying the biogenesis of LDs remain to be determined (6). While several models have been proposed, the prevailing view is that LDs originate and bud from the endoplasmic reticulum (ER), followed by expansion and maturation (7). A recent study suggests that the fat storage-inducing transmembrane proteins are required for proper budding of LDs from the ER (8). The growth of LDs is not fully understood, as the size of LDs varies within different tissues and even within the same cell type (9). Recent studies have established the Cide family proteins, Cidec/FSP27 in particular, as key regulators of LD growth/fusion in adipocytes (10, 11). Phospholipids, especially phosphatidylcholine (PC) and phosphatidic acid (PA), also appear to be important regulators of LD growth and proliferation, as a decrease in PC or an increase in PA can both result in the formation of giant or “supersized” LDs (1, 9, 12, 13). LDs can also grow by lipid synthesis in situ, as TAG synthesis enzymes can relocate from the ER to the LD surface to mediate LD growth (14). Despite these important findings, our understanding of LD biogenesis and growth is still at its infancy, and additional mechanisms and regulators remain to be identified.
Changes in the cellular dynamics of LDs are associated with human metabolic disorders, such as obesity, atherosclerosis, and hepatic steatosis (15). The development of obesity is characterized by the accumulation of enlarged adipocytes loaded with giant LDs, which is due, at least in part, to enhanced LD expansion at the cellular level and adipocyte differentiation at the systemic level (16). Therefore, understanding the molecular mechanisms underlying the expansion of LDs and adipocyte development will provide insights into how therapeutic strategies can be developed against human metabolic diseases.
To identify novel gene products regulating the cellular dynamics of LDs, we carried out genome-wide screens in the budding yeast, Saccharomyces cerevisiae. Our initial screen identified Fld1p (yeast homolog of human SEIPIN) as a major regulator of LD growth. Fld1p/SEIPIN has been implicated in the metabolism of fatty acids and phospholipids (13, 17–19), as well as in TAG synthesis (20). Importantly, SEIPIN is also essential for adipocyte differentiation (13, 19, 21–23). Therefore, SEIPIN can regulate both cellular and systemic lipid storage. In subsequent genome-wide screens, we identified a number of additional gene products in yeast that impact LD growth. This includes CDP-diacylglycerol (DAG) synthase (CDS)1, which encodes a CDS on the ER. Knocking down CDS1 leads to formation of supersized LDs in yeast (13). In mammals, there are two CDS enzymes: CDS1 and CDS2 (24). CDS enzymes catalyze the formation of CDP-DAG from PA, the precursor for all phospholipids and TAG synthesis. CDS1 and CDS2 are believed to localize to the ER, where they regulate the synthesis of phosphatidylinositol (PI) and phosphatidylglycerol (PG) (25). Although the biochemical functions of CDS1 and CDS2 have been characterized, little is known about their involvement in cellular lipid storage (LD formation) and adipocyte differentiation. Here, we show that, like SEIPIN, CDS1 and CDS2 regulate both LD expansion and adipocyte development, most likely through modulating the level of PA on the ER.
MATERIALS AND METHODS
Cell culture, transfection, and treatments
HeLa cells were cultured in DMEM supplemented with 10% FBS and 1% penicillin/streptomycin, while 3T3-L1 preadipocytes were maintained in the same medium but containing 10% newborn calf serum instead of FBS. Transient transfections of siRNA were performed at 20 nM using Lipofectamine RNAiMAX reagent (Life Technologies) according to the manufacturer’s instructions. siRNAs against human or mouse CDS1 and CDS2 were purchased from Sigma-Aldrich and Shanghai GenePharma Co. Ltd (supplementary Table 1). Transient plasmid transfections were performed using Lipofectamine LTX Plus reagent (Life Technologies), consistent with the manufacturer’s instructions. ECFP-CDS1 was a gift from Dr. Beatriz Caputto and pmGFP-PASS, Rab10-mCherry, and green fluorescent protein (GFP)-PI synthase (PIS) were generously provided as gifts from Drs. Guangwei Du and Gia Voeltz. Oleate (Sigma) was dissolved in 0.1 M NaOH by heating at 90°C for 10 min, and then prepared as stock solution containing 5 mM oleate coupled with 5% fatty acid-free BSA (Sigma). To induce LD formation, the stock oleate solution was added into cell culture at indicated concentrations for a desired time period. To differentiate into adipocytes, 3T3-L1 preadipocytes were grown for 2 days after confluence. The medium was then changed to DMEM containing 10% FBS, 1% penicillin/streptomycin, 5 μg/ml insulin, 1 μM dexamethasone, and 0.5 mM isobutylmethylxanthine. After 2 days, dexamethasone and isobutylmethylxanthine were withdrawn, and insulin was kept in culture for an additional 2 days. Adipocytes were fully differentiated on day 8 after differentiation. Transient siRNA transfection was performed in preadipocytes at 50% confluence and reperformed 1 day prior to inducing differentiation.
Fluorescence microscopy
Cells grown on coverslips were fixed with 4% paraformaldehyde (ProSciTech) for 15 min at room temperature, followed by permeabilization with 0.1% Triton X-100 (Sigma) for 15 min. The LDs were stained with either BODIPY 493/503 (Life Technologies), Nile Red (Sigma), or HCS LipidTOX™ deep red neutral lipid stain (Life Technologies). In BODIPY staining, fixed cells were incubated with 2 μg/ml dye in 150 mM NaCl for 10 min at room temperature in the dark. Nile Red powder was dissolved in acetone to make a 0.5 mg/ml stock solution, which was then further diluted to 200 ng/ml in prechilled 75% glycerol and applied to cell staining for 45 min at room temperature in the dark. LipidTOX was applied for cell staining at 1:1,000 dilution for 45 min at room temperature in the dark. The mitochondria were stained with MitoTracker® Red FM (Life Technologies) at 1:10,000 dilution for 45 min at room temperature in the dark. The ER was stained with an indirect immunolabeling procedure. Fixed cells were blocked with 3% BSA for 1 h, and then incubated with rabbit anti-Calnexin (#2433, Cell Signaling Technology) at 1:50 dilution in 3% BSA overnight at 4°C, followed by incubation with Alexa Fluor® 594 conjugated goat anti-rabbit secondary antibody (1:500; Life Technologies) for 1 h at room temperature in the dark. Cells were viewed using an Olympus FV1200 confocal microscope. The 3D rendering was carried out using Huygens Essential software (Scientific Volume Imaging). The diameters of the LDs were measured using ImageJ software (National Institutes of Health).
Western blots
Cells were harvested in lysis buffer [50 mM HEPES (pH 7.4), 150 mM NaCl, 10% glycerol, 1% Triton X-100, 1 mM EGTA, 1 mM sodium orthovanadate, 10 mM sodium pyrophosphate, 100 mM sodium fluoride] containing additional commercial protease inhibitors (cOmplete™ ULTRA tablets; Roche) and phosphatase inhibitors (PhosSTOP tablets; Roche), and lysed using Bioruptor (Diagenode). Proteins were quantified by BCA assay (Sigma), and then subjected to electrophoresis on Bis-Tris gels under denatured and reducing conditions. Immunoblots were performed with the following primary antibodies: anti-CDS1 (#ab88121), anti-RFP (#ab65856), anti-phospho-IRE1α (#ab124945) (Abcam); anti-total-IRE1α (#3294), anti-phospho-eIF2α (#3597), anti-total-eIF2α (#2103), anti-CHOP (#5554), anti-Calnexin (#2433) (Cell Signaling Technology); anti-β-actin (#P2103) (Sigma); and anti-CGI-58 (#12201-1-AP) (ProteinTech).
Phospholipid extraction and MS
Phospholipids were extracted following Folch’s protocol (26). HeLa cells, grown in 10 cm dishes, were collected by scraping into PBS. Aliquots were preserved to determine the protein concentrations by BCA assay. Cells were pelleted by centrifugation at 800 g for 5 min, and then homogenized with 6 ml HPLC grade chloroform/methanol (2:1). The internal standards of phospholipids including PA 17:0/17:0, PC 19:0/19:0, phosphatidylethanolamine (PE) 17:0/17:0, PG 17:0/17:0, and PI 17:0/20:4 were added prior to rocking for 15 min at room temperature, followed by addition of 750 μl of ultra-pure water (Life Technologies). The mixture was spun down for 5 min at 1,500 g. The lower phase was transferred to a new glass tube, followed by addition of 1.2 ml of ultra-pure water, briefly vortexed, and spun at 800 g for 10 min. The lower phase, containing phospholipids, was transferred to glass vials and air-dried. Dried samples were reconstituted in 100 μl of chloroform/methanol (2:1) and subjected to HPLC-MS/MS using a Q-Exactive mass spectrometer. The phospholipids were separated by hydrophilic interaction LC using 5 mM ammonium formate and 0.1% formic acid, acquired using both positive and negative electrospray ionization mode, and analyzed using Lipid Search software.
Neutral lipid extraction and TLC
HeLa cells, grown in 10 cm dishes, were washed in PBS and lysed with 0.1 M NaOH with rocking for 10 min at room temperature. Then 0.1 M HCl was added to the culture dishes. The cell lysates were transferred to 15 ml tubes and the protein concentrations were determined by BCA assay. To the cell lysate, 2 ml of methanol was added, followed by 2 ml of hexane [adapted from (27)]. The mixture was vortexed for 30 s and spun at 1,000 g for 5 min. The top layer was transferred to a glass vial and air-dried. The neutral lipids were reconstituted in hexane, separated by TLC using a Silica Gel 60 plate (Millipore), and developed in a solvent system consisting of hexane/diethyl ether/glacial acetic acid (85:15:1). The lipids were stained with iodine vapors. The TLC plate was scanned using the Epson Perfection 4490 Photo, and the TAGs were quantified using ImageJ software.
LD isolation
The LD isolation was performed following the protocol described in (28). HeLa cells were transfected with siRNA for 48 h prior to the treatment with 200 μM oleate for an additional 16 h. Cells were harvested in PBS and pelleted at 1,000 g for 10 min. Then cells were resuspended in 10 ml of prechilled buffer A containing 20 mM tricine and 250 mM sucrose (pH 7.8, adjusted with KOH). The cell suspension was incubated on ice for 20 min. A dounce homogenizer was used to disrupt cells by gentle strokes for 25 times. The homogenate was centrifuged at 3,000 g for 10 min at 4°C to remove the nuclei, cell debris, and unbroken cells as pellet, and the supernatant was preserved as postnuclear supernatant (PNS). The PNS was transferred to the ultracentrifuge tube, followed by addition of 2 ml of buffer B containing 20 mM HEPES (pH 7.4), 100 mM KCl, and 2 mM MgCl2. The centrifugation was then performed at 182,000 g for 45 min at 4°C using a P40ST rotor on a Hitachi HIMAC ultracentrifuge. After ultracentrifugation, pellet was kept as total membrane (TM) fraction, solution from the middle of the gradient was saved as cytosolic fraction, and the LDs from the top band of the gradient were carefully collected. The TM fraction and LDs were washed with buffer B. Protein extracted from all fractions was subjected to Western blots and the phospholipids were extracted from LDs for lipidomic analysis.
Oleate incorporation
To measure oleate incorporation, HeLa cells were treated with 1 μCi 14C-oleate for 30 min in a humidified tissue culture incubator. Neutral lipids were extracted and developed using TLC, as mentioned above. The TLC plate was exposed to a BAS-MS imaging plate (Fujifilm) for 96 h, visualized using the FLA-5100 phosphorimager (Fujifilm), and quantified using ImageJ software.
Oil Red O staining
The fully differentiated 3T3-L1 adipocytes were fixed with 4% paraformaldehyde for 1 h at room temperature. Dishes were washed twice with ddH2O, followed by shaking in 60% isopropanol for 5 min at room temperature. Oil Red O (ORO; Sigma) was dissolved in 100% isopropanol to make a 0.5% stock solution. The ORO working solution was made by mixing 6 ml of stock solution with 4 ml of ddH2O. Adipocytes were stained with ORO working solution for 10 min, followed by 4 consecutive washes with ddH2O. Dishes were scanned using a UMAX scanner.
RNA extraction and quantitative real-time PCR
Total RNA was extracted using TrizolTM reagent (Life Technologies) according to the manufacturer’s protocol. RNA concentration and purity were estimated using Nanodrop spectrophotometer (Thermo Fischer Scientific). The RNA was then reverse-transcribed into cDNA using a Superscript VILO cDNA synthesis kit (Life Technologies). Quantitative RT-PCR (qRT-PCR) was performed with a Rotor-Gene 6000 real-time PCR machine (Qiagen) using SYBR Green (KAPA Biosystems). Primers are listed in supplementary Table 2.
Statistical analysis
All data are expressed as mean ± SD. Comparisons between two groups were analyzed by two-tailed t-test, while multiple groups were compared by one-way ANOVA using GraphPad Prism 6.0 software. Differences at values of P < 0.05 were considered significant.
RESULTS
Downregulation of CDSs results in the formation of supersized LDs
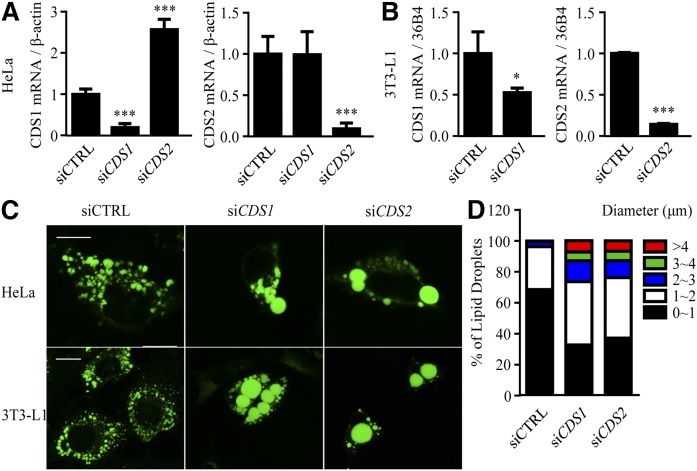
To determine whether CDSs in mammalian cells regulate the expansion/morphology of LDs, transient siRNA knockdown experiments were carried out in HeLa cells and 3T3-L1 preadipocytes (Fig. 1). Compared with the control, CDS1 was downregulated by 81 and 48% in HeLa and 3T3-L1 cells, respectively; whereas CDS2 was downregulated by ∼90% in both cell types. Notably, in siCDS2 HeLa cells, the mRNA expression of CDS1 was increased by 2.6-fold; but in siCDS1 cells, the CDS2 level was unchanged (Fig. 1A, B). The knockdown efficiency was confirmed using additional siRNAs (data not shown).
Fig. 1.
Knocking down CDS genes leads to the formation of supersized LDs. HeLa cells and 3T3-L1 preadipocytes were transfected with siCTRL, siCDS1, or siCDS2 for 48 h, followed by oleate treatment for an additional 16 h. A, B: mRNA expression levels of CDS1 and CDS2 were determined by qRT-PCR in HeLa cells (A) or 3T3-L1 preadipocytes (B) in the absence of oleate treatment. C: LDs were stained with BODIPY 493/503 in oleate-treated cells and visualized using a confocal microscope. Bar = 10 μm. D: LD size distribution in HeLa cells was determined. Data were collected by measuring the diameter of at least 1,000 LDs using the ImageJ software. A, B: Data are expressed as mean ± SD from at least three biological replicates. *P < 0.05, ***P < 0.001 versus siCTRL.
Fluorescence microscopy indicated that knocking down CDS1 or CDS2 in both HeLa and 3T3-L1 cells resulted in the formation of giant or supersized LDs (Fig. 1C). For the purpose of LD classification, we arbitrarily categorized LDs with diameters >2 μm as supersized LDs. The population of LDs with a diameter of ∼3–4 μm or >4 μm increased, whereas the population of LDs with a diameter <1 μm decreased in CDS1- or CDS2-deficient HeLa cells (Fig. 1D). Additional siRNAs were used to validate that downregulation of CDS1 or CDS2 formed supersized LDs (data not shown). A 3D rendering of negative control siRNA (siCTRL), siCDS1, and siCDS2 cells confirmed the supersized phenotype, and further validated the difference between the volume of normal LDs and supersized LDs (supplementary Fig. 1A–C).
Supersized LDs emerge following LD clustering upon CDS1 depletion
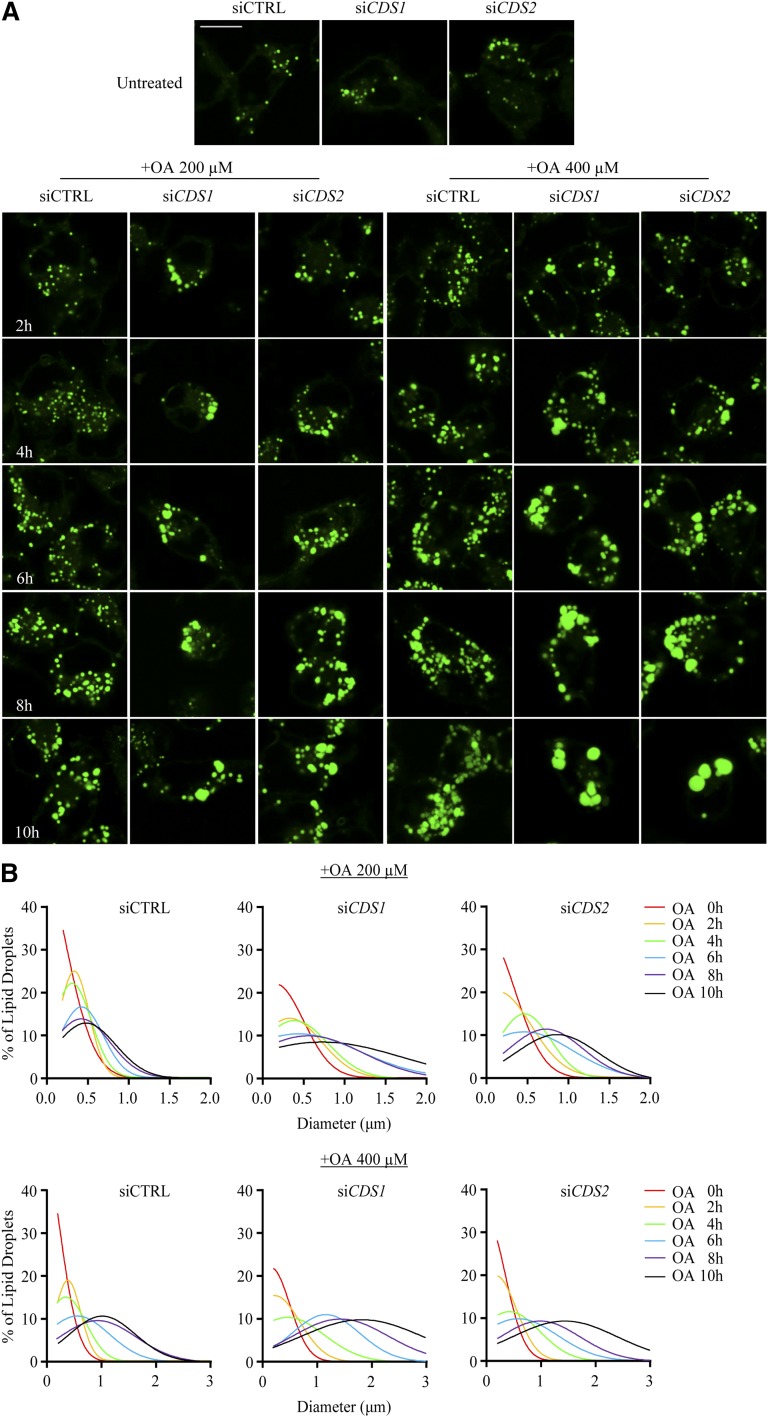
To characterize the formation of supersized LDs in greater detail, we first examined the dynamic LD formation over a 10 h treatment with oleate in HeLa cells. As shown in Fig. 2A, siCTRL cells exhibited only small LDs with no apparent change in distribution in response to 200 μM oleate. In contrast, LD clustering appeared as early as 4 h posttreatment in siCDS1 cells, while it could be observed, to a lesser extent, at 8 h in siCDS2 cells. In comparison to the 200 μM treatment, treatment with 400 μM oleate resulted in the formation of obviously larger LDs, indicating that LD volume was increased according to the amount of oleate loading. The LD clustering phenotype in siCDS1 cells was further confirmed by 3D rendering (data not shown).
Fig. 2.
Supersized LDs develop from clustered LDs. HeLa cells were transfected with siCTRL, siCDS1, or siCDS2 for 48 h, followed by the treatment with oleate (OA) at 200 or 400 μM for indicated time points. A: LDs were stained with BODIPY 493/503 and visualized using a confocal microscope. Bar = 10 μm. B: Diameters of BODIPY-stained LDs were measured using the ImageJ software. The dynamic changes of LD size were analyzed by Gaussian distribution curves using GraphPad Prism software. Data were collected from at least 200 LDs in each treatment.
The dynamic change of LD size was then assessed by Gaussian distribution curves (Fig. 2B). The peak of curves representing the median diameter of LDs shifted along with the increase in oleate exposure time, reflecting oleate-induced LD growth in a time-dependent manner. Notably, up to 6 h posttreatment with 200 μM oleate, the mean value of LD diameters was approximately 0.43 μm in all three groups; however, in the following 4 h, it increased by 14, 62, and 87% in siCTRL, siCDS1, and siCDS2 cells, respectively. Meanwhile, treatment with 400 μM oleate almost doubled the mean LD diameter from 0.57 μm to 1.01 μm between 6 h to 10 h in siCTRL cells, whereas it drove the formation of supersized LDs with a mean diameter of 1.83 μm and 1.43 μm at 10 h in siCDS1 and siCDS2 cells, respectively.
Localization of CDS1 and CDS2
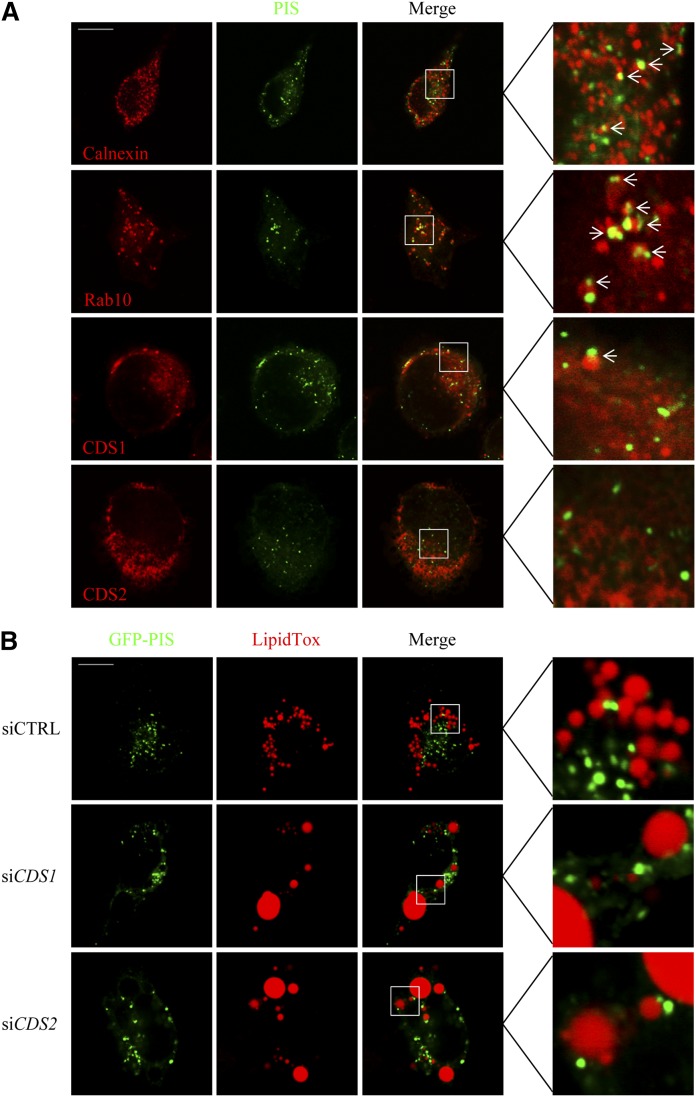
The ER plays a major role in membrane lipid synthesis and in LD biogenesis and growth. A recent study showed that Rab10 localizes to novel dynamic ER-associated structures that mark the leading ends of newly growing ER tubules (29). Importantly, PIS, the ER enzyme that mediates the conversion of CDP-DAG to PI, was found to localize to this Rab10 domain, and PIS functions immediately after CDS. CDS1 and CDS2 are known as ER enzymes that catalyze the synthesis of CDP-DAG to eventually produce PI, PG, and cardiolipin, but it is unclear whether they localize to different ER domains. Thus, we wondered whether either one or both CDS enzymes might colocalize with Rab10/PIS. We were also interested in the spatial relationship between LDs and the Rab10 domain, as it is not known whether LDs originate from or interact with specific ER domains. To this end, we cotransfected GFP-PIS with mCherry-Rab10, mCherry-CDS1, or CDS2-mCherry, and immunolabeled the ER using antisera against calnexin in HeLa cells (Fig. 3A). Fluorescence microscopy revealed that PIS only partially colocalized with calnexin, but it almost completely colocalized with Rab10. In contrast, although the overexpressed CDS1 and CDS2 were diffused in the cytoplasm, they poorly colocalized with PIS. To examine whether LDs closely interact with the Rab10/PIS domain, we stained LDs with LipidTox following transient transfection with GFP-PIS. Fluorescence microscopy indicated that the Rab10/PIS-associated ER structures and LDs rarely colocalized (Fig. 3B).
Fig. 3.
Subcellular localization of CDS1 and CDS2. A: Colocalization of PIS with ER marker, Rab10, and CDS1 and CDS2. HeLa cells were cotransfected with GFP-PIS, mCherry-Rab10, mCherry-CDS1, and CDS2-mCherry for 48 h. Calnexin was labeled by immunofluorescence staining. B: Colocalization of PIS with LDs. HeLa cells were transfected with GFP-PIS for 48 h, followed by the treatment with 200 μM oleate for 16 h. LDs were stained with LipidTox Deep Red. Colocalization was examined using a confocal microscope. Arrows indicate the colocalization spots.
TAG synthesis is increased in CDS1/2 knockdown cells
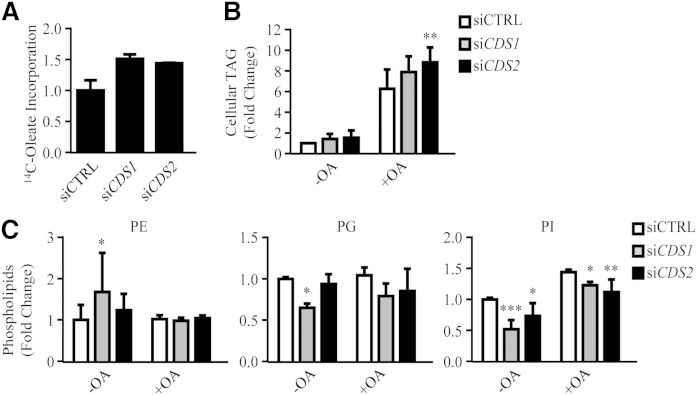
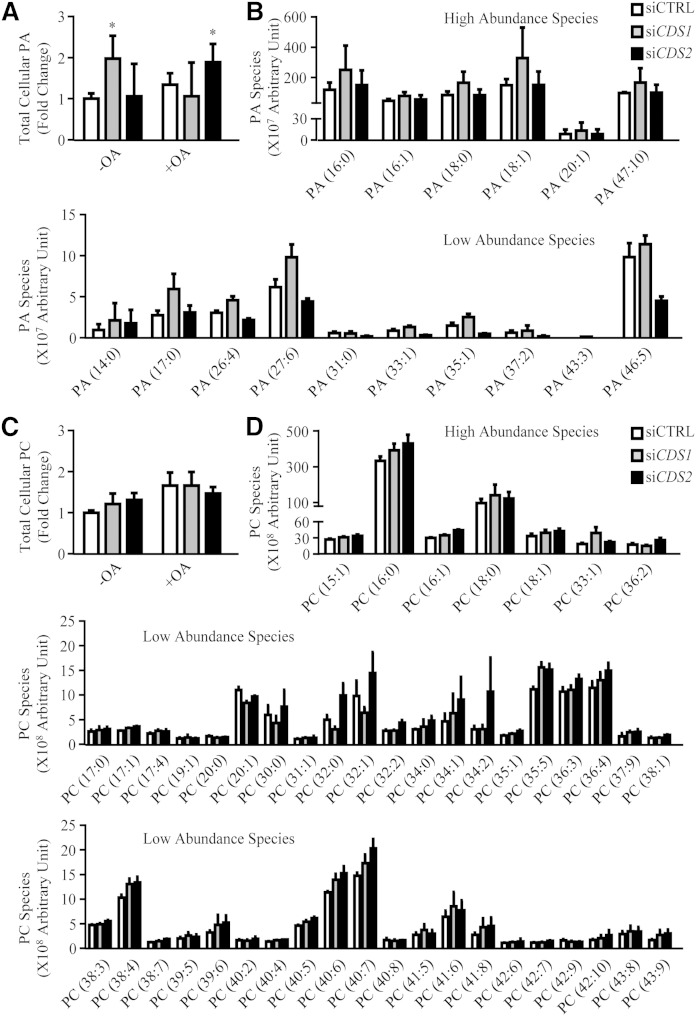
As CDS is the enzyme required for converting PA to CDP-DAG, downregulation of the CDS genes could cause an accumulation of PA and DAG, which could affect the synthesis of TAG, as well as that of PC and PE, through the Kennedy pathway. In fact, the formation of supersized LDs in siCDS1 and siCDS2 cells could result from excessive TAG accumulation and/or a reduction in total phospholipids, in particular PC and PE (12). We therefore measured the rate of oleate incorporation into TAG, as well as steady-state levels of TAG. siCDS1 and siCDS2 cells both exhibited an increase in the rate of oleate incorporation into TAG by approximately 50% (Fig. 4A). In the absence of oleate treatment, siCDS1 and siCDS2 increased cellular TAG by 42 and 55%, respectively; whereas only siCDS2 significantly increased steady-state levels of TAG in response to oleate (Fig. 4B). By lipidomic analysis, we further examined the cellular levels of PC, PE, PG, and PI (Fig. 4C; PC in Fig. 5C). As the CDS enzymes catalyze the synthesis of CDP-DAG, which is used to make PG and PI, downregulation of CDS1 or CDS2 indeed led to a decrease in PG and PI levels. Compared with relatively constant PG, PI was more sensitive in response to CDS1/2 knockdown. In contrast, no significant change in total PC and PE was detected.
Fig. 4.
Lipid profiles of CDS knockdown cells. HeLa cells were transfected with siCTRL, siCDS1, or siCDS2 for 48 h prior to the oleate (OA) treatment. A, B: Cells were pulsed with 14C-oleate for 30 min (A) or treated with oleate (OA) for an additional 16 h (B). Neutral lipids were extracted and separated on TLC. 14C-oleate incorporation was quantified using phosphorimager and ImageJ software (n = 2) (A). Total cellular TAG level was quantified using ImageJ software (n = 5) (B). C: Lipidomic analysis of phospholipids. Phospholipids were extracted in cells untreated or treated with OA for 16 h, subjected to HPLC-MS/MS, and analyzed using Lipid Search software (n ≥ 4). Data are expressed as mean ± SD. *P < 0.05, **P < 0.01, ***P < 0.001 versus siCTRL.
Fig. 5.
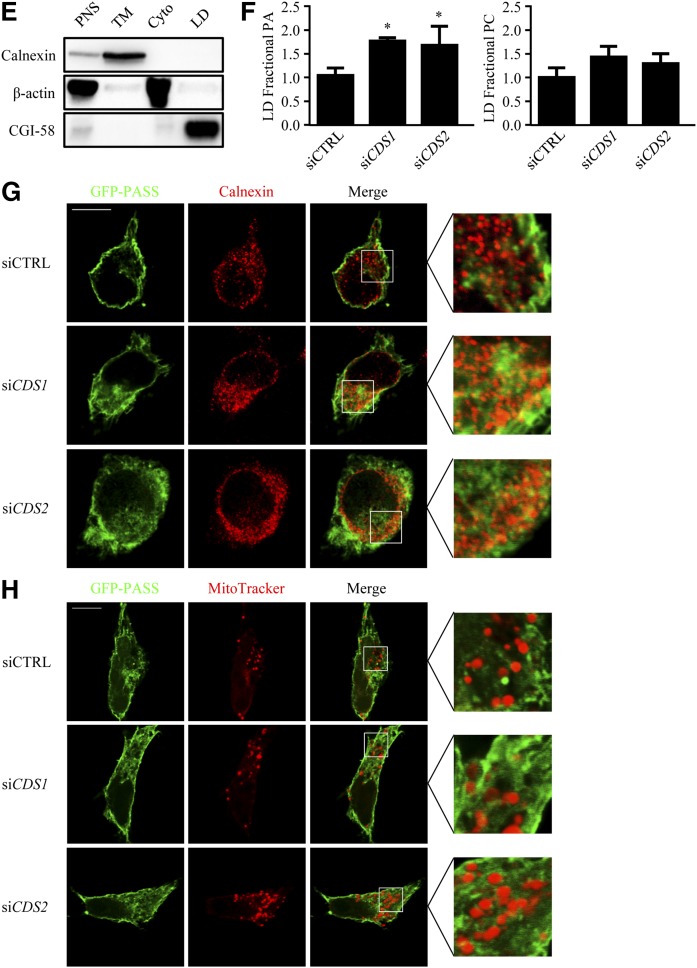
PA level upon depletion of CDS. HeLa cells were transfected with siCTRL, siCDS1, or siCDS2 for 48 h prior to the oleate (OA) treatment. A–D: Lipidomic analysis of cellular PA and PC (n ≥ 3). A, C: Phospholipids were extracted from cells untreated or treated with 200 μM oleate (OA) for an additional 16 h. B, D: PA or PC species in untreated cells. E, F: Lipidomic analysis of phospholipids in the LD fraction. After treatment with 200 μM OA for 16 h, LDs were isolated using density gradient ultracentrifugation. The PNS, TM, cytosolic (Cyto), and LD fractions were subjected to Western blots for a series of subcellular fraction markers, such as calnexin, β-actin, and CGI-58, as the control of cross-contamination (E). Phospholipids were extracted from the LD fraction (n = 3) (F). G, H: HeLa cells were cotransfected with siRNAs and GFP-PASS for 48 h. In the fixed cells, the ER was immunofluorescently stained with antisera against calnexin, and the mitochondria were stained with MitoTracker. Fluorescent images were taken using a confocal microscope. Data are expressed as mean ± SD. *P < 0.05 versus siCTRL.
PA metabolism upon CDS1 or CDS2 depletion
CDS enzymes synthesize CDP-DAG from PA, which is the precursor to the de novo synthesis of all major phospholipids. Previous studies have shown that this cone-shaped phospholipid possesses fusogenic properties, contributing to LD fusion and the development of supersized LDs in yeast (13). In the absence of oleate treatment, knocking down CDS1 led to a nearly 2-fold increase in total cellular PA (Fig. 5A). Of all PA species examined, some highly abundant species, such as 16:0, 18:0, and 18:1, as well as some less abundant species, such as 14:0, 17:0, 17:1, and 27:6, were substantially increased by siCDS1 in untreated cells (Fig. 5B). In contrast, siCDS2 did not affect total PA level in untreated cells, but significantly increased PA level in response to oleate treatment (Fig. 5A). In contrast to PA as the intermediate in the phospholipid synthesis pathway, PC level is much more abundant and constant. Indeed, neither total PC level nor PC species was profoundly changed upon CDS gene depletion (Fig. 5C, D).
As the measurement of total cellular PA cannot reveal any subcellular changes, we performed lipidomic analysis of PA level in isolated LDs from oleate-treated HeLa cells (Fig. 5E, F). Notably, PA level in the LD fraction was significantly increased after knocking down either CDS1 or CDS2; whereas the PC level in LDs was unchanged (Fig. 5F). We next examined the subcellular localization of PA using fluorescent labeling with GFP-PASS, a PA sensor that contains the repeat of the Spo20p51-91 domain fused to GFP specifically binding to PA (30). In the costaining of the endogenous ER marker, calnexin, fluorescence microscopy revealed that PA exhibited a ring-like distribution surrounding the ER in control cells; whereas knockdown of CDS1 or CDS2 led to an enhanced colocalization of GFP-PASS and calnexin, suggesting an accumulation of PA in the ER (Fig. 5G). As CDS1 and CDS2 could also affect mitochondrial lipids, we tested whether PA accumulates in the mitochondria upon CDS depletion. We stained the mitochondria with MitoTracker, and there was no significant colocalization between PASS and the MitoTracker (Fig. 5H).
CDS overexpression inhibits LD expansion
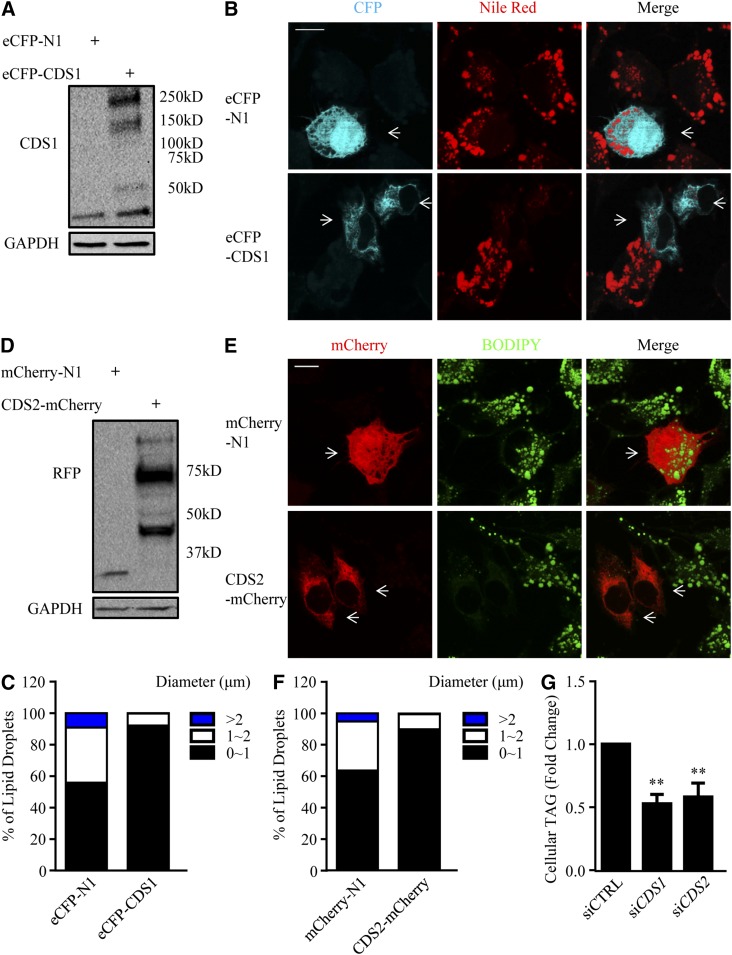
Because knocking down CDS1 or CDS2 formed supersized LDs, we wondered whether overexpressing CDS enzymes might have an opposite effect. For this purpose, we transiently transfected HeLa cells with eCFP-CDS1 or CDS2-mCherry, and their protein expression was detected by immunoblotting with CDS1 and RFP (against mCherry) antisera, respectively (Fig. 6A, D). Fluorescence microscopy indicated that overexpression of eCFP-CDS1 or CDS2-mCherry resulted in a dramatic reduction of LD number and size in HeLa cells (as indicated by arrows), as compared with either the untransfected cells in the same field or empty vector (eCFP-N1 and mCherry-N1) overexpressed cells (Fig. 6B, E). The population of LDs with a diameter >2 μm decreased, whereas the population of LDs with a diameter <1 μm increased by CDS1 or CDS2 overexpression (Fig. 6C, F). In addition, CDS1 and CDS2 overexpression substantially decreased total cellular TAG level by 47 and 42%, respectively (Fig. 6G), which was consistent with the reduced LD number and size, as observed in fluorescence microscopy (Fig. 6B, E).
Fig. 6.
CDS overexpression inhibits LD expansion. HeLa cells were transfected with eCFP-N1 and eCFP-CDS1 or mCherry-N1 and CDS2-mCherry for 48 h, followed by the treatment with oleate for 16 h. A, D: The protein lysates from untreated cells were subjected to Western blots against CDS1 (A), RFP (D), and GAPDH. B, E: LDs were stained with Nile Red (B) or BODIPY 493/503 (E) in oleate-treated cells and visualized using a confocal microscope. Bar = 10 μm. Arrows indicate the CDS-overexpressing cells. C, F: LD size distribution in HeLa cells was determined. Data were collected by measuring the diameter of at least 500 LDs using the ImageJ software. G: Cellular TAG level was determined by TLC following neutral lipid extraction and quantified using ImageJ software. Data are expressed as mean ± SD (n = 4). **P < 0.01 versus siCTRL.
CDS overexpression inhibits LD expansion in LPIN1 knockdown cells
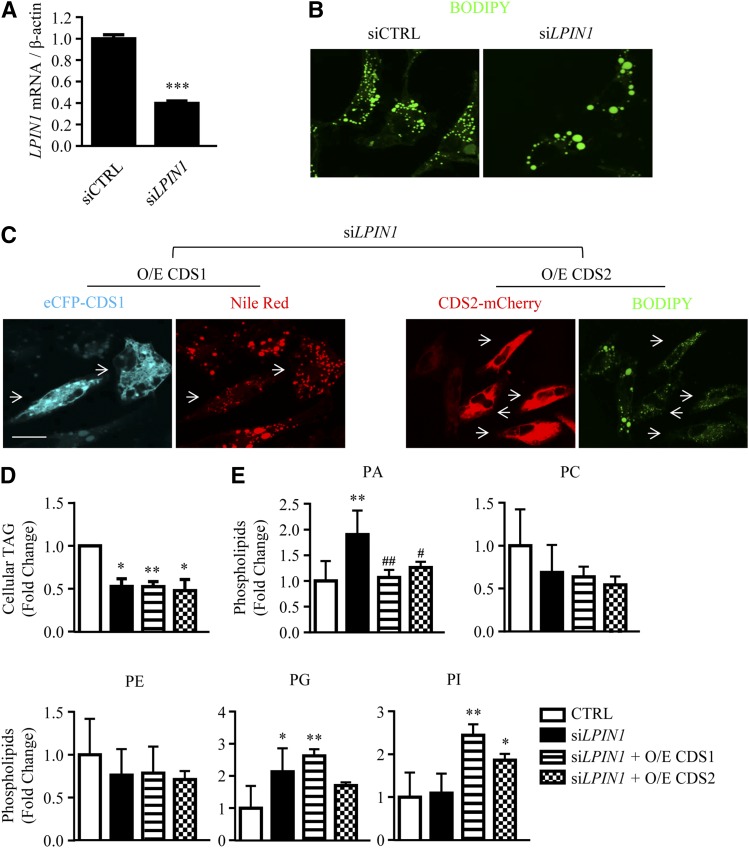
The data above suggest that CDS may modulate LD morphology through changing the level of PA on the ER and LDs. Besides CDS1 and CDS2, the PA phosphatase, lipin-1, can also metabolize PA by converting PA to DAG followed by TAG, PC, and PE synthesis. Lipin-1, encoded by LPIN1, is a known regulator of adipogenesis (31). To further investigate how CDS may regulate LD size, HeLa cells were transfected with siRNA against LPIN1, which decreased the LPIN1 mRNA level by 60% (Fig. 7A). Knocking down LPIN1 also resulted in the formation of supersized LDs (Fig. 7B). Notably, the siLPIN1-induced supersized LD phenotype could be substantially reversed by overexpressing eCFP-CDS1 or CDS2-mCherry (as indicated by arrows), as compared with those cells with no CDS overexpression in the same field (Fig. 7C). We next measured the total cellular TAG level (Fig. 7D). Single transfection with siLPIN1 resulted in a significant reduction of TAG content, indicating that the supersized LD phenotype in these cells is not caused by increased TAG. Notably, cotransfection with CDS1 or CDS2 in LPIN1 knockdown cells caused no further change in TAG, suggesting that CDS overexpression did not reverse the LD phenotype by modulating TAG content. We next examined the phospholipid content (Fig. 7E). siLPIN1 increased total PA in HeLa cells, and cotransfection of CDS with siLPIN1 did reduce PA, as compared with siLPIN1 alone. The levels of PC and PE showed no significant decrease upon depleting LPIN1, while the PG level increased. Overexpression of CDS1 or CDS2 increased the level of PI in LPIN1-deficient cells.
Fig. 7.
CDS overexpression inhibits LD expansion in LPIN1 knockdown cells. A, B: HeLa cells were transfected with siCTRL or siLPIN1 for 48 h, followed by the treatment with 200 μM oleate for an additional 16 h. The mRNA expression level of LPIN1 was determined by qRT-PCR in the absence of oleate treatment (n = 3) (A). LDs were stained with BODIPY 493/503 in oleate-treated cells, and visualized using a confocal microscope (B). C–E: Cotransfection of siRNAs with the plasmids encoding eCFP-CDS1 or CDS2-mCherry was performed in HeLa cells for 48 h. Cells were then treated with 400 μM oleate for an additional 8 h. LDs were stained with either Nile Red or BODIPY 493/503 and visualized using a confocal microscope. Bar = 10 μm. Arrows indicate the CDS-overexpressing cells (C). Cellular TAG level was determined in oleate-treated cells by TLC following neutral lipid extraction and quantified using ImageJ software (n = 4) (D). Phospholipids were extracted from untreated cells, subjected to HPLC-MS/MS, and analyzed using Lipid Search software (n = 4) (E). Data are expressed as mean ± SD. *P < 0.05, **P < 0.01, ***P < 0.001 versus control (CTRL). #P < 0.05, ##P < 0.01 versus siLPIN1.
Downregulation of CDS1 inhibits adipocyte differentiation
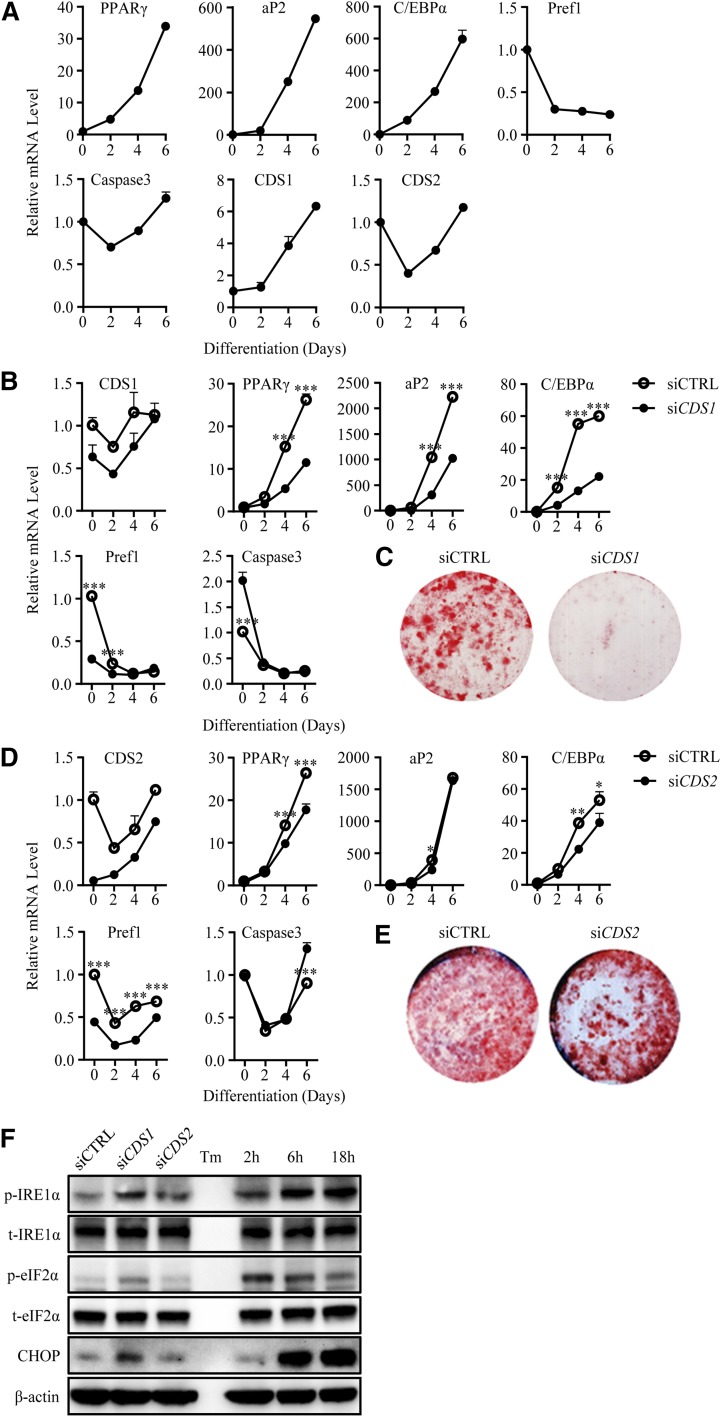
Besides LD expansion, PA has also been implicated in adipocyte differentiation (32–34). We hypothesized that the accumulation of PA in the ER and nuclear membrane upon CDS1/2 depletion could inhibit adipocyte differentiation by possibly interfering with PPARγ function. First, the mRNA levels of CDS1 and CDS2, along with adipocyte differentiation markers, such as PPARγ, aP2, C/EBPα, Pref1, and caspase 3, were determined on days 0, 2, 4, and 6 during the differentiation of 3T3-L1 preadipocytes (Fig. 8A). CDS1 mRNA expression steadily increased by 6.3-fold during the 6 day differentiation, while the CDS2 mRNA level exhibited a 60% decrease on day 2, followed by a recovery up to day 6. We next examined whether knockdown of CDS1 or CDS2 influences adipocyte differentiation. As shown in Fig. 8B, siRNA transfection substantially downregulated the CDS1 mRNA level during days 0–4, which is the determinant period in adipocyte differentiation. On day 4, knocking down CDS1 resulted in 65, 71, and 75% decreases in the PPARγ, aP2, and C/EBPα levels, respectively, indicative of an inhibition on adipocyte differentiation. In agreement, ORO staining further revealed that the adipocyte differentiation was almost completely blocked in siCDS1 cells on day 8 (Fig. 8C). In contrast, knocking down CDS2 led to statistically significant, but biologically marginal, changes in mRNA levels of PPARγ, aP2, and C/EBPα (Fig. 8D). In addition, there was no distinguishable difference between siCTRL and siCDS2 cells in ORO staining (Fig. 8E).
Fig. 8.
Knocking down CDS1 inhibits adipocyte differentiation. A–E: 3T3-L1 preadipocytes were induced to differentiate after transfection with siCTRL, siCDS1, or siCDS2 for 48 h. A, B, D: mRNA expression levels were determined by qRT-PCR on days 0, 2, 4, and 6 of differentiation. C, E: On day 8 of differentiation, 3T3-L1 cells were stained with ORO. F: 3T3-L1 preadipocytes were transfected with siRNAs for 72 h. Protein lysates were subjected to Western blotting. Tunicamycin (Tm; 2 μg/ml) was used for indicated time points as positive control. Data are expressed as mean ± SD (n = 3). *P < 0.05, **P < 0.01, ***P < 0.001.
ER stress has been shown to inhibit adipogenesis in vivo via unfolded protein responses (UPRs), such as phosphorylation of eIF2α and induction of CHOP, but not phosphorylation of IRE1α (35), whereas others demonstrate that these UPRs are required for adipogenesis both in vivo and in vitro (36). To interrogate whether ER stress was involved in siCDS1/2-induced suppression of adipocyte differentiation, we examined a variety of UPRs on day 0 of differentiation (Fig. 8F). Knocking down of CDS1 or CDS2 resulted in the phosphorylation of IRE1α in contrast, only siCDS1 induced phosphorylated eIF2α and CHOP. However, the intensity of siCDS1-induced UPRs was not comparable to that in cells treated with tunicamycin, a chemical ER stress inducer.
DISCUSSION
In this study, we examined the role of CDS, a key enzyme in phospholipid metabolism, in cellular lipid storage as well as in the differentiation of adipocytes. Our data demonstrate that both CDS1 and CDS2 can regulate the expansion of LDs. Notably, CDS1, but not CDS2, appears to be essential for adipogenesis. Our data provide an intimate link between the expansion of LDs at the cellular level and the differentiation of adipocytes at the systemic level, and suggest that phospholipids, e.g., PA, may play an important role in the regulation of two seemingly disparate processes.
LDs have now been recognized as dynamic organelles that constantly change their size and number (9). However, the molecular mechanisms underlying the expansion or contraction of LDs remains to be fully elucidated. Recent studies have identified key proteins, such as FSP27, in the growth of LDs in adipocytes, and have also revealed a role of phospholipids in determining the growth and size of the LDs (9, 10, 37). For instance, decreased cellular PC or increased PA can both lead to the formation of giant LDs, possibly involving FSP27-independent LD fusion. CDS is an important enzyme in phospholipid metabolism because it sits at a key branching point of phospholipid synthesis where it converts PA to CDP-DAG for PI and PG synthesis. Knocking down CDS1 or CDS2 was predicted to increase the amount of PA and reduce the amount of PI and PG. Indeed, PA did accumulate, especially in the ER (Fig. 5). The levels of PI and PG were decreased in CDS1-deficient cells (Fig. 4C). The impact of depleting CDS1 on the level of PI and PG is somewhat surprising: a previous study demonstrated that CDS is probably not a determining factor in controlling the de novo rate of PI synthesis or in establishing the cellular PI content, as overexpressing CDS1 does not increase the cellular levels of CDP-DAG or PI (24). Given the complexity in phospholipid synthesis pathways, additional studies are required to fully understand the effect of CDS1/2 depletion on cellular PI and PG synthesis.
In relation to the formation of supersized LDs upon knocking down CDS1 or CDS2, it appears that increased PA, but not decreased PI or PG, may play a major role. PG is primarily localized to mitochondria, whereas PI is not a fusogenic lipid. In addition, there are no drastic changes in the level of neutral lipids, PC and PE in these cells. Moreover, the critical role of PA in supersized LD formation is further supported when supersized LDs are formed upon LPIN1 knockdown (Fig. 7). Importantly, overexpression of CDS1 or CDS2 can restore normal LD morphology in LPIN1-depleted cells, likely through reducing the level of PA. Notably, overexpressing CDS1 or CDS2 did not further decrease the amount of TAG in siLPIN1 cells. Together, although a role for other lipid species, such as PI and its derivatives, in supersized LD formation cannot be ruled out, our data strongly suggest that PA may be a key regulator of LD growth in mammalian cells, as it is in yeast and fly (13, 38).
The differentiation of preadipocytes requires a transcriptional cascade that ultimately leads to the activation of the master regulator of terminal adipogenesis, PPARγ (39). Depleting CDS1 had a strong inhibitory effect on adipocyte development, whereas depleting CDS2 had a moderate inhibitory effect, possibly due to the upregulation of CDS1 mRNA (Fig. 1E). How does CDS regulate adipogenesis? Given the changes in phospholipid profile upon depleting CDS1 or CDS2, we hypothesize that PA may play a key role in this process as well. The master driver of adipogenesis, PPARγ, has a large ligand binding pocket that can be activated by various metabolites that originate from phospholipids and fatty acids (39). Despite the abundance of naturally occurring molecules that activate PPARγ in cell-based assays, the endogenous regulators of PPARγ that are of physiological importance remain poorly defined. The recent identification of cyclic PA as an antagonist of PPARγ adds another layer to the regulation of PPARγ activity (40, 41). Therefore, certain PA species could serve as direct antagonists of PPARγ. Alternatively, increased PA could affect posttranslational modifications of PPARγ or could trap PPARγ into certain membrane domains, preventing its activation. ER stress may be another factor that contributes to a blockage of adipogenesis in siCDS1 cells where eIF2α and CHOP are specifically activated. Given the severe effect of siCDS1 on adipogenesis, it is likely that both ER stress and PPARγ inhibition may play a role.
CDS is an evolutionarily conserved key enzyme in phospholipid metabolism. There is one CDS gene in yeast or fly, but there are two CDS genes in mammals. CDS1 appears to be the main isozyme, as knocking down CDS1 led to drastic changes in the level of total PA. CDS1 and CDS2 also appear to be differentially regulated, as CDS1, but not CDS2, is upregulated during adipocyte differentiation (Fig. 8). Because both CDS1 and CDS2 are known to localize to the ER, we wondered whether the two isoforms localize to different ER subdomains. The recently discovered Rab10/PIS domain on the ER is associated with active membrane growth and phospholipid synthesis, but none of the CDS isoforms seems to colocalize with the PIS/Rab10 subdomain, despite the fact that PIS functions immediately after CDS (Fig. 3A). It is possible that the two isozymes may prefer different PA species as substrates because changes in different subsets of PA species were observed when CDS1 or CDS2 was knocked down (42). However, it remains possible that CDS1 and CDS2 localize to different subdomains on the ER.
In summary, we have discovered novel functions of a classic enzyme in phospholipid metabolism, CDS. Our results implicate PA as a possible key regulator of LD expansion and adipogenesis and highlight the important cellular and developmental functions of phospholipids.
Supplementary Material
Footnotes
Abbreviations:
- CDS
- CDP-diacylglycerol synthase
- DAG
- diacylglycerol
- ER
- endoplasmic reticulum
- GFP
- green fluorescent protein
- LD
- lipid droplet
- ORO
- Oil Red O
- PA
- phosphatidic acid
- PC
- phosphatidylcholine
- PE
- phosphatidylethanolamine
- PG
- phosphatidylglycerol
- PI
- phosphatidylinositol
- PIS
- phosphatidylinositol synthase
- PNS
- postnuclear supernatant
- PPARγ
- peroxisome proliferator-activated receptor-γ siCTRL, negative control siRNA
- TAG
- triacylglycerol
- TM
- total membrane
- UPR
- unfolded protein response
This work was supported the National Health and Medical Research Council, Australia, Grant 1027387 and by the Australian Research Council, Australia, Grant DP130100457. Mass spectrometry analysis for this work was carried out at the Bioanalytical Mass Spectrometry Facility, University of New South Wales and was supported in part by infrastructure funding from the New South Wales Government as part of its co-investment in the National Collaborative Research Infrastructure Strategy. H.Y. is a Senior Research Fellow of the National Health and Medical Research Council.
The online version of this article (available at http://www.jlr.org) contains a supplement.
REFERENCES
- 1.Brasaemle D. L., and Wolins N. E.. 2012. Packaging of fat: an evolving model of lipid droplet assembly and expansion. J. Biol. Chem. 287: 2273–2279. [DOI] [PMC free article] [PubMed] [Google Scholar]
- 2.Cermelli S., Guo Y., Gross S. P., and Welte M. A.. 2006. The lipid-droplet proteome reveals that droplets are a protein-storage depot. Curr. Biol. 16: 1783–1795. [DOI] [PubMed] [Google Scholar]
- 3.Farese R. V., and Walther T. C.. 2009. Lipid droplets finally get a little R-E-S-P-E-C-T. Cell. 139: 855–860. [DOI] [PMC free article] [PubMed] [Google Scholar]
- 4.Martin S., and Parton R. G.. 2006. Lipid droplets: a unified view of a dynamic organelle. Nat. Rev. Mol. Cell Biol. 7: 373–378. [DOI] [PubMed] [Google Scholar]
- 5.Ohsaki Y., Cheng J., Suzuki M., Shinohara Y., Fujita A., and Fujimoto T.. 2009. Biogenesis of cytoplasmic lipid droplets: From the lipid ester globule in the membrane to the visible structure. Biochim. Biophys. Acta. 1791: 399–407. [DOI] [PubMed] [Google Scholar]
- 6.Walther T. C., and Farese R. V.. 2012. Lipid droplets and cellular lipid metabolism. Annu. Rev. Biochem. 81: 687–714. [DOI] [PMC free article] [PubMed] [Google Scholar]
- 7.Murphy D. J., and Vance J.. 1999. Mechanisms of lipid-body formation. Trends Biochem. Sci. 24: 109–115. [DOI] [PubMed] [Google Scholar]
- 8.Choudhary V., Ojha N., Golden A., and Prinz W. A.. 2015. A conserved family of proteins facilitates nascent lipid droplet budding from the ER. J. Cell Biol. 211: 261–271. [DOI] [PMC free article] [PubMed] [Google Scholar]
- 9.Yang H., Galea A., Sytnyk V., and Crossley M.. 2012. Controlling the size of lipid droplets: lipid and protein factors. Curr. Opin. Cell Biol. 24: 509–516. [DOI] [PubMed] [Google Scholar]
- 10.Gong J., Sun Z., Wu L., Xu W., Schieber N., Xu D., Shui G., Yang H., Parton R. G., and Li P.. 2011. Fsp27 promotes lipid droplet growth by lipid exchange and transfer at lipid droplet contact sites. J. Cell Biol. 195: 953–963. [DOI] [PMC free article] [PubMed] [Google Scholar]
- 11.Sun Z., Gong J., Wu H., Xu W., Wu L., Xu D., Gao J., Wu J. W., Yang H., Yang M., et al. 2013. Perilipin1 promotes unilocular lipid droplet formation through the activation of Fsp27 in adipocytes. Nat. Commun. 4: 1594. [DOI] [PMC free article] [PubMed] [Google Scholar]
- 12.Krahmer N., Guo Y., Wilfling F., Hilger M., Lingrell S., Heger K., Newman H. W., Schmidt-Supprian M., Vance D. E., Mann M., et al. 2011. Phosphatidylcholine synthesis for lipid droplet expansion is mediated by localized activation of CTP:phosphocholine cytidylyltransferase. Cell Metab. 14: 504–515. [DOI] [PMC free article] [PubMed] [Google Scholar]
- 13.Fei W., Shui G., Zhang Y., Krahmer N., Ferguson C., Kapterian T. S., Lin R. C., Dawes I. W., Brown A. J., Li P., et al. 2011. A role for phosphatidic acid in the formation of “supersized” lipid droplets. PLoS Genet. 7: e1002201. [DOI] [PMC free article] [PubMed] [Google Scholar]
- 14.Wilfling F., Wang H., Haas J. T., Krahmer N., Gould T. J., Uchida A., Cheng J. X., Graham M., Christiano R., Fröhlich F., et al. 2013. Triacylglycerol synthesis enzymes mediate lipid droplet growth by relocalizing from the ER to lipid droplets. Dev. Cell. 24: 384–399. [DOI] [PMC free article] [PubMed] [Google Scholar]
- 15.Krahmer N., Farese R. V., and Walther T. C.. 2013. Balancing the fat: lipid droplets and human disease. EMBO Mol. Med. 5: 905–915. [DOI] [PMC free article] [PubMed] [Google Scholar]
- 16.Sun K., Kusminski C. M., and Scherer P. E.. 2011. Adipose tissue remodeling and obesity. J. Clin. Invest. 121: 2094–2101. [DOI] [PMC free article] [PubMed] [Google Scholar]
- 17.Fei W., Shui G., Gaeta B., Du X., Kuerschner L., Li P., Brown A. J., Wenk M. R., Parton R. G., and Yang H.. 2008. Fld1p, a functional homologue of human seipin, regulates the size of lipid droplets in yeast. J. Cell Biol. 180: 473–482. [DOI] [PMC free article] [PubMed] [Google Scholar]
- 18.Szymanski K. M., Binns D., Bartz R., Grishin N. V., Li W. P., Agarwal A. K., Garg A., Anderson R. G. W., and Goodman J. M.. 2007. The lipodystrophy protein seipin is found at endoplasmic reticulum lipid droplet junctions and is important for droplet morphology. Proc. Natl. Acad. Sci. USA. 104: 20890–20895. [DOI] [PMC free article] [PubMed] [Google Scholar]
- 19.Cui X., Wang Y. H., Tang Y., Liu Y. X., Zhao L. P., Deng J. N., Xu G. H., Peng X. G., Ju S. H., Liu G., et al. 2011. Seipin ablation in mice results in severe generalized lipodystrophy. Hum. Mol. Genet. 20: 3022–3030. [DOI] [PubMed] [Google Scholar]
- 20.Fei W., Li H., Shui G., Kapterian T. S., Bielby C., Du X., Brown A. J., Li P., Wenk M. R., Liu P., et al. 2011. Molecular characterization of seipin and its mutants: implications for seipin in triacylglycerol synthesis. J. Lipid Res. 52: 2136–2147. [DOI] [PMC free article] [PubMed] [Google Scholar]
- 21.Chen W., Yechoor V. K., Chang B. H., Li M. V., March K. L., and Chan L.. 2009. The human lipodystrophy gene product Berardinelli-Seip congenital lipodystrophy 2/seipin plays a key role in adipocyte differentiation. Endocrinology. 150: 4552–4561. [DOI] [PMC free article] [PubMed] [Google Scholar]
- 22.Cui X., Wang Y. H., Meng L. J., Fei W. H., Deng J. N., Xu G. H., Peng X. G., Ju S. H., Zhang L., Liu G., et al. 2012. Overexpression of a short human seipin/BSCL2 isoform in mouse adipose tissue results in mild lipodystrophy. Am. J. Physiol. Endocrinol Metab. 302: E705–E713. [DOI] [PubMed] [Google Scholar]
- 23.Prieur X., Dollet L., Takahashi M., Nemani M., Pillot B., Le May C., Mounier C., Takigawa-Imamura H., Zelenika D., Matsuda F., et al. 2013. Thiazolidinediones partially reverse the metabolic disturbances observed in Bscl2/seipin-deficient mice. Diabetologia. 56: 1813–1825. [DOI] [PubMed] [Google Scholar]
- 24.Lykidis A., Jackson P. D., Rock C. O., and Jackowski S.. 1997. The role of CDP-diacylglycerol synthetase and phosphatidylinositol synthase activity levels in the regulation of cellular phosphatidylinositol content. J. Biol. Chem. 272: 33402–33409. [DOI] [PubMed] [Google Scholar]
- 25.Kuchler K., Daum G., and Paltauf F.. 1986. Subcellular and submitochondrial localization of phospholipid-synthesizing enzymes in Saccharomyces cerevisiae. J. Bacteriol. 165: 901–910. [DOI] [PMC free article] [PubMed] [Google Scholar]
- 26.Folch J., Lees M., and Stanley G. H. S.. 1957. A simple method for the isolation and purification of total lipides from animal tissues. J. Biol. Chem. 226: 497–509. [PubMed] [Google Scholar]
- 27.Hara A., and Radin N. S.. 1978. Lipid extraction of tissues with a low-toxicity solvent. Anal. Biochem. 90: 420–426. [DOI] [PubMed] [Google Scholar]
- 28.Ding Y., Zhang S., Yang L., Na H., Zhang P., Zhang H., Wang Y., Chen Y., Yu J., Huo C., et al. 2013. Isolating lipid droplets from multiple species. Nat. Protoc. 8: 43–51. [DOI] [PubMed] [Google Scholar]
- 29.English A. R., and Voeltz G. K.. 2013. Rab10 GTPase regulates ER dynamics and morphology. Nat. Cell Biol. 15: 169–178. [DOI] [PMC free article] [PubMed] [Google Scholar]
- 30.Bohdanowicz M., Schlam D., Hermansson M., Rizzuti D., Fairn G. D., Ueyama T., Somerharju P., Du G., and Grinstein S.. 2013. Phosphatidic acid is required for the constitutive ruffling and macropinocytosis of phagocytes. Mol. Biol. Cell. 24: 1700–1712. [DOI] [PMC free article] [PubMed] [Google Scholar]
- 31.Koh Y. K., Lee M. Y., Kim J. W., Kim M., Moon J. S., Lee Y. J., Ahn Y. H., and Kim K. S.. 2008. Lipin1 is a key factor for the maturation and maintenance of adipocytes in the regulatory network with CCAAT/enhancer-binding protein alpha and peroxisome proliferator-activated receptor gamma 2. J. Biol. Chem. 283: 34896–34906. [DOI] [PMC free article] [PubMed] [Google Scholar]
- 32.Zhang P., Takeuchi K., Csaki L. S., and Reue K.. 2012. Lipin-1 phosphatidic phosphatase activity modulates phosphatidate levels to promote peroxisome proliferator-activated receptor gamma (PPARgamma) gene expression during adipogenesis. J. Biol. Chem. 287: 3485–3494. [DOI] [PMC free article] [PubMed] [Google Scholar]
- 33.Fei W., Du X., and Yang H.. 2011. Seipin, adipogenesis and lipid droplets. Trends Endocrinol. Metab. 22: 204–210. [DOI] [PubMed] [Google Scholar]
- 34.Péterfy M., Phan J., and Reue K.. 2005. Alternatively spliced lipin isoforms exhibit distinct expression pattern, subcellular localization, and role in adipogenesis. J. Biol. Chem. 280: 32883–32889. [DOI] [PubMed] [Google Scholar]
- 35.Han J., Murthy R., Wood B., Song B., Wang S., Sun B., Malhi H., and Kaufman R. J.. 2013. ER stress signalling through eIF2alpha and CHOP, but not IRE1alpha, attenuates adipogenesis in mice. Diabetologia. 56: 911–924. [DOI] [PMC free article] [PubMed] [Google Scholar]
- 36.Basseri S., Lhotak S., Sharma A. M., and Austin R. C.. 2009. The chemical chaperone 4-phenylbutyrate inhibits adipogenesis by modulating the unfolded protein response. J. Lipid Res. 50: 2486–2501. [DOI] [PMC free article] [PubMed] [Google Scholar]
- 37.Barneda D., Planas-Iglesias J., Gaspar M. L., Mohammadyani D., Prasannan S., Dormann D., Han G., Jesch S. A., Carman G. M., Kagan V., et al. 2015. The brown adipocyte protein CIDEA promotes lipid droplet fusion via a phosphatidic acid-binding amphipathic helix. Elife. 4: e07485. [DOI] [PMC free article] [PubMed] [Google Scholar]
- 38.Tian Y., Bi J. F., Shui G. H., Liu Z. H., Xiang Y. H., Liu Y., Wenk M. R., Yang H. Y., and Huang X.. 2011. Tissue-autonomous function of Drosophila seipin in preventing ectopic lipid droplet formation. PLoS Genet. 7: e1001364. [DOI] [PMC free article] [PubMed] [Google Scholar]
- 39.Tontonoz P., and Spiegelman B. M.. 2008. Fat and beyond: the diverse biology of PPARgamma. Annu. Rev. Biochem. 77: 289–312. [DOI] [PubMed] [Google Scholar]
- 40.Tsukahara T., Hanazawa S., Kobayashi T., Iwamoto Y., and Murakami-Murofushi K.. 2010. Cyclic phosphatidic acid decreases proliferation and survival of colon cancer cells by inhibiting peroxisome proliferator-activated receptor γ. Prostaglandins Other Lipid Mediat. 93: 126–133. [DOI] [PubMed] [Google Scholar]
- 41.Tsukahara T., Tsukahara R., Fujiwara Y., Yue J., Cheng Y., Guo H., Bolen A., Zhang C., Balazs L., Re F., et al. 2010. Phospholipase D2-dependent inhibition of the nuclear hormone receptor PPARgamma by cyclic phosphatidic acid. Mol. Cell. 39: 421–432. [DOI] [PMC free article] [PubMed] [Google Scholar]
- 42.D’Souza K., Kim Y. J., Balla T., and Epand R. M.. 2014. Distinct properties of the two isoforms of CDP-diacylglycerol synthase. Biochemistry. 53: 7358–7367. [DOI] [PMC free article] [PubMed] [Google Scholar]
Associated Data
This section collects any data citations, data availability statements, or supplementary materials included in this article.


