Summary
Alzheimer’s disease (AD) is a neurodegenerative disorder characterized by progressive memory decline and subsequent loss of broader cognitive functions1. Memory decline in early stages of Alzheimer’s is mostly limited to episodic memory, for which the hippocampus (HPC) plays a crucial role2. However, it has been uncertain whether the observed amnesia in early stages of Alzheimer’s is due to disrupted encoding and consolidation of episodic information, or an impairment in the retrieval of stored memory information. Here we show that in transgenic mouse models of early Alzheimer’s, direct optogenetic activation of hippocampal memory engram cells results in memory retrieval despite the fact that these mice are amnesic in long-term memory tests when natural recall cues are utilized, revealing a retrieval, rather than a storage impairment. Prior to amyloid plaque deposition, the amnesia in these mice is age-dependent3–5, which correlates with a progressive reduction of spine density of hippocampal dentate gyrus (DG) engram cells. We show that optogenetic induction of long-term potentiation (LTP) at perforant path (PP) synapses of DG engram cells restores both spine density and long-term memory. We also demonstrate that an ablation of DG engram cells containing restored spine density prevents the rescue of long-term memory. Thus, selective rescue of spine density in engram cells may lead to an effective strategy for treating memory loss in early stages of Alzheimer’s disease.
Main text
Alzheimer’s disease (AD) is the most common cause of brain degeneration, and typically begins with impairments in cognitive functions1. Most research has focused on understanding the relationship between memory impairments and the formation of two pathological hallmarks seen in late stages of AD: extracellular amyloid plaques and intracellular aggregates of tau protein1–2. Early phases of AD have received relatively less attention, although synaptic phenotypes have been identified as major correlates of cognitive impairments in both human patients and mouse models3,6. Several studies have suggested that the episodic memory deficit of AD patients is due to ineffective encoding of new information7–9. However, since cognitive measures used in these studies rely on memory retrieval, it is not possible to rigorously discriminate between impairments in information storage and disrupted retrieval of stored information. This issue has an important clinical implication: if the amnesia is due to retrieval impairments, memory could be restored by technologies involving targeted brain stimulation.
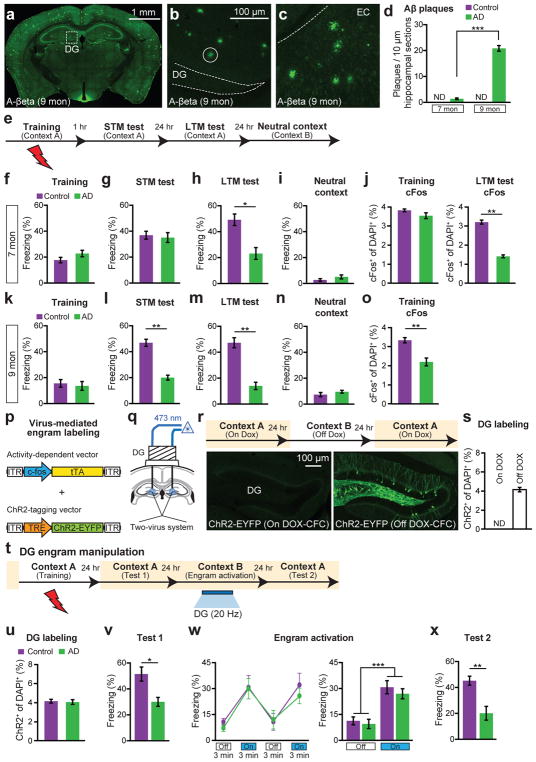
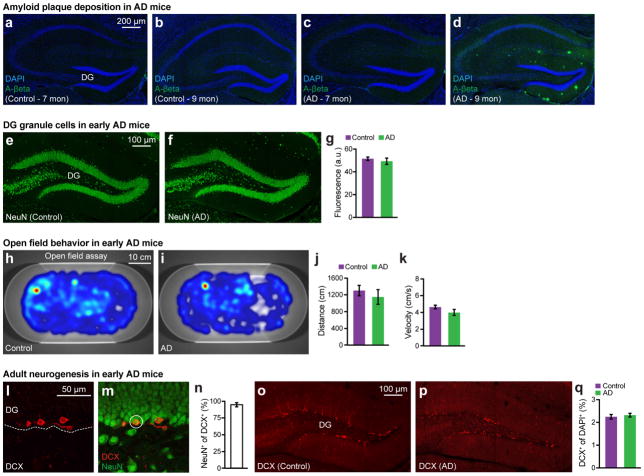
A mouse model of AD (hereafter referred to as “AD mice”)10 overexpresses the delta exon 9 variant of presinilin-1 (PS1), in combination with the Swedish mutation of amyloid precursor protein (APP). Consistent with previous reports3–5, 9-month old AD mice showed severe plaque deposition across multiple brains regions (Fig. 1a), specifically in the DG (Fig. 1b) and medial entorhinal cortex (EC) (Fig. 1c); in contrast, 7-month old AD mice lacked amyloid plaques (Fig. 1d and Extended Data Fig. 1a–d). Focusing on these two age groups of AD mice, we quantified short-term (1 hr; STM) and long-term (24 hr; LTM) memory formation using contextual fear conditioning (CFC) (Fig. 1e). Nine-month old AD mice were impaired in both STM and LTM, which suggested a deficit in memory encoding (Fig. 1k–o). In contrast, 7-month old AD mice showed normal levels of training-induced freezing (Fig. 1f) and normal STM (Fig. 1g), but were impaired in LTM (Fig. 1h). Neither control nor 7-month old AD mice displayed freezing behavior in a neutral context (Fig. 1i). In the DG of 7-month old AD mice, the levels of cells which are immediate early gene cFos-positive following CFC training were normal, but were lower compared to control mice following LTM tests (Fig. 1j). The density of DG granule cells and motor behaviors were normal in these mice (Extended Data Fig. 1e–k). Thus, these behavioral- and cellular-level observations confirmed that 7-month old AD mice serve as a mouse model of early AD regarding memory impairments.
Figure 1. Optogenetic activation of memory engrams restores fear memory in early AD mice.
a–c, Aβ plaques in 9-month old AD mice (a), in DG (b), and in EC (c). d, Plaque counts in hippocampal sections (n = 4 mice per group). e, CFC behavioral schedule (n = 10 mice per group). f–i, Freezing levels of 7-month old AD groups during training (f), STM test (g), LTM test (h) or exposure to neutral context (i). j, cFos+ cell counts in the DG of 7-month old mice following CFC training or LTM test, represented in f, h (n = 4 mice per group). k–n, Freezing levels of 9-month old AD mice during training (k), STM test (l), LTM test (m) or exposure to neutral context (n). o, cFos+ cell counts in the DG of 9-month old mice (n = 3 mice per group) following CFC training represented in k. p, Virus-mediated engram labeling strategy using a cocktail of AAV9-c-fos-tTA and AAV9-TRE-ChR2-EYFP. q, AD mice were injected with the two-viruses bilaterally and implanted with an optic fiber bilaterally into the DG. r, Behavioral schedule and DG-engram cell labeling (see Methods). s, ChR2-EYFP+ cell counts from DG sections shown in r (n = 3 mice per group). ND, not detected. t, Behavioral schedule for optogenetic activation of DG engram cells. u, ChR2-EYFP+ cell counts from 7-month old mice (n = 5 mice per group). v, Memory recall in Context A 1 day after training (Test 1, n = 9 mice per group). w, Freezing by blue light stimulation (left). Average freezing for two light-off and light-on epochs (right). x, Memory recall in Context A 3 days after training (Test 2). Statistical comparisons are performed using unpaired t tests; *P < 0.05, **P < 0.01, ***P < 0.001. Data are presented as mean ± SEM.
Recently, molecular, genetic and optogenetic methods to identify neurons that hold traces, or engrams, of specific memories have been established11–12. Using this technology, several groups have demonstrated that DG neurons activated during CFC learning are both sufficient11–14 and necessary15 for subsequent memory retrieval. In addition, our recent study found that engram cells under protein synthesis inhibitor-induced amnesia were capable of driving acute memory recall if they are directly activated optogenetically14. In the present study, we have applied this memory engram cell identification and manipulation technology to 7-month old AD mice to determine whether memories could be retrieved in early stages of the disease. Because it is known that the EC/HPC network is among the earliest to show altered synaptic/dendritic properties and these alterations have been suggested as underlying the memory deficits in early AD16–17, we focused on labeling the DG component of CFC memory engram cells of 7-month old AD mice using a double adeno-associated virus system (Fig. 1p–q and see Methods). While on a doxycycline (DOX) diet, DG neurons completely lacked ChR2-EYFP labeling, one day off DOX was sufficient to permit robust ChR2-EYFP expression in control mice (Fig. 1r–s and Extended Data Fig. 2a–c), as well as in 7-month old AD mice (Fig. 1t–u).
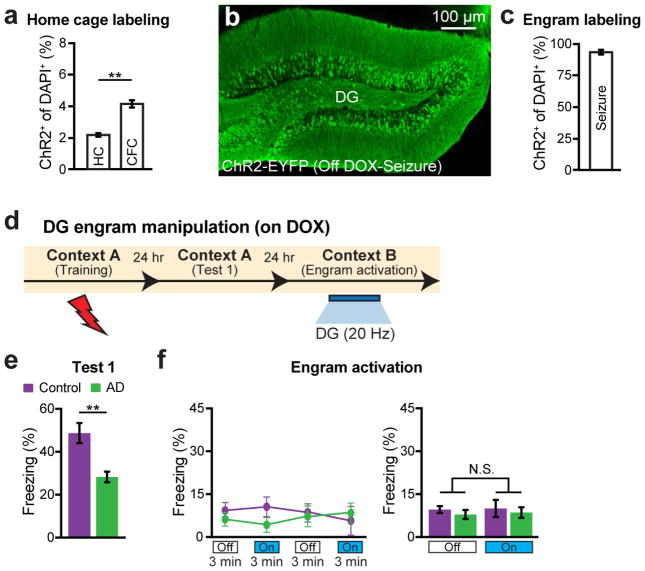
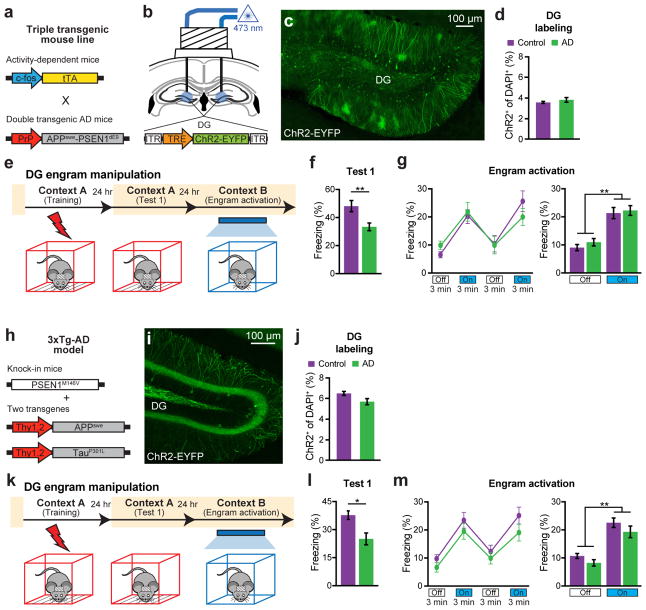
As expected, these engram-labeled early AD mice were amnesic a day after CFC training (Fig. 1v). But, remarkably, these mice froze on the next day in a distinct context (Context B) as robustly as equivalently treated control mice in response to blue light stimulation of the engram cells (Fig. 1w). This light-specific freezing was not observed using on DOX mice (Extended Data Fig. 2d–f). A natural recall test conducted on the third day in the conditioning context (Context A) revealed that the observed optogenetic engram reactivation did not restore memory recall by natural cues in early AD mice (Fig. 1x). This was the case even after multiple rounds of light activation of the engram cells (Extended Data Fig. 3). We replicated the successful optogenetic rescue of memory recall in two other models of early AD: a triple transgenic line obtained by mating c-fos-tTA mice with double transgenic APP/PS1 mice (Extended Data Fig. 4a–g) and a widely used triple transgenic AD model18 (PS1/APP/tau, Extended Data Fig. 4h–m). These data show that DG engram cells in 7-month old mouse models of early AD are sufficient to induce memory recall upon optogenetic reactivation, which indicates a deficit of memory retrievability during early AD-related memory loss.
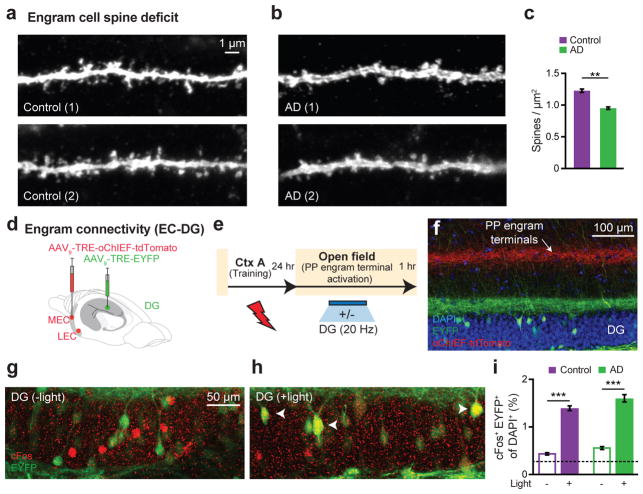
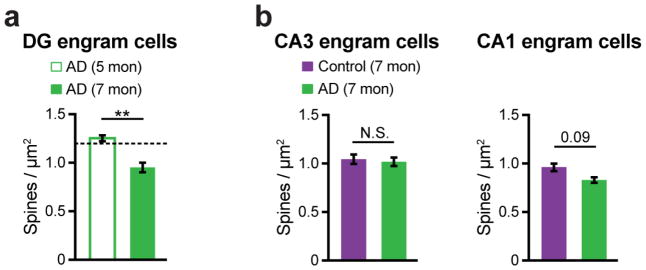
Reduced dendritic spines have been implicated in memory impairments of AD3. In addition, our recent study of protein synthesis inhibitor-induced amnesia found reduced engram-cell specific dendritic spine density14. We detected an age-dependent (Extended Data Fig. 5a) decrease in dendritic spine density of DG engram cells in early AD mice (Fig. 2a–c), showing that long-term memory impairments of early AD correlate with dendritic spine deficits of DG engram cells (Extended Data Fig. 5b). The inability to generate newborn neurons in the DG could play a role in the development of AD-specific cognitive deficits19. However, early AD mice showed similar levels of neurogenesis in DG compared to control mice, which were quantified using doublecortin staining (DCX, Extended Data Fig. 1l–q). We recently proposed that the persistent cellular connectivity between multiple engram cell ensembles is a fundamental mechanism of memory information retention14. We labeled putative CFC memory engram cells in both medial EC (MEC) and lateral EC (LEC) with oChIEF20 (a variant of ChR2) and simultaneously labeled CFC memory engram cells in the DG with EYFP (Fig. 2d). With this procedure, perforant path terminals are also labeled with oChIEF (Fig. 2e–f). One day after footshocks, we optogenetically activated these terminals and quantified the overlap between putative DG engram cells (i.e. EYFP+, green) and DG cells in which the endogenous cFos (red) had been activated by the optogenetic activation of oChIEF+ perforant paths. Both control and early AD mice showed above-chance and indistinguishable levels of cFos+/EYFP+ overlap, indicating the preferential functional connectivity between engram cells is maintained in the early AD mice (Fig. 2g–i).
Figure 2. Neural correlates of amnesia in early AD mice.
a–b, Images showing dendritic spines from DG engram cells of control (a) and AD (b) groups. c, Average spine density showing a decrease in AD mice (n = 7032 spines) compared to controls (n = 9437 spines, n = 4 mice per group). d, For engram connectivity, MEC/LEC and DG cells were injected with virus cocktails. e, Engram connectivity behavioral schedule. Mice (n = 4 per group) were either given a natural exploration session (Light −) or a PP engram terminal stimulation session (Light +) in an open field. f, Image showing simultaneous labeling of engram terminals (red) and engram cells (green). Green terminals reflect mossy cell axons. g–h, Images showing cFos+/EYFP+ overlap in the DG. i, cFos+/EYFP+ counts from control and AD mice. Chance overlap (0.24) calculated (see Methods) and indicated by the dashed line. Statistical comparisons are performed using unpaired t tests; **P < 0.01, ***P < 0.001. Data are presented as mean ± SEM.
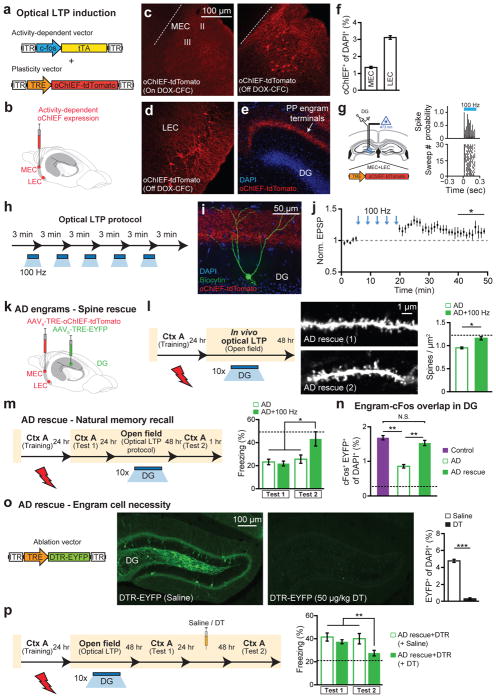
We then hypothesized that the reversal of dendritic spine deficits in DG engram cells of early AD mice may rescue long-term memory. To investigate this possibility, we took advantage of previous findings that spine formation can be induced rapidly by long-term potentiation (LTP)21–22 and that LTP can be induced in vivo using light activation of oChIEF23. We validated learning-dependent labeling, with oChIEF, of neurons in MEC (Fig. 3a–c and Extended Data Fig. 6a–c) and LEC (Fig. 3d) as well as perforant path (PP) terminals in the DG (Fig. 3e–f). In vivo extracellular recording upon light stimulation of oChIEF+ EC axonal terminals in DG showed a reliable spiking response of DG cells in anesthetized control mice (Fig. 3g). Further, in HPC slices from control mice we successfully induced LTP in DG cells using a previously established optical LTP protocol23 (Fig. 3h–j). These biocytin-filled DG cells revealed an increase in spine density following in vitro optical LTP (Extended Data Fig. 6d).
Figure 3. Reversal of engram-specific spine deficits rescues memory in early AD mice.
a, Engram-specific optical LTP using two viruses. b, Virus cocktail injected into MEC/LEC. c–e, Images showing oChIEF labeling 24 hours after CFC: in MEC on DOX (left) and off DOX (right; c); in LEC off DOX (d); in DG off DOX (sagittal; e). Scale bar shown in c, applies to d and e. f, oChIEF+ cell counts (n = 3 mice per group). g, In vivo spiking of DG neurons in response to 100 Hz light applied to PP terminals. h, Optical LTP protocol23. i–j, In vitro responses of DG cells after optical LTP. Image showing biocytin-filled DG cell receiving oChIEF+ PP terminals (coronal; i). Excitatory post-synaptic potentials (EPSPs) showing a 10% increase in amplitude (n = 6 cells; j). k, For in vivo optical LTP at EC-DG synapses, MEC/LEC and DG cells were injected with virus cocktails. l, Protocol for in vivo spine restoration of DG engram cells in AD mice (left). Images showing dendritic spines of DG engram cells following LTP (middle). A two-way ANOVA followed by Bonferroni post-hoc tests revealed a spine density restoration in AD+100 Hz mice (F1,211 = 7.21, P < 0.01, 13025 spines, n = 4 mice per group; right). Dashed line represents control mice spine density (1.21). m, Behavioral schedule for memory rescue in AD mice (left). A two-way ANOVA with repeated measures followed by Bonferroni post-hoc tests revealed restored freezing in AD+100 Hz mice (F1,36 = 4.95, P < 0.05, n = 10 mice per group; right). Dashed line represents control mice freezing (48.53). n, Following rescue, mice were perfused for cFos+/EYFP+ overlap cell counts. Chance estimated at 0.22. N.S., not significant. o, Construct for ablation of engram cells using DTR (left). Images showing DG engram cells after saline/DT administration (middle). DTR-EYFP cell counts (n = 5 mice per group; right). p, Behavioral schedule testing the necessity of engram cells following spine restoration (left). Memory recall showed less freezing of AD mice treated with DT (AD rescue + DTR + DT) compared to saline treated mice (n = 9 mice per group; right). Dashed line represents freezing of non-stimulated early AD mice (20.48). Unless specified, statistical comparisons are performed using unpaired t tests; *P < 0.05, **P < 0.01, ***P < 0.001. Data are presented as mean ± SEM.
In early AD mice, in vivo application of the engram-specific optical LTP protocol restored spine density of DG engram cells to control levels (AD+100 Hz, Fig. 3k–l). Furthermore, this spine restoration in early AD mice correlated with amelioration of long-term memory impairments observed during recall by natural cues (Fig. 3m), an effect which persisted for at least 6 days after training (AD rescue+DTR+saline group, Fig. 3p). The LTP-induced spine restoration and behavioral deficit rescue were protein-synthesis dependent (Extended Data Fig. 7). The rescued memory was context-specific (Extended Data Fig. 8a). In addition, long-term memory recall of age-matched control mice was unaffected by this optical LTP protocol (Extended Data Fig. 8b). In contrast, applying the optical LTP protocol to a large portion of excitatory PP terminals in the DG (i.e., with no restriction to the PP terminals derived from EC engram cells) did not result in long-term memory in early AD mice (Extended Data Fig. 9). To confirm the correlation between restoration of spine density of DG engram cells and amelioration of long-term memory impairments, which were both induced by the optical LTP protocol, we compared the overlap of natural recall cue-induced cFos+ cells and CFC training-labeled DG engram cells after an application of the engram-specific LTP protocol to early AD mice (Fig. 3n). Early AD mice that did not receive the optical LTP protocol showed low levels of cFos+/EYFP+ overlap compared to control mice upon natural recall cue delivery. In contrast, early AD mice that went through the optical LTP protocol showed cFos+/EYFP+ overlap similar to that of control mice (Fig. 3n). Thus, these data suggest that spine density restoration in DG engram cells contributes to the rescue of long-term memory in early AD mice.
Because of the highly redundant connectivity between EC and DG24, it is possible that the extensive optical LTP protocol also augmented spine density in some non-engram DG cells. To establish a link between the spine rescue in DG engram cells and the behavioral rescue of early AD mice, we developed an engram-specific ablation25 virus. We confirmed that this diphtheria toxin receptor (DTR)-mediated method efficiently ablated DG engram cells following diphtheria toxin (DT) administration (Fig. 3o), while leaving the nearby DG mossy cells intact (Extended Data Fig. 10). By simultaneously labeling axonal terminals of PP with oChIEF and DG engram cells with DTR, we examined the effect of DG engram cell ablation following optical LTP-induced behavioral rescue (Fig. 3p). Within-animal comparisons (Test 1 vs. Test 2) showed a decrease in freezing behavior of LTP-rescued AD mice in which DG engram cells were ablated. These data strengthen the link between DG engram cells with restored spine density and the long-term behavioral rescue in early AD mice.
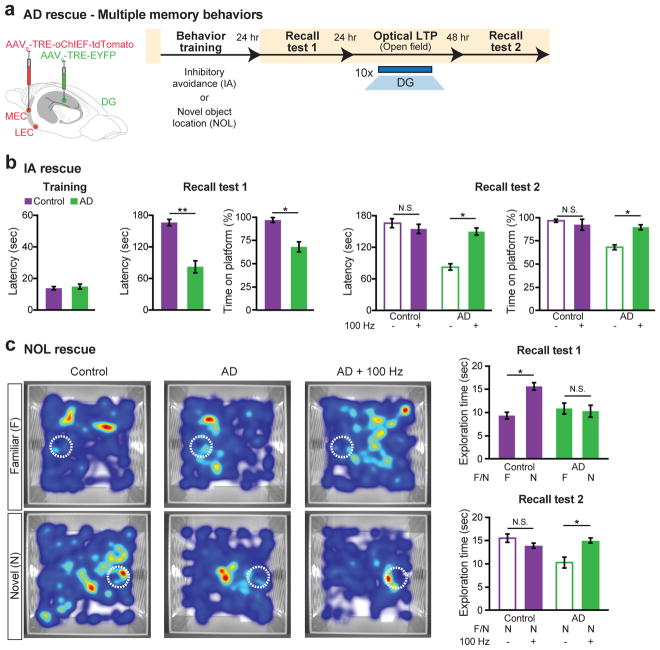
To examine if the optical LTP-induced behavioral rescue could be applied to DG engram cells from other learning experiences, we labeled memory engrams for inhibitory avoidance or novel object location in early AD mice (Fig. 4a). Early AD mice showed memory impairments in inhibitory avoidance (IA) memory and novel object location (NOL) spatial memory (Fig. 4b–c). Optical LTP-induced spine rescue at the PP-DG engram synapses was sufficient to reverse long-term memory impairments of early AD mice in both behavioral paradigms, thus demonstrating the versatility of our engram-based intervention.
Figure 4. Recovery of multiple types of hippocampal-dependent memories from amnesia in early AD.
a, MEC/LEC and DG cells were injected with virus cocktails (left). Behavioral schedule for engram labeling (right). b, IA long-term rescue (n = 10 mice per group). Recall test 1 showed decreased latency and time on platform for AD mice. A two-way ANOVA with repeated measures followed by Bonferroni post-hoc tests revealed a recovery of IA memory in early AD mice (Latency: F1,27 = 25.22, P < 0.001; Time on platform: F1,27 = 6.46, P < 0.05; Recall test 2). c, NOL long-term rescue (n = 15 mice per group). Average heat maps showing exploration time for familiar or novel locations (left or right, respectively). White circles represent object location. Recall test 1 showed comparable exploration of familiar locations by control and AD mice, however AD mice showed decreased exploration of novel locations. A two-way ANOVA with repeated measures followed by Bonferroni post-hoc tests revealed a recovery of NOL memory in early AD mice (F1,56 = 5.87, P < 0.05; Recall test 2). Unless specified, statistical comparisons are performed using unpaired t tests; *P < 0.05, **P < 0.01. Data are presented as mean ± SEM.
Prior studies that examined early stages of AD found correlations between memory impairments and synaptic pathology at the EC PP input into the DG3–4,6. It has been proposed that these early cognitive deficits are a failure of memory encoding based on behavioral observations in human patients8–9. Here, however, we have shown that optogenetic activation of hippocampal cells active during learning elicits memory recall in mouse models of early AD. To our knowledge, this is the first rigorous demonstration that memory failure in early AD models reflects an impairment in the retrieval of information. Further support for a memory retrieval impairment in early AD comes from the fact that impairments are in long-term memory (at least one day long), but not in short-term memory (~1 hr after training), which is consistent with a retrieval deficit. The retrieval deficit in early AD models is similar to memory deficits observed in amnesia induced by impairing memory consolidation via protein synthesis inhibitors14. The underlying mechanism of memory failure in early AD patients may not necessarily parallel the molecular and circuit impairments observed in mouse models of early AD. For instance, some early AD patients can exhibit amyloid plaque deposition years before the onset of cognitive decline9. However, converging data on the underlying mechanism for genetically- and pharmacologically-induced amnesia in animal models increase the possibility that similar memory retrieval-based failures may also operate in an early stage of AD patients. While we have shown that amnesia in early AD mice is a deficit of memory retrieval, it remains possible that the long-term maintenance of memory storage may also gradually become compromised as the disease proceeds from the early stage to more advanced stages, and eventually lost with neuronal degeneration. Further research will investigate these possibilities.
Our conclusions apply to episodic memory, which involves processing by hippocampal and other medial temporal lobe (MTL) structures. In the literature9, it is widely recognized that early AD patients exhibit non-episodic memory deficits as well, which would involve brain structures other than the MTL. Additional work is required to examine mechanisms underlying cognitive impairments in these other types of memories. Nevertheless, our findings already contribute to a better understanding of memory retrieval deficits in several cases of early AD, and may apply to other pathological conditions, such as Huntington’s disease8 in which patients show difficulty in memory recall.
Consistent with several studies highlighting the importance of dendritic spines3,6,14,26 in relation to memory processing, we observed an engram-cell specific decrease in spine density that correlated with memory deficits in early AD. Natural rescue of memory recall in early AD mice required the DG engram cells in which synaptic density deficits have been restored by an application of in vivo optical LTP protocols to the EC cells activated by specific learning. In contrast, the application of optical LTP protocols to a much wider array of excitatory EC cells projecting to the DG, which may be analogous to deep brain stimulation (DBS), did not rescue memory in AD mice. A potential explanation for this observation is that DG granule cells (GCs) may contribute to a variety of memories through their partially overlapping engram cell ensembles in a competitive manner, and that activation of a large number of these ensembles simultaneously may interfere with a selective activation of an individual ensemble. Thus, activation of a more targeted engram cell ensemble may be a key requirement for effective retrieval of the specific memory, which is difficult to achieve with the current DBS strategy.
Genetic manipulations of specific neuronal populations can have profound effects on cognitive impairments of AD27. We propose that strategies applied to engram circuits can support long-lasting improvements in cognitive functions, which may provide insights and therapeutic value for future approaches that rescue memory in AD patients.
Methods
Subjects
The APP/PS110 double transgenic AD mice, originally described as Line 85, were obtained from Jackson Laboratory (stock number 004462). Under the control of mouse prion promoter elements, these mice express a chimeric mouse/human APP transgene containing Swedish mutations (K595N/M596L) as well as a mutant human PS1 transgene (delta exon 9 variant). To label memory engram cells in APP/PS1 mice, we generated a triple transgenic mouse line by mating c-fos-tTA11,28 transgenic mice with APP/PS1 double transgenic mice. The PS1/APP/tau18 triple transgenic AD mice were obtained from Jackson Laboratory (stock number 004807). These 3xTg-AD mice express a mutant human PS1 transgene (M146V), a human APP transgene containing Swedish mutations (KM670/671NL) and a human tau transgene harboring the P301L mutation. All mouse lines were maintained as hemizygotes. Mice had access to food and water ad libitum and were socially housed in numbers of two to five littermates until surgery. Following surgery, mice were singly housed. For behavioral experiments, all mice were male and 7–9 months old. For optogenetic experiments, mice had been raised on food containing 40 mg kg−1 DOX for at least one week before surgery, and remained on DOX for the remainder of the experiments except for the target engram labeling days. For in vitro electrophysiology experiments, mice were 24–28 days old at the time of surgery. All experiments were conducted in accordance with U.S. National Institutes of Health (NIH) guidelines and the Massachusetts Institute of Technology Department of Comparative Medicine and Committee of Animal Care.
Viral constructs
Our previously established method11 for labeling memory engram cells combined c-fos-tTA transgenic mice with a doxycycline (DOX)-sensitive adeno-associated virus (AAV). However, in this study, we modified the method using a double-virus system to label memory engram cells in the early AD mice, which already carry two transgenes. The pAAV-c-fos-tTA plasmid was constructed by cloning a 1 kb fragment from the c-fos gene (550 bp upstream of c-fos exon I through 35 bp into exon II) into an AAV backbone using the KpnI restriction site at the 5′ terminus and the SpeI restriction site at the 3′ terminus. The AAV backbone contained the tTA-Advanced29 sequence at the SpeI restriction site. The pAAV-TRE-ChR2-EYFP and pAAV-TRE-EYFP constructs were previously described11–12. The pAAV-TRE-oChIEF-tdTomato20 plasmid was constructed by replacing the ChR2-EYFP fragment from the pAAV-TRE-ChR2-EYFP plasmid using NheI and MfeI restriction sites. The pAAV-CaMKII-oChIEF-tdTomato plasmid was constructed by replacing the TRE fragment from the pAAV-TRE-oChIEF-tdTomato plasmid using BamHI and EcoRI restriction sites. The pAAV-TRE-DTR-EYFP25 plasmid was constructed by replacing the ChR2 fragment from the pAAV-TRE-ChR2-EYFP plasmid using EcoRI and AgeI restriction sites. AAV vectors were serotyped with AAV9 coat proteins and packaged at the University of Massachusetts Medical School Gene Therapy Center and Vector Core. Viral titers were 1.5 × 10¹³ genome copy (GC) ml−1 for AAV9-c-fos-tTA, AAV9-TRE-ChR2-EYFP and AAV9-TRE-EYFP, 1 × 10¹³ GC ml−1 for AAV9-TRE-oChIEF-tdTomato, 4 × 10¹³ GC ml−1 for AAV9-CaMKII-oChIEF-tdTomato and 2 × 10¹³ GC ml−1 for AAV9-TRE-DTR-EYFP.
Surgery and optic fiber implants
Mice were anesthetized with isoflurane or 500 mg kg−1 avertin for stereotaxic injections14. Injections were targeted bilaterally to the DG (−2.0 mm AP, +/− 1.3 mm ML, −1.9 mm DV), MEC (−4.7 mm AP, +/− 3.35 mm ML, −3.3 mm DV) and LEC (−3.4 mm AP, +/− 4.3 mm ML, −4.0 mm DV). Injection volumes were 300 nl for DG and 400 nl for MEC and LEC. Viruses were injected at 70 nl min−1 using a glass micropipette attached to a 10 ml Hamilton microsyringe. The needle was lowered to the target site and remained for 5 min before beginning the injection. After the injection, the needle stayed for 10 min before it was withdrawn. A custom DG implant containing two optic fibers (200 mm core diameter; Doric Lenses) was lowered above the injection site (−2.0 mm AP, +/− 1.3 mm ML, −1.7 mm DV). The implant was secured to the skull with two jewelry screws, adhesive cement (C&B Metabond) and dental cement. An opaque cap derived from the top part of an Eppendorf tube protected the implant. Mice were given 1.5 mg kg−1 metacam as analgesic and allowed to recover for 2 weeks before behavioral experiments. All injection sites were verified histologically. As criteria, we only included mice with virus expression limited to the targeted regions.
Systemic injection of kainic acid
For seizure experiments11, mice were taken off DOX for 1 day and injected intraperitoneally with 15 mg kg−1 kainic acid (KA). Mice were returned to DOX food 6 hours after KA treatment and perfused the next day for immunohistochemistry procedures.
Immunohistochemistry
Mice were dispatched using 750–1000 mg kg−1 avertin and perfused transcardially with PBS, followed by 4% paraformaldehyde (PFA). Brains were extracted and incubated in 4% PFA at room temperature overnight. Brains were transferred to PBS and 50 μm coronal slices were prepared using a vibratome. For immunostaining14, each slice was placed in PBS + 0.2% Triton X-100 (PBS-T), with 5% normal goat serum for 1 hr and then incubated with primary antibody at 4°C for 24 hr. Slices then underwent three wash steps for 10 min each in PBS-T, followed by 1 hr incubation with secondary antibody. After three more wash steps of 10 min each in PBS-T, slices were mounted on microscope slides. All analyses were performed blind to the experimental conditions. Antibodies used for staining were as follows: to stain for ChR2-EYFP, DTR-EYFP or EYFP alone, slices were incubated with primary chicken anti-GFP (1:1000, Life Technologies) and visualized using anti-chicken Alexa-488 (1:200). For plaques, slices were stained using primary mouse anti-β-amyloid (1:1000, Sigma-Aldrich) and secondary anti-mouse Alexa-488 (1:500). cFos was stained with rabbit anti-cFos (1:500, Calbiochem) and anti-rabbit Alexa-568 (1:300). Adult newborn neurons were stained with guinea pig anti-DCX (1:1000, Millipore) and anti-guinea pig Alexa-555 (1:500). Neuronal nuclei were stained with mouse anti-NeuN (1:200, Millipore) and Alexa-488 (1:200). DG mossy cell axons were stained with mouse anti-CR (1:1000, Swant) and Alexa-555 (1:300).
Cell counting
To characterize the expression pattern of ChR2-EYFP, DTR-EYFP, EYFP alone and oChIEF-tdTomato in control and AD mice, the number of EYFP+/tdTomato+ neurons were counted from 4–5 coronal slices per mouse (n = 3–5 mice per group). Coronal slices centered on coordinates covered by optic fiber implants were taken for DG quantification and sagittal slices centered on injection coordinates were taken for MEC and LEC. Fluorescence images were acquired using a Zeiss AxioImager.Z1/ApoTome microscope (20X). Automated cell counting analysis was performed using ImageJ software. The cell body layers of DG granule cells (upper blade), MEC or LEC cells were outlined as a region of interest (ROI) according to the DAPI signal in each slice. The number of EYFP+/tdTomato+ cells per section was calculated by applying a threshold above background fluorescence. Data were analyzed using Microsoft Excel with the Statplus plug-in. A similar approach was applied for quantifying Aβ plaques, cFos+ neurons and adult newborn (DCX+) neurons. Total engram cell reactivation calculated as ((cFos+ EYFP+)/(Total DAPI+)) × 100. Chance overlap calculated as ((cFos+/Total DAPI+) × (EYFP+/Total DAPI+)) × 100. Percentage of adult newborn neurons expressing neuronal markers was calculated as ((NeuN+ DCX+)/(Total DCX+) × 100. DAPI+ counts were approximated from 5 coronal/sagittal slices using ImageJ. All counting experiments were conducted blind to experimental group. Researcher 1 trained the animals, prepared slices and randomized images, while Researcher 2 performed semi-automated cell counting. Statistical comparisons were performed using unpaired t tests: *P < 0.05, **P < 0.01, ***P < 0.001.
Spine density analysis
Engram cells were labeled using c-fos-tTA-driven synthesis of ChR2-EYFP or EYFP alone. The EYFP signal was amplified using immunohistochemistry procedures after which fluorescence z-stacks were taken by confocal microscopy (Zeiss LSM700) using a 40X objective. Maximum intensity projections were generated using ZEN Black software (Zeiss). Four mice per experimental group were analyzed for dendritic spines. For each mouse, 30–40 dendritic fragments of 10 μm length were quantified (n = 120–160 fragments per group). To measure spine density of DG engram cells with a focus on entorhinal cortical inputs, distal dendritic fragments in the middle-to-outer molecular layer (ML) were selected. For CA3 and CA1 engram cells, apical and basal dendritic fragments were selected. To compute spine density, the number of spines counted on each fragment was normalized by the cylindrical approximation of the surface of the specific fragment. Experiments were conducted blind to experimental group. Researcher 1 imaged dendritic fragments and randomized images, while Researcher 2 performed manual spine counting.
In vitro recordings
Following isoflurane anesthesia, brains were quickly removed and used to prepare sagittal slices (300 μm) in an oxygenated cutting solution at 4°C with a vibratome14. Slices were incubated at room temperature in oxygenated ACSF until the recordings. The cutting solution contained (in mM): 3 KCl, 0.5 CaCl2, 10 MgCl2, 25 NaHCO3, 1.2 NaH2PO4, 10 D-glucose, 230 sucrose, saturated with 95%O2-5%CO2 (pH 7.3, osmolarity of 340 mOsm). The ACSF contained (in mM): 124 NaCl, 3 KCl, 2 CaCl2, 1.3 MgSO4, 25 NaHCO3, 1.2 NaH2PO4, 10 D-glucose, saturated with 95%O2-5% CO2 (pH 7.3, 300 mOsm). Individual slices were transferred to a submerged experimental chamber and perfused with oxygenated ACSF warmed at 35°C (+/− 0.5°C) at a rate of 3 ml min−1 during recordings. Current or voltage clamp recordings were performed under an IR-DIC microscope (Olympus) with a 40X water immersion objective (0.8 NA), equipped with four automatic manipulators (Luigs & Neumann) and a CCD camera (Hamamatsu). Borosilicate glass pipettes (Sutter Instruments) were fabricated with resistances of 8–10 MΩ. The intracellular solution (in mM) for current clamp recordings was: 110 K-gluconate, 10 KCl, 10 HEPES, 4 ATP, 0.3 GTP, 10 phosphocreatine, 0.5% biocytin (pH 7.25, 290 mOsm). Recordings used two dual channel amplifiers (Molecular Devices), a 2 kHz filter, 20 kHz digitization and an ADC/DAC data acquisition unit (Instrutech) running on custom software in Igor Pro (Wavemetrics). Data acquisition was suspended whenever the resting membrane potential was depolarized above −50 mV or the access resistance (RA) exceeded 20 MΩ. Optogenetic stimulation was achieved using a 460 nm LED light source (Lumen Dynamics) driven by TTL input with a delay onset of 25 μs (subtracted offline for latency estimation). Light power on the sample was 33 mW/mm2. To test oChIEF expression, EC cells were stimulated with a single light pulse of 1 s, repeated 10 times every 5 s. DG granule cells were held at −70 mV. Optical LTP protocol: 5 min baseline (10 blue light pulses of 2 ms each, repeated every 30 s) was acquired before the onset of the LTP protocol (100 blue light pulses of 2 ms each at a frequency of 100 Hz, repeated 5 times every 3 min) and the effect on synaptic amplitude was recorded for 30 min (1 pulse of 2 ms every 30 s). Potentiation was observed in 6 out of 30 cells and results were statistically confirmed using a two-tailed paired t test. Experiments were performed in the presence of 10 μM gabazine (Tocris) and 2 μM CGP55845 (Tocris). Recorded cells were recovered for morphological identification using streptavidin CF633 (Biotium).
In vivo recordings
Multi-unit responses to optical stimulation were recorded in the DG of mice injected with a cocktail of AAV9-c-fos-tTA and AAV9-TRE-oChIEF-tdTomato viruses into MEC/LEC. Mice were anesthetized (10 ml kg−1) using a mixture of ketamine (100 mg ml−1)/xylazine (20 mg ml−1) and placed in the stereotactic system. Anesthesia was maintained by booster doses of ketamine (100 mg kg−1). An optrode consisting of a tungsten electrode (0.5 MΩ) attached to an optic fiber (200 μm core diameter), with the tip of the electrode extending beyond the tip of the fiber by 300 μm, was used for simultaneous optical stimulation and extracellular recording. The power intensity of light emitted from the optrode was calibrated to about 10 mW, consistent with the power used in behavioral assays. oChIEF+ cells were identified by delivering 20 ms light pulses (1 Hz) to the recording site every 50–100 μm. After light-responsive cells were detected, multi-unit activity in response to trains of light pulses (200 ms) at 100 Hz was recorded. Data acquisition used an Axon CNS Digidata 1440A system. MATLAB analysis was performed, as previously described12.
Behavior assays
Experiments were conducted during the light cycle (7 am to 7 pm). Mice were randomly assigned to experimental groups for specific behavioral assays immediately after surgery. Mice were habituated to investigator handling for 1–2 minutes on three consecutive days. Handling took place in the holding room where the mice were housed. Prior to each handling session, mice were transported by wheeled cart to and from the vicinity of the behavior rooms to habituate them to the journey. For natural memory recall sessions, data were quantified using FreezeFrame software. Optogenetic stimulation interfered with the motion detection, and therefore all light-induced freezing behavior was manually quantified. All behavior experiments were analyzed blind to experimental group. Unpaired student’s t-tests were used for independent group comparisons, with Welch’s correction when group variances were significantly different. Given behavioral variability, initial assays were performed using a minimum of 10 mice per group to ensure adequate power for any observed differences. Experiments that resulted in significant behavioral effects were replicated three times in the laboratory. Following behavioral protocols, brain sections were prepared to confirm efficient viral labeling in target areas. Animals lacking adequate labeling were excluded prior to behavior quantification.
Contextual fear conditioning
Two distinct contexts were employed14. Context A were 29 × 25 × 22 cm chambers with grid floors, opaque triangular ceilings, red lighting, and scented with 1% acetic acid. Four mice were run simultaneously in four identical context A chambers. Context B consisted of four 30 × 25 × 33 cm chambers with perspex floors, transparent square ceilings, bright white lighting, and scented with 0.25% benzaldehyde. All mice were conditioned in context A (two 0.60 mA shocks of 2 s duration in 5 min), and tested (3 min) in contexts A and B one day later. Experiments showed no generalization in the neutral context B. All experimental groups were counter-balanced for chamber within contexts. Floors of chambers were cleaned with quatricide before and between runs. Mice were transported to and from the experimental room in their home cages using a wheeled cart. The cart and cages remained in an anteroom to the experimental rooms during all behavioral experiments. For engram labeling, mice were kept on regular food without DOX for 24 hours prior to training. When training was complete, mice were switched back to food containing 40 mg kg−1 DOX.
Open field
Spontaneous motor activity was measured in an open field arena (52 × 26 cm) for 10 min. All mice were transferred to the testing room and acclimated for 30 min before the test session. During the testing period, lighting in the room was turned off. The apparatus was cleaned with quatricide before and between runs. Total movements (distance traveled and velocity) in the arena were quantified using an automated infrared (IR) detection system (EthoVision XT, Noldus). The tracking software plotted heat maps for each mouse, which was averaged to create representative heat maps for each genotype. Raw data was extracted and analyzed using Microsoft Excel.
Engram activation
For light-induced freezing behavior, a context distinct from the CFC training chamber (context A) was used. These were 30 × 25 × 33 cm chambers with perspex floors, square ceilings, white lighting, and scented with 0.25% benzaldehyde. Chamber ceilings were customized to hold a rotary joint (Doric Lenses) connected to two 0.32 m patch cords. All mice had patch cords fitted to the optic fiber implant prior to testing. Two mice were run simultaneously in two identical chambers. ChR2 was stimulated at 20 Hz (15 ms pulse width) using a 473 nm laser (10–15 mW), for the designated epochs. Testing sessions were 12 min in duration, consisting of four 3 min epochs, with the first and third as light-off epochs, and the second and fourth as light-on epochs. At the end of 12 min, the mouse was detached and returned to its home cage. Floors of chambers were cleaned with quatricide before and between runs.
In vivo optical LTP
One day after CFC training and engram labeling (DG+PP terminals) in control and early AD groups, mice were placed in an open field arena (52 × 26 cm) after patch cords were fitted to the fiber implants. Following a 15 min acclimatization period, mice with oChIEF+ PP engram terminals in the DG received the optical LTP23 protocol (100 blue light pulses of 2 ms each at a frequency of 100 Hz, repeated 5 times every 3 min). This in vivo protocol was repeated 10 times over a 3 hour duration. After induction, mice remained in the arena for an additional 15 min before returning to their home cage. To apply optical LTP to a large portion of excitatory MEC neurons, an AAV virus expressing oChIEF-tdTomato under the CaMKII promoter, rather than a c-fos-tTA/TRE virus (i.e., engram labeling), was used. For protein synthesis inhibition experiments, immediately after the in vivo LTP induction protocol mice received 75 mg kg−1 anisomycin (Aniso) or an equivalent volume of saline (Saline) intra-peritoneally. Mice were then returned to their home cages. An hour later, a second injection of Aniso or Saline was delivered.
Inhibitory avoidance
A 30 × 28 × 34 cm unscented chamber with transparent square ceilings and intermediate lighting was used. The chamber consisted of two sections, one with grid flooring and the other with a white light platform. During the conditioning session (1 min), mice were placed on the light platform, which is the less preferred section of the chamber (relative to the grid section). Once mice entered the grid section of the chamber (all four feet), 0.80 mA shocks of 2 s duration were delivered. On average, each mouse received 2–3 shocks per training session. After 1 min, mice were returned to their home cage. The next day, latency to enter the grid section of the chamber as well as total time on the light platform was measured (3 min test).
Novel object location
Spatial memory was measured in a white plastic chamber (28 × 28 cm) that had patterns (series of parallel lines or circles) on opposite walls. The apparatus was unscented and intermediate lighting was used. All mice were transferred to the behavioral room and acclimated for 30 min before the training session. On day 1, mice were allowed to explore the chamber with patterns for 15 min. On days 2 and 3, mice were introduced into the chamber that had an object (7 cm tall glass flask filled with metal beads) placed adjacent to either patterned wall. The position of the object was counter-balanced within each genotype. On day 4, mice were placed into the chamber with the object either in the same position as the previous exposure (familiar) or at a novel location based on wall patterning. Frequency of visits to the familiar and novel object locations was quantified using an automated detection system (EthoVision XT, Noldus). Total time exploring the object was also measured (nose within 1.5 cm of object). The tracking software plotted heat maps based on exploration time, which was averaged to create representative heat maps for each genotype. Raw data was extracted and analyzed using Microsoft Excel.
Extended Data
Extended Data Figure 1. Characterization of 7-month old early AD mice.
a–d, Images showing hippocampal Aβ+ plaques lacking in control mice (a, b) and 7-month old AD mice (c), which showed an age-dependent increase in 9-month old AD mice (d). e–f, Images showing neuronal nuclei (NeuN) staining of DG granule cells in control (e) and 7-month old AD (f) mice. g, NeuN+ fluorescence intensity of the granule cell layer from control and AD sections shown in e–f (n = 8 mice per group). h–i, Heat maps showing exploratory behavior in an open field arena from control (h) and 7-month old AD (i) mice. j–k, Distance traveled (j) and velocity (k) did not differ between control and AD groups (n = 9 mice per group). l–m, Images showing adult newborn neurons (DCX+) in DG sections from control mice (l) that are double positive for NeuN (m). n, Percentage of NeuN+ cells among DCX+ cells (n = 3 mice). o–p, Images showing DCX+ neurons in DG sections from control (o) and AD (p) groups (n = 4 mice per group). q, DCX+ cell counts from control and AD mice. Data are presented as mean ± SEM.
Extended Data Figure 2. Labeling and engram activation of early AD mice on DOX.
a, Mice are taken off DOX for 24 hours in the home cage (HC) and subsequently trained in CFC. DG sections (n = 3 mice per group) revealed 2.05% ChR2-EYFP labeling in the HC, consistent with the previously established engram tagging strategy11. b, Mice were injected with a virus cocktail of AAV9-c-fos-tTA and AAV9-TRE-ChR2-EYFP. After one day off DOX, kainic acid was used to induce seizures. Image showing efficient labeling throughout the DG. c, ChR2-EYFP cell counts from DG sections shown in b (n = 3 mice). d, Behavioral schedule for optogenetic activation of DG engram cells. e, Memory recall 1 day after training (Test 1) showed less freezing of AD mice compared to control mice (n = 8 mice per group). f, Engram activation with blue light stimulation (left). Average freezing for the two light-off and light-on epochs (right). Statistical comparisons are performed using unpaired t tests; **P < 0.01. Data are presented as mean ± SEM.
Extended Data Figure 3. Chronic DG engram activation in early AD mice did not rescue long-term memory.
a, Behavioral schedule for repeated DG engram activation experiment. b, AD mice in which a DG memory engram was reactivated twice a day for two days (AD+ChR2) showed increased STM freezing levels compared to memory recall prior to engram reactivation (ChR2-STM test, n = 9 mice per group). c, Memory recall 1 day after repeated DG engram activations (ChR2-LTM test). N.S., not significant. Statistical comparisons are performed using unpaired t tests; *P < 0.05, **P < 0.01. Data are presented as mean ± SEM.
Extended Data Figure 4. Engram activation restores fear memory in triple transgenic and PS1/APP/tau models of early AD.
a, Triple transgenic mouse line obtained by mating c-fos-tTA transgenic mice11,28 with double transgenic APP/PS1 AD mice10. These mice combined with a DOX-sensitive AAV virus permits memory engram labeling in early AD. b, Triple transgenic mice were injected with AAV9-TRE-ChR2-EYFP and implanted with an optic fiber targeting the DG. c, Image showing DG engram cells of triple transgenic mice 24 hours after CFC. d, ChR2-EYFP cell counts from control and triple transgenic AD mice (n = 5 mice per group). e, Behavioral schedule for engram activation. f, Memory recall 1 day after training (Test 1) showed less freezing of triple transgenic AD mice compared to control mice (n = 10 mice per group). g, Engram activation with blue light stimulation (left). Average freezing for the two light-off and light-on epochs (right). h, Triple transgenic AD model (3xTg-AD) as previously reported18. A cocktail of AAV9-c-fos-tTA and AAV9-TRE-ChR2-EYFP viruses were used to label memory engrams in 3xTg-AD mice. i, Image showing memory engram cells in the DG of 3xTg-AD mice 24 hours after CFC. j, ChR2-EYFP cell counts from DG sections of control and 3xTg-AD mice (n = 4 mice per group). k, Behavioral schedule for engram activation. l, Memory recall 1 day after training (Test 1) showed less freezing of 3xTg-AD mice compared to control mice (n = 9 mice per group). m, Engram activation with blue light stimulation (left). Average freezing for the two light-off and light-on epochs (right). Statistical comparisons are performed using unpaired t tests; *P < 0.05, **P < 0.01. Data are presented as mean ± SEM.
Extended Data Figure 5. Dendritic spines of engram cells in 7-month old early AD mice.
a, Average dendritic spine density of DG engram cells showed an age-dependent decrease in 7-month old APP/PS1 AD mice (n = 7032 spines) as compared to 5-month old AD mice (n = 4577 spines, n = 4 mice per group). Dashed line represents spine density of control mice (1.21). b, (Left) Average dendritic spine density of CA3 engram cells in control (n = 5123 spines) and AD mice (n = 6019 spines, n = 3 mice per group). (Right) Average dendritic spine density of CA1 engram cells in control (n = 9120 spines) and AD mice (n = 7988 spines, n = 5 mice per group). N.S., not significant. Statistical comparisons are performed using unpaired t tests; **P < 0.01. Data are presented as mean ± SEM.
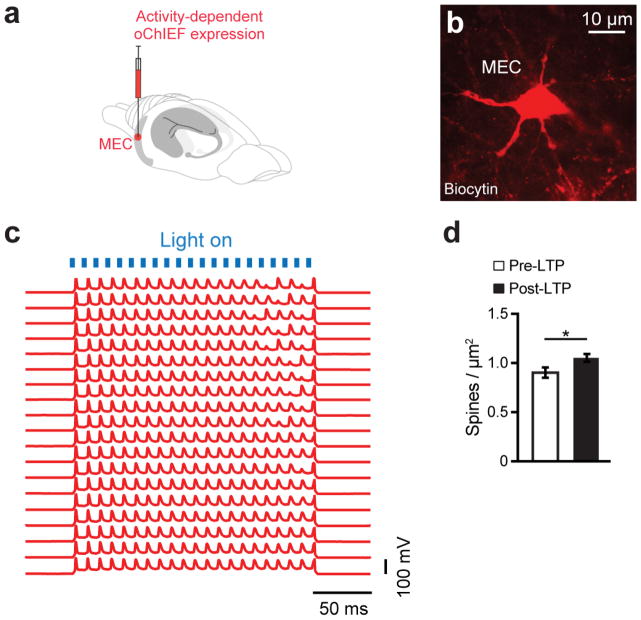
Extended Data Figure 6. High fidelity responses of oChIEF+ cells and dendritic spines of DG engram cells after in vitro optical LTP.
a, Entorhinal cortex (EC) cells were injected with a virus cocktail containing AAV9-TRE-oChIEF-tdTomato for activity-dependent labeling. b, Image showing a biocytin-filled oChIEF+ stellate cell in EC. c, 100 Hz (2 ms pulse width) stimulation of an oChIEF+ cell across 20 consecutive trials. Spiking responses exhibit high fidelity. d, Average dendritic spine density of biocytin-filled DG cells showed an increase following optical LTP induction in vitro (n = 1452 spines, n = 6 cells). Statistical comparisons are performed using unpaired t tests; *P < 0.05. Data are presented as mean ± SEM.
Extended Data Figure 7. Behavioral rescue and spine restoration by optical LTP is protein-synthesis dependent.
a, Modified behavioral schedule for long-term rescue of memory recall in AD mice in the presence of saline or anisomycin (left). Memory recall 2 days after LTP induction followed by drug administration showed less freezing of AD mice treated with anisomycin (AD + 100 Hz + Aniso) compared to saline treated AD mice (AD + 100 Hz + Saline, n = 9 mice per group; right). Dashed line represents freezing level of control mice (48.53). b, Average dendritic spine density in early AD mice treated with anisomycin after LTP induction (n = 4810 spines) was decreased compared to saline treated AD mice (n = 6242 spines, n = 4 mice per group). Dashed line represents spine density of control mice (1.21). Statistical comparisons are performed using unpaired t tests; *P < 0.05. Data are presented as mean ± SEM.
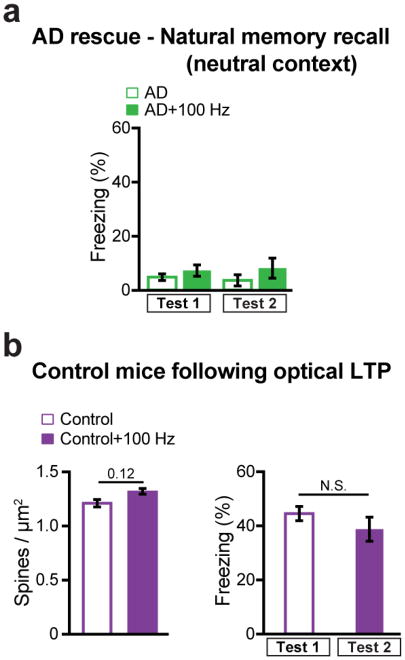
Extended Data Figure 8. Rescued early AD mice behavior in a neutral context and control mice following in vivo optical LTP.
a, After the long-term rescue of memory recall in AD mice (Test 2, Fig. 3m), animals were placed in an untrained neutral context to measure generalization (n = 10 mice per group). Rescued AD mice (AD+100 Hz) did not display freezing behavior. b, (Left) Average dendritic spine density of DG engram cells from control mice remained unchanged following optical LTP induction in vivo (Control + 100 Hz, n = 4211 spines, n = 3 mice; Control data from Figure 2c). (Right) The behavioral rescue protocol applied to early AD mice (Fig. 3m) was tested in age-matched control mice (n = 9 mice per group). Similar freezing levels were observed following optical LTP (Test 2) as compared to memory recall prior to the 100 Hz protocol (Test 1). N.S., not significant. Statistical comparisons are performed using unpaired t tests. Data are presented as mean ± SEM.
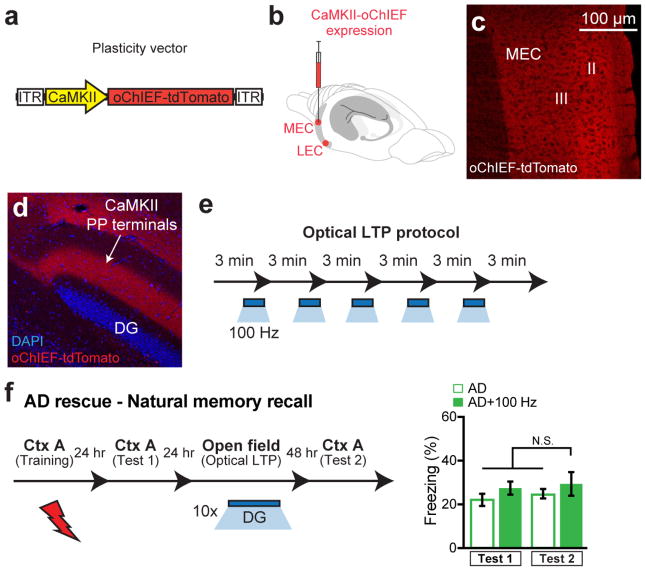
Extended Data Figure 9. Optical LTP using a CaMKII-oChIEF virus did not rescue memory in early AD mice.
a, AAV virus expressing oChIEF-tdTomato under a CaMKII promoter. b, CaMKII-oChIEF virus injected into MEC and LEC. c–d, Images showing tdTomato labeling in a large portion of excitatory MEC neurons (c) as well as the PP terminals in DG (d). e, In vivo optical LTP protocol23. f, Behavioral schedule for long-term rescue of memory recall in AD mice (left). In contrast to the engram-specific strategy, long-term memory could not be rescued by stimulating a large portion of excitatory PP terminals in the DG (right; n = 9 mice per group). N.S. not significant. Statistical comparisons are performed using unpaired t tests. Data are presented as mean ± SEM.
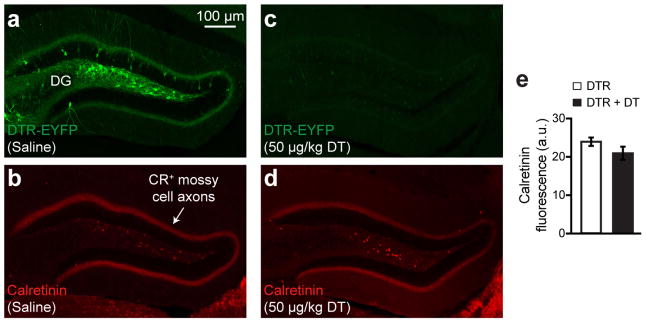
Extended Data Figure 10. Normal DG mossy cell density after engram cell ablation.
a–d, Images showing DG engram cells after saline treatment (a) and the corresponding calretinin positive (CR+) mossy cell axons (b). DTR-EYFP engram cell labeling after DT treatment (c) and the respective CR+ mossy cell axons (d). e, CR+ fluorescence intensity of mossy cell axons from saline and DT treated DG sections shown in a–d (n = 8 mice per group). Data are presented as mean ± SEM.
Acknowledgments
We thank X. Liu for the c-fos-tTA construct; S. Huang, T. Okuyama, and T. Kitamura for help with experiments; W. Yu, S. LeBlanc, and X. Zhou for technical assistance; L. Brenner for proofreading; and all members of the Tonegawa laboratory for their support. We thank Minmin Luo for sharing the DTR coding sequence. This work was supported by the RIKEN Brain Science Institute, the Howard Hughes Medical Institute and the JPB Foundation (to S.T.).
Footnotes
Author Contributions D.R. and S.T. contributed to the study design. D.R., A.A., T.M., M.P., and T.R. contributed to the data collection and interpretation. D.R. cloned all constructs. D.R. and A.A. conducted the surgeries, behavior experiments, and histological analyses. D.R. and S.T. wrote the paper. All authors discussed and commented on the manuscript.
The authors declare no competing financial interests.
Readers are welcome to comment on the online version of this article at www.nature.com/nature.
References
- 1.Selkoe DJ. Alzheimer’s disease: genes, proteins, and therapy. Physiol Rev. 2001;81:741–766. doi: 10.1152/physrev.2001.81.2.741. [DOI] [PubMed] [Google Scholar]
- 2.Selkoe DJ. Alzheimer’s disease is a synaptic failure. Science. 2002;298:789–791. doi: 10.1126/science.1074069. [DOI] [PubMed] [Google Scholar]
- 3.Jacobsen JS, et al. Early-onset behavioral and synaptic deficits in a mouse model of Alzheimer’s disease. Proc Natl Acad Sci USA. 2006;103:5161–5166. doi: 10.1073/pnas.0600948103. [DOI] [PMC free article] [PubMed] [Google Scholar]
- 4.Hsia AY, et al. Plaque-independent disruption of neural circuits in Alzheimer’s disease mouse models. Proc Natl Acad Sci USA. 1999;96:3228–3233. doi: 10.1073/pnas.96.6.3228. [DOI] [PMC free article] [PubMed] [Google Scholar]
- 5.Mucke L, et al. High-level neuronal expression of Aβ1-42 in wild-type human amyloid protein precursor transgenic mice: synaptotoxicity without plaque formation. J Neurosci. 2000;20:4050–4058. doi: 10.1523/JNEUROSCI.20-11-04050.2000. [DOI] [PMC free article] [PubMed] [Google Scholar]
- 6.Terry RD, et al. Physical basis of cognitive alterations in Alzheimer’s disease: synapse loss is the major correlate of cognitive impairment. Ann Neurol. 1991;30:572–580. doi: 10.1002/ana.410300410. [DOI] [PubMed] [Google Scholar]
- 7.Granholm E, Butters N. Associative encoding and retrieval in Alzheimer’s and Huntington’s disease. Brain Cognition. 1988;7:335–347. doi: 10.1016/0278-2626(88)90007-3. [DOI] [PubMed] [Google Scholar]
- 8.Hodges JR, Salmon DP, Butters N. Differential impairment of semantic and episodic memory in Alzheimer’s and Huntington’s diseases: a controlled prospective study. J Neurol Neurosurg Psychiatry. 1990;53:1089–1095. doi: 10.1136/jnnp.53.12.1089. [DOI] [PMC free article] [PubMed] [Google Scholar]
- 9.Weintraub S, Wicklund AH, Salmon DP. The neuropsychological profile of Alzheimer disease. Cold Spring Harb Perspect Med. 2012;2:a006171. doi: 10.1101/cshperspect.a006171. [DOI] [PMC free article] [PubMed] [Google Scholar]
- 10.Jankowsky JL, et al. Mutant presenilins specifically elevate the levels of the 42 residue β-amyloid peptide in vivo: evidence for augmentation of a 42-residue γ secretase. Hum Mol Genet. 2004;13:159–170. doi: 10.1093/hmg/ddh019. [DOI] [PubMed] [Google Scholar]
- 11.Liu XL, et al. Optogenetic stimulation of a hippocampal engram activates fear memory recall. Nature. 2012;484:381–385. doi: 10.1038/nature11028. [DOI] [PMC free article] [PubMed] [Google Scholar]
- 12.Ramirez S, et al. Creating a false memory in the hippocampus. Science. 2013;341:387–391. doi: 10.1126/science.1239073. [DOI] [PubMed] [Google Scholar]
- 13.Redondo RL, et al. Bidirectional switch of the valence associated with a hippocampal contextual memory engram. Nature. 2014;513:426–430. doi: 10.1038/nature13725. [DOI] [PMC free article] [PubMed] [Google Scholar]
- 14.Ryan TJ, Roy DS, Pignatelli M, Arons A, Tonegawa S. Engram cells retain memory under retrograde amnesia. Science. 2015;348:1007–1013. doi: 10.1126/science.aaa5542. [DOI] [PMC free article] [PubMed] [Google Scholar]
- 15.Denny CA, et al. Hippocampal memory traces are differentially modulated by experience, time, and adult neurogenesis. Neuron. 2014;83:189–201. doi: 10.1016/j.neuron.2014.05.018. [DOI] [PMC free article] [PubMed] [Google Scholar]
- 16.Harris JA, et al. Transsynaptic progression of amyloid-β-induced neuronal dysfunction within the entorhinal-hippocampal network. Neuron. 2010;68:428–441. doi: 10.1016/j.neuron.2010.10.020. [DOI] [PMC free article] [PubMed] [Google Scholar]
- 17.Hyman BT, Van Hoesen GW, Kromer LJ, Damasio AR. Perforant pathway changes and the memory impairment of Alzheimer’s disease. Ann Neurol. 1986;20:472–481. doi: 10.1002/ana.410200406. [DOI] [PubMed] [Google Scholar]
- 18.Oddo S, et al. Triple-transgenic model of Alzheimer’s disease with plaques and tangles: intracellular Aβ and synaptic dysfunction. Neuron. 2003;39:409–421. doi: 10.1016/s0896-6273(03)00434-3. [DOI] [PubMed] [Google Scholar]
- 19.Rodriguez JJ, et al. Impaired adult neurogenesis in the dentate gyrus of a triple transgenic mouse model of Alzheimer’s disease. PLoS One. 2008;3:e2935. doi: 10.1371/journal.pone.0002935. [DOI] [PMC free article] [PubMed] [Google Scholar]
- 20.Lin JY, Lin MZ, Steinbach P, Tsien RY. Characterization of engineered channelrhodopsin variants with improved properties and kinetics. Biophys J. 2009;96:1803–1814. doi: 10.1016/j.bpj.2008.11.034. [DOI] [PMC free article] [PubMed] [Google Scholar]
- 21.Maletic-Savatic M, Malinow R, Svoboda K. Rapid dendritic morphogenesis in CA1 hippocampal dendrites induced by synaptic plasticity. Science. 1999;283:1923–1927. doi: 10.1126/science.283.5409.1923. [DOI] [PubMed] [Google Scholar]
- 22.Engert F, Bonhoeffer T. Dendritic spine changes associated with hippocampal long-term synaptic plasticity. Nature. 1999;399:66–70. doi: 10.1038/19978. [DOI] [PubMed] [Google Scholar]
- 23.Nabavi S, et al. Engineering a memory with LTD and LTP. Nature. 2014;511:348–352. doi: 10.1038/nature13294. [DOI] [PMC free article] [PubMed] [Google Scholar]
- 24.Tamamaki N, Nojyo Y. Projection of the entorhinal layer II neurons in the rat as revealed by intracellular pressure-injection of neurobiotin. Hippocampus. 1993;3:471–480. doi: 10.1002/hipo.450030408. [DOI] [PubMed] [Google Scholar]
- 25.Zhan C, et al. Acute and long-term suppression of feeding behavior by POMC neurons in the brainstem and hypothalamus, respectively. J Neurosci. 2013;33:3624–3632. doi: 10.1523/JNEUROSCI.2742-12.2013. [DOI] [PMC free article] [PubMed] [Google Scholar]
- 26.Tonegawa S, Liu X, Ramirez S, Redondo RL. Memory engram cells have come of age. Neuron. 2015;87:918–931. doi: 10.1016/j.neuron.2015.08.002. [DOI] [PubMed] [Google Scholar]
- 27.Cisse M, et al. Reversing EphB2 depletion rescues cognitive functions in Alzheimer model. Nature. 2011;469:47–52. doi: 10.1038/nature09635. [DOI] [PMC free article] [PubMed] [Google Scholar]
- 28.Reijmers LG, Perkins BL, Matsuo N, Mayford M. Localization of a stable neural correlate of associative memory. Science. 2007;317:1230–1233. doi: 10.1126/science.1143839. [DOI] [PubMed] [Google Scholar]
- 29.Urlinger S, et al. Exploring the sequence space for tetracycline-dependent transcriptional activators: novel mutations yield expanded range and sensitivity. Proc Natl Acad Sci USA. 2000;97:7963–7968. doi: 10.1073/pnas.130192197. [DOI] [PMC free article] [PubMed] [Google Scholar]


