

ABSTRACT
Fat4 functions as a Hippo signaling regulator which is involved in mammalian tissue development, differentiation and tumorigenesis. Loss of Fat4 due to frequent gene mutation was detected in a variety of tumors including gastric cancer, where Fat4 was recognized as a tumor suppressor, repressing cancer cell proliferation and adhesion. However, the detailed mechanisms linking Fat4 to its diverse functions and clinicopathological characteristics in gastric cancer remain unclear. Here, we silenced Fat4 using Fat4-shRNA in gastric cancer cells and found that this suppression led to the increase in phosphorylated Yap and nuclear accumulation of Yap, which associated to the promoted proliferation, migration and cell cycle progression. Then we transfected a full-length Fat4 into the Fat4-silenced cells, and found the decrease in phosphorylated Yap and inhibition of the cell cycle progression. Intriguingly, Fat4 reduction also leads to the accumulation of cytoplasmic β-catenin via the loss of restraining to cytoplasmic Yap instead of β-catenin transcription promotion. The Fat4-silenced cells which were treated with 5-FU, Cisplatin, Oxaliplatin and Paclitaxel individually demonstrated less sensitivities to these chemotherapy drugs compared with the control cells. Furthermore, immunohistochemical analysis revealed that Fat4 expression was significantly reduced in gastric cancer tissues compared with adjacent noncancerous tissues, and negatively correlated with tumor infiltration, lymph node metastasis and cumulative survival rate. In conclusion, Fat4 expression is deceased in gastric cancer cells, leading to nuclear translocation of Yap and correlates with poor prognosis.
KEYWORDS: β-catenin, Fat4, gastric cancer, hippo signaling, nuclear accumulation, yap
Abbreviations
- Yap
Yes-associated protein
- GC
gastric cancer
- shRNA
short hairpin RNA
- qRT-PCR
quantitative real-time PCR
- IHC
immunohistochemistry
- HR
hazard ratio
Introduction
Fat4 is a pivotal member of the Fat cadherin protein family, and acts as a single transmembrane protein receptor, transducing extracellular stimulation signals into cells, predominantly via Hippo signaling pathway.1 Vertebrate Fat4 is an ortholog of Drosophila fat which controls the size of organs2 and suppresses the cell proliferation3 by affecting localization and expression of Yki via the Hippo pathway, and the expression is also linked to the maintenance of planar cell polarity (PCP).4 In mammals, however, Fat4 is involved in more complicated regulatory mechanisms controlling tissue development and differentiation, as well as tumorigenesis.
Although the canonical Hippo pathway, involving the Hpo (MST1/2)-Wts (LATS1/2)-Yki (Yap) axis, is highly conserved, upstream regulators like Fat4 exhibit an evolutionary shift from arthropods to mammals.5 Therefore further studies investigating the regulatory mechanisms between Fat4 and the Hippo pathway are necessary. Fat4 plays a critical role in tissue development, for example the kidney,6 by modulating Yap and modifying Wnt9b/β-catenin thereby regulating the differentiation of progenitors and renewal program of the kidney.7 In addition, Fat4 interacts with PCP pathway proteins and disrupts oriented cell division, leading to dysfunction of multiple organs including the renal cyst, neural tube and inner ear.8 Furthermore, loss of Fat4 leads to an increase in the neural progenitors and represses differentiation of these cells via the Hippo pathway, and the phenotype can be rescued by inactivation of Yap1 and TEAD.1,9
Human Fat4 is expressed at low levels in a variety of cancers due to gene mutation, deletion or promoter hypermethylation, and is associated with tumor initiate and progression. Several studies using genome or exome sequencing have identified frequent, non-synonymous Fat4 mutations in esophageal squamous cell carcinoma (27%),10,11 hepatocellular carcinoma (1/10),12 melanoma (2/9)13 and head and neck squamous cell carcinoma (2/32).14 In colorectal cancer,15 Fat4 mutation was observed in 14.4% of studied cases and was associated with poor prognosis. Fat4 promoter hypermethylation was observed in lung cancer (7/18)16 and breast cancer.17 In gastric cancer (GC), frequent inactivating mutations (5%, 6/110 patients) and genomic deletion of Fat4 (4%, 3/83 patients) were detected, and may be in part ascribed to loss of heterozygosity (LOH). Additional functional tests suggested that Fat4 could suppress the proliferation and adhesion of GC cells.18
Mutations in Fat4 are considered as a major cause of reduced expression, and lead to the aberrant activation of Yap and its translocation into the nucleus.6,17 Intriguingly, cytoplasmic Yap was reported to suppress Wnt/β-catenin signaling via binding and preventing β-catenin nuclear translocation.19 In the contrast, however, Rosenbluh and colleagues20 found that Yap1 exists in a complex with β-catenin sustaining the survival and transformation of β-catenin dependent cancers. Therefore, Fat4 may act as a tumor suppressor that regulates gene transcription downstream of Yap and β-catenin, either directly or indirectly, via the Hippo pathway. However to date, detailed mechanisms linking aberrant Fat4 to its diverse functions in gastric cancer remain unclear.
In conclusion, the underlying mechanisms that link Fat4 to proliferation and migration of GC cells, and the correlation between Fat4 and the clinicopathological features of GC patients require further research. In the present study, we found that Fat4 silence stimulates proliferation, increases migration and promotes cell cycle progression of GC cells, which can attributes to nuclear translocation of Yap and β-catenin accumulation, whereas forced silence of either Fat4 or Yap failed to promote β-catenin transcription. Moreover, clinicopathological research confirmed that reduced Fat4 expression correlates to the increased nuclear location of Yap in GC tissues and predicts poor overall survival of GC patients.
Results
Fat4 silence stimulates the proliferation of gastric cancer cells and promotes their growth in xenografts
Analysis of Fat4 expression in cell lines revealed lower levels in gastric cancer (GC) cells compared with human gastric mucosa epithelial cells 1 (GES-1) (Fig. 1A). Previously, Zang and colleagues18 reported the expression of wild type Fat4 in HGC27 cancer cells. To gain an insight into the role of Fat4 as a tumor suppressor in GC, we silenced Fat4 expression in HGC27 and BGC823 GC cells using Fat4-shRNA or Control-shRNA for 24-72 h. We then assessed the expression levels of Yap, phosphorylated Yap (p-Yap), LATS1 and phosphorylated LATS1 (p-LATS1) by western blotting. We observed a decrease in the levels of p-Yap and p-LATS1 following inhibition of Fat4, however, total expression levels of Yap and LATS1 were unchanged (Fig. 1B). Analysis of the ratios of p-Yap/Yap and p-LATS/LATS confirmed a decrease in these phosphorylated proteins following Fat4 inhibition.(Fig. 1C).
Figure 1.
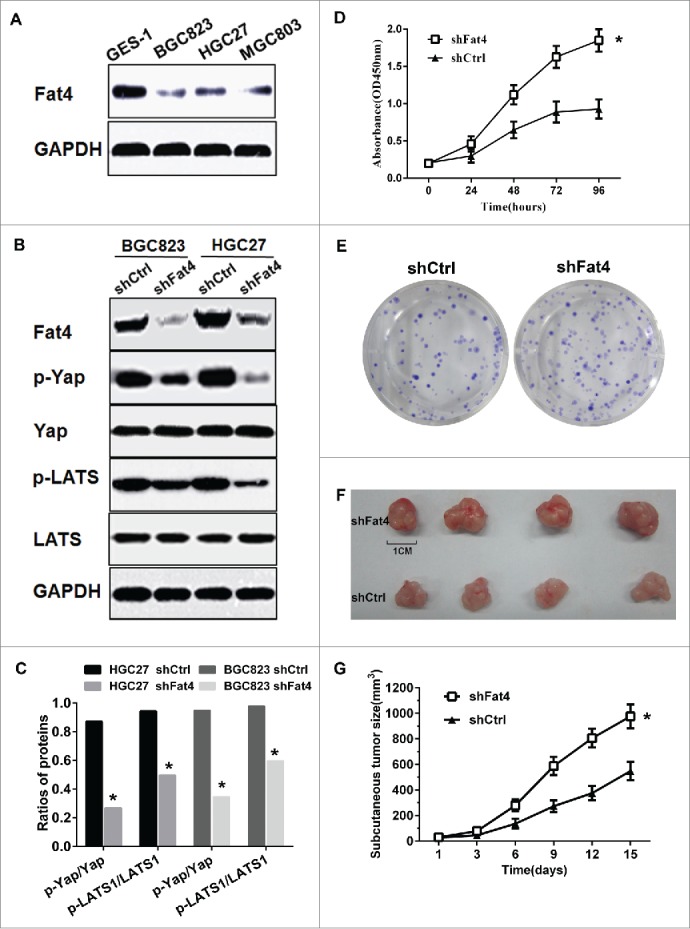
Fat4 knockdown stimulates the proliferation of gastric cancer cells in vitro and in vivo (A) Fat4 protein expression levels are lower in HGC27, BGC823 and MGC803 gastric cancer (GC) cells compared with GES-1 cells. (B) Fat4, p-Yap, p-LATS expression levels were increased in Fat4 silenced HGC27 and BGC823 GC cells, whereas total Yap and LATS levels were not changed. (C) The ratios of p-Yap/Yap and p-LATS/LATS were decreased in shFat4 GC cells compared with shCtrl cells. (shFat4 cells, Fat4-shRNA treated GC cells; shCtrl cells, Control-shRNA treated GC cells). The data are mean ± SD and calculated by the Student's t-test. *P < 0.05 was considered significant. (D) The cell viability of Fat4 silenced HGC27 GC cells was increased compared with the shCtrl cells. The data are mean ± SD and calculated by the Repeated measures ANOVA. *P < 0.05 was considered significant. (E) The clonogenic assays demonstrated an increased number of colonies for Fat4 silenced HGC27 GC cells compared with shCtrl cells (P < 0.05). The data are mean ± SD and calculated by the Student's t-test. P < 0.05 was considered significant. (F) and (G) shFat4 or shCtrl HGC27 GC cells were injected in the subcutaneous tissues of BALB/c nude mice, and shFat4 GC cells originated tumors grew bigger and faster compared with shCtrl tumors (n = 8, P < 0.05). The data are mean ± SD and calculated by the Repeated measures ANOVA. *P < 0.05 was considered significant.
To gain further insight into the role of Fat4 on HGC27 cell viability, HGC27 cells were transfected with Fat4-shRNA or Control-shRNA, and cell growth was assessed using a Cell Counting Kit-8 (CCK-8) test. We observed that transient inhibition of Fat4 led to enhanced cell viability (Fig. 1D). Next, we performed Clonogenic assays using GC cells with stable Fat4 knockdown (shFat4 cells) or stably expressing Control-shRNA (shCtrl cells). We observed that suppression of Fat4 stimulated the proliferation of GC cells.(Fig. 1E).
Based on the enhanced proliferative behaviors of shFat4 cells in vitro, we next evaluated the role of Fat4 suppression on cells in vivo. Equal numbers of shFat4 and shCtrl GC cells (0.2 ml × 1 × 106) were injected in the subcutaneous tissue of BALB/c nude mice. We then measured the volume of subcutaneous tumors after 2 weeks and observed, that tumors derived from shFat4 cells grew much larger and quicker compared with controls (n=8, P < 0.05).(Fig 1F-G).
Fat4 suppression promotes the cell cycle progression in GC cells
Because suppression of Fat4 could stimulate the proliferation of GC cells, we hypothesized that Fat4 may affects the cell cycle. To investigate the mechanism leading to enhanced proliferation in Fat4 suppressed GC cells, we used flow cytometry (FCM) to assess the cell cycle of shFat4 cells and shCtrl cells. We observed an increase in the S and G2/M phases, with a concomitant decrease in the percent of G1 phase cells (50.69% vs. 30%, P < 0.05) in Fat4 suppressed GC cells, indicating that Fat4 suppression may promote cell cycle progression (Fig. 2A-B). Immunoblot analysis confirmed that cell cycle related proteins, CyclinD1 and c-Myc, were up-regulated in association with the increased number of cells in the S/G2/M phases, following inhibition of Fat4 in GC cells.(Fig. 2C).
Figure 2.

Fat4 suppression promotes the cell cycle progression in GC cells (A) and (B) Flow cytometry assay revealed a decrease in the percent of G1 phase cells (50.69% vs. 30%, P < 0.05), with a concomitant increase in the S/G2/M phases (49.31% vs. 70%, P < 0.05) in Fat4 silenced GC cells. The data are mean ± SD and calculated by the Student's t-test. *P < 0.05 was considered significant. (C) Cell cycle promoting proteins CyclinD1 and c-Myc were elevated in Fat4-shRNA treated HGC27 and BGC823 GC cells compared with shCtrl GC cells.
Fat4 inhibition enhances the GC cell migration
Previously, Zang and colleagues18 reported that Fat4 silencing enhanced the migration of GC cells. To test this, we assessed the migration of HGC27 cells transfected with Fat4-shRNA using transwell migration assays. We observed higher absorbance of shFat4 cells compared with shCtrl cells, indicating increased migration of cells following Fat4 knockdown (1.57 vs. 0.65, P < 0.05) (Fig. 3A-B). Immunoblot analysis also revealed increased levels of MMP-7 and Cyr61, which commonly stimulate migration of cancer cells in shFat4 cells compared with shCtrl cells (Fig. 3C). In contrast, E-cadherin, which inhibits migration, was expressed at lower levels in shFat4 cells compared with shCtrl cells.(Fig. 3C).
Figure 3.

Fat4 Inhibition enhances the GC cell migration (A) and (B) Tranwell migration assay demonstrated an elevated absorbance in Fat4 silenced HGC27 GC cells compared with shCtrl GC cells. (1.57 vs. 0.65, P < 0.05). The data are mean ± SD and calculated by the Student's t-test. *P < 0.05 was considered significant. (C) Western blotting revealed that MMP-7 and Cyr61 expression levels were increased but E-cadherin were decreased in shFat4 GC cells compared with shCtrl GC cells.
Fat4 overexpression could reverse the increased p-Yap and promoted cell cycle in Fat4-silenced cells
In order to determine whether Fat4-shRNA caused the tumor-promoting phenomena, a full-length Fat4 cDNA was transfected into the shFat4 cells and shCtl cells. Fat4, Yap, p-Yap, CyclinD1 and MMP-7 were then measured using Western blottingting, and cell cycles were examined using flow cytometry too. The decreases of Fat4 and p-Yap expression and the increases of CyclinD1 and MMP-7 expression in shFat4 cells were reversed by Fat4 transfection. (Fig. 4A) But the expression of Yap in shFat4 cells was not changed by the Fat4 treatment. (Fig. 4A) Further cell cycle examination showed that the proportion of cells in S and G2/M phases were increased in shFat4 cells compared with shCtl cells, but were reversed by the Fat4 transfection.(Fig. 4B)
Figure 4.

Full-length Fat4 treatment reversed the increase of p-Yap and promotion of cell cycle in Fat4-silenced cells (A) The expression of Fat4 and p-Yap were deceased in shFat4 cells compared with shCtrl cells, which were reversed by Fat4 transfection. The expression of CyclinD1 and MMP-7 were increased in shFat4 cells compared with shCtrl cells, which were reversed by Fat4 transfection. But the expression of Yap in shFat4 cells was not changed by the transfection of Fat4. (B) The proportion of cells in S and G2/M phases were increased in shFat4 cells (a) compared with shCtl cells (b), and were reversed by the Fat4 transfection (c and d). (P < 0.05). The data are mean ± SD and calculated by the Student's t-test. *P < 0.05 was considered significant.
Fat4 repression increases the nuclear translocation of Yap and cytoplasmic accumulation of β-catenin
In the present study, silence of Fat4 was shown to stimulate cell proliferation, promotes cell cycle progression and enhances the migration of gastric cancer cells. Whereas these phenotypes may be ascribed to the aberrant ratios of p-Yap/Yap and p-LATS1/LATS1, the underlying pathways dysregulated in GC remain unclear, although Fat4 commonly regulates tissue development via the Hippo pathway.5-7 In order to further understand the mechanism by which Fat4 regulates GC cell proliferation and migration, we investigated the Hippo signaling pathway and interrelated critical elements.
Based on previous studies,6,17 we predicted that the decreased ratio of p-Yap/Yap may be due to the nuclear translocation of Yap from the cytoplasm in GC cells. We therefore extracted cytoplasmic proteins and nuclear proteins from GC cell lysates, and assessed the expression levels of Fat4, p-Yap and total Yap. We observed that cytoplasmic p-Yap levels decreased following inhibition of Fat4, whereas Yap levels remain unchanged in cytoplasm but increased in nucleus (Fig. 5A). Therefore, Fat4 suppression may drive dephosphorylation of p-Yap and translocation of Yap from the cytoplasm into the nucleus.
Figure 5.

Fat4 repression increases the nuclear accumulation of Yap and retention of cytoplasmic β-catenin (A) Cytoplasmic p-Yap expression levels were decreased, whereas nuclear Yap levels were increased and cytoplasmic Yap remained unchanged in Fat4 silenced cells compared with control cells. (B) p-Yap expression levels were decreased and followed with increased β-catenin expression in cytoplasmic fractions of Fat4-shRNA or Yap-shRNA treated HGC27 GC cells compared with control cells. (C) Relative mRNA levels of β-catenin in Fat4-shRNA or Yap-shRNA treated HGC27 GC cells were examined and revealed no change compared with control cells. The data are mean ± SD and calculated by the Student's t-test. *P < 0.05 was considered significant.
Previously, Imajo and colleagues19 suggested that Yap binds β-catenin and restraining it from nuclear translocation, whereas Rosenbluh and colleagues20 reported that Yap1-β-catenin complex promotes transcription of genes involved in survival and transformation in cancers. We therefore hypothesized that Fat4 may affect the stability of β-catenin via its regulation to Yap in gastric cancer cells. We simultaneously knocked down Yap in shFat4 and shCtrl GC cells, and then examined the β-catenin and Yap expression in the cytoplasm. We observed decreased expression of β-catenin and Yap in Fat4-shRNA and Yap-shRNA treated GC cells (Fig. 5B), whereas levels of β-catenin mRNA were not altered following inhibition of Fat4 or Yap (Fig. 5C). In conclusion, suppression of Fat4 promotes the nuclear translocation of Yap and leads to retention of β-catenin in the cytoplasm.
Fat4 silence causes less sensitivity to chemotherapy drugs in GC cells
In order to examine whether the silence of Fat4 affects the sensitivity of gastric cells to chemotherapy drugs, we treated the Fat4-silenced HGC27 cells in the medium containing chemotherapy drugs. Four chemotherapy drugs including 5-FU, Oxaliplatin, Cisplatin and Paclitaxel, which are regularly used to treat gastric cancer, were added into the culture medium at different concentration. The cell survival rates were examined using MTT approach, which revealed that the survival rate of shFat4 cells were significantly higher than the shCtl cells in all of the 4 chemotherapy drugs (P < 0.01).(Fig. 6)
Figure 6.

Fat4 silence causes less sensitivity to chemotherapy drugs in GC cells (A) Cell survival rate of shFat4 cells was higher than the shCtl cells in 5-FU contained culture medium. (B) Cell survival rate of shFat4 cells was higher than the shCtl cells in Cisplatin contained culture medium. (C) Cell survival rate of shFat4 cells was higher than the shCtl cells in Oxaliplatin contained culture medium. (D) Cell survival rate of shFat4 cells was higher than the shCtl cells in Paclitaxel contained culture medium. The data are mean ± SD and calculated by the Student's t-test. *P < 0.05 was considered significant.
Reduction of Fat4 in GC patients is correlated with increased metastasis and poor prognosis
Although previous studies11-18 demonstrate that Fat4 acts as tumor suppressor in a variety of cancers, the clinical relevance of Fat4 in GC remained unclear until now. We therefore examined the clinicopathological significance of Fat4 expression in 122 gastric cancer samples and 85 adjacent noncancerous samples based on immunohistochemistry (IHC) staining patterns. The proportion of Fat4 negative staining GC samples was significantly higher than noncancerous samples (69% vs. 33%, P = 0.0000) (Fig. 7A). The GC samples were then classified into positive or negative groups based on the Fat4 staining scores. Kaplan-Meier analysis revealed that patients with negative Fat4 staining exhibited worse cumulative survival rate compared with those with positive Fat4 staining (n = 122, P = 0.004) (Fig. 7B). Furthermore, negative staining of Fat4 was significantly correlated with lymphatic invasion, tumor infiltration and, local lymph node metastasis.(Table 1). Univariate analysis with Cox proportional hazard regression model demonstrated that Fat4 expression, tumor size, lymphatic invasion, pT category and pN category were significantly associated with cause-specific survival. Further multivariate analysis with forward and backward stepwise Cox regression, revealed that Fat4 expression was significantly correlated to cumulative survival rate of all cases, suggesting that Fat4 expression may acts as an independent predictor of overall survival rate.(Table 2).
Figure 7.
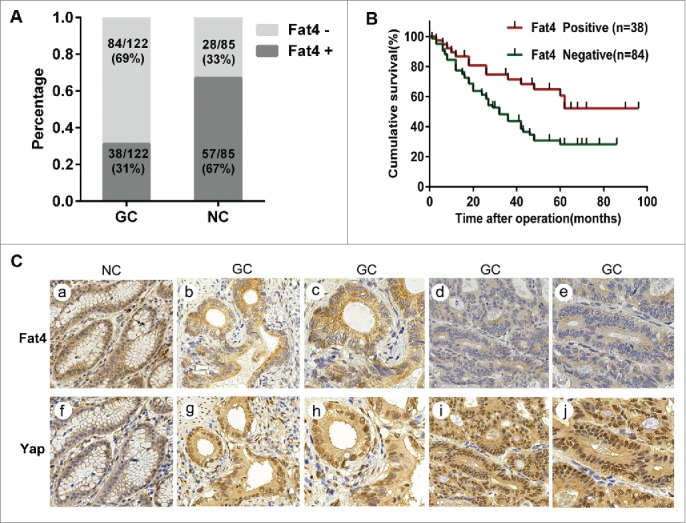
Reduction of Fat4 in GC patients correlates to the poor prognosis (A) Fat4 expression levels were analyzed using IHC staining and demonstrated that number of Fat4 negative staining is bigger in gastric cancer tissues compared withadjacent noncancerous tissues (69% vs. 33%, P < 0.05). The data are calculated by the Pearson's Chi-square test. P < 0.05 was considered significant. (B) Patients with negative Fat4 staining exhibited worse overall survival compared withthose with positive Fat4 staining (x2 = 8.436, P = 0.004). Cumulative survival curves were drawn by the Kaplan-Meier method. The significance was determined by the Log Rank test. P < 0.05 was considered significant. Fat4 and Yap expression were determined by immunohistochemical staining. Up: Fat4 staining was (a) intense positive staining in noncancerous tissue, (b and c) moderate positive staining or (d and e) weak positive staining in GC tissues. (a, b and d: ×200 magnification; c and e: ×400 magnification). Down: Yap staining (f-j) was predominantly in cytoplasm of noncancerous tissues but in nuclei in GC tissues. Yap staining in nuclei was (f) weak positive staining in noncancerous tissues, but (g and h) moderate staining or (i and j) intense positive staining in GC tissues. (f, g and i: ×200 magnification; h and j: ×400 magnification).
Table 1.
Correlation between Fat4 expression and clinicopathological features of GC patients.
| Fat4 |
|||||
|---|---|---|---|---|---|
| Clinicopathological featuresrs | na | Positive | Negative | χ2 | P-value |
| ALL | 122 | 38 | 84 | ||
| Age (years) | 0.2871 | 0.5921 | |||
| <60 | 53 | 16 | 37 | ||
| ≥60 | 69 | 24 | 45 | ||
| Gender | 2.9659 | 0.0850 | |||
| Male | 82 | 24 | 58 | ||
| Female | 30 | 14 | 16 | ||
| Tumor size (cm) | 0.2254 | 0.6350 | |||
| <4 | 35 | 12 | 23 | ||
| ≥4 | 87 | 26 | 61 | ||
| Histopathological grading | 0.6095 | 0.4350 | |||
| Differentiated | 74 | 25 | 49 | ||
| Undifferentiated | 48 | 13 | 35 | ||
| Lymphatic invasion | 8.7693 | 0.0031* | |||
| 0 | 69 | 29 | 40 | ||
| 1-3 | 53 | 9 | 44 | ||
| TNM classification | |||||
| pT categories | 8.9002 | 0.00306* | |||
| pT1 | 25 | 10 | 15 | ||
| pT2 | 38 | 17 | 21 | ||
| pT3 | 43 | 7 | 36 | ||
| pT4 | 16 | 4 | 12 | ||
| pN Categories | 7.7250 | 0.0210* | |||
| N0 | 30 | 14 | 16 | ||
| N1/2 | 58 | 19 | 39 | ||
| N3 | 34 | 5 | 29 | ||
| TNM Stage (AJCC) b | 4.0769 | 0.1302 | |||
| I | 35 | 14 | 21 | ||
| II | 66 | 21 | 45 | ||
| III | 21 | 3 | 18 | ||
| Yap nuclear location | 24.0484 | 0.0000* | |||
| Positive | 80 | 13 | 67 | ||
| Negative | 42 | 25 | 17 | ||
Numbers of cases in each group;
The AJCC Cancer Staging Manual, 7th edition; Abbreviations: T, tumor; N, lymph node; M, metastasis. * Statistically significant (P < 0.05).
Table 2.
Univariate and multivariate analyses of overall survival of GC patients.
| Variables | Univariatea | Multivariateb |
||
|---|---|---|---|---|
| Sex | P-value | HR | 95%CI | P-value |
| Male vs. female | 0.8570 | 1.372 | 0.869-2.153153 | 0.0640 |
| Age (years) | ||||
| ≥60 vs. <60 | 0.0532 | 1.593 | 0.943-2.307307 | 0.0712 |
| Tumor size (cm) | ||||
| ≥4 vs. <4 | 0.0002* | 1.426 | 0.560-4.215 | 0.3380 |
| Lymphatic invasion | ||||
| Positive vs. negative | <0.0001* | 2.241 | 1.037-6.021021 | 0.0011* |
| pT-stage | ||||
| T3-4 vs. T1-2 | <0.0001* | 5.273 | 1.352-15.880.88 | 0.0166* |
| pN-stage | ||||
| N1-3 vs. N0 | <0.0001* | 6.349 | 2.137-13.961.96 | 0.0007* |
| Fat4 expression | ||||
| Positive vs. Negative | 0.007* | 4.355 | 1.960-11.262.26 | 0.0028* |
Abbreviations: HR, hazard ratio; CI, confidence interval.
The statistical significance was determined by log-rank test.
Multivariate survival analysis was performed using Cox's proportional hazard model; * Statistically significant (*P < 0.05).
To determine whether Fat4 expression levels were associated with nuclear accumulation of Yap in GC tissues and adjacent noncancerous tissues, we examined Fat4 and Yap expression by IHC. We first observed intense positive membrane staining for Fat4 and weak positive or negative nuclear staining for Yap in adjacent noncancerous tissues (Fig. 5C, a, f). We next observed negative or weak positive staining for Fat4 on membranes, with concomitant moderate or intense positive staining for Yap in nuclei in gastric cancer tissues, and vice versa (Fig. 5C, b-d, g-j). Further analysis with Pearson's Chi-square test revealed that Fat4 expression in gastric cancer tissues negative correlated with nuclear staining for Yap (P = 0.0000, r = -0.444).(Table 1). In conclusion, the suppression of Fat4 may involves to nuclear accumulation of Yap in gastric cancer tissues, consistent with our observations in GC cells.
Discussion
Fat4 acts as a regulator of development and differentiation via the Hippo signaling pathway, which is well documented in Drosophila and mammalian tissues.1-7 However reports recognizing it as a tumor suppressor in human cancers are limited. Fat4 gene mutations and decreased expression were observed in esophageal, hepatocellular, colorectal cancer and gastric cancer,11,12,15,18 however the signaling cascades and regulatory mechanisms lying downstream of Fat4 remain unclear. In the present study, we first investigated the functional role of Fat4 by observing the effects of Fat4 silencing on proliferation and migration and evaluating expression of various components of the Hippo signaling cascade, including p-LATS1, LATS1, p-Yap and Yap. Fat4 suppression in GC cells stimulated proliferation in vitro, and was associated with decreased ratios of p-Yap/Yap and p-LATS1/LATS1.
Yap functions as the major Hippo transcriptional co-activator and is phosphorylated by the p-LATS1/2 protein kinase cascade, leading to cytoplasmic sequestration of Yap during organ development.21 However, following suppression of upstream regulators or LATS1/2 complex degradation, Yap translocates into the nucleus, inducing tumorigenesis.22,23 Previously, Nguyen and colleagues24 reported that the tumor suppressor, LKB1, promotes Yap phosphorylation and nuclear exclusion, independently of LATS1/2 activation in Hela cells. In this study, however, we found that the decreased p-Yap/Yap ratio may due to Fat4 suppression, which inactivates LATS1 phosphorylation. In order to identify the cause of this decreased p-Yap/Yap ratio, we examined p-Yap and Yap in nuclear and cytoplasmic fractions of Fat4 suppressed GC cell. Our results revealed a decrease in cytoplasmic p-Yap and an increase in total Yap levels which may be due to nuclear translocation of Yap from the cytoplasm.
Studies investigating the crosstalk between Hippo signaling and Wnt/β-catenin signaling indicate that β-catenin drives Yap gene transcription in colorectal cancer.25 Furthermore, β-catenin associates with Yap1 forming a transcriptional complex that sustains survival and transformation of β-catenin dependent cancers.20 Paradoxically, Imajo19 reported that elevated cytoplasmic p-Yap binds β-catenin directly and represses its nuclear translocation. To further understand the effects of elevated Yap on β-catenin, caused by depressed Hippo signaling, we specially silenced Fat4 and Yap expression and examined the expression of β-catenin at both transcript and protein levels. We found that suppression of Fat4 or Yap led to accumulation of cytoplasmic β-catenin, but did not affect the transcription of β-catenin. This phenomenon is consistent with the work of Azzolin and colleagues,26 who reported that cytoplasmic Yap preserves β-catenin from degradation by recruiting the β-TrCP ubiquitin ligase away from the Axin/GSK3β destruction complex in cancer cells. Taken together, repression of Fat4 acts at upstream of Hippo signaling, leading to cytoplasmic accumulation of Yap. Elevated Yap retains levels of β-catenin accounting for the activation of Wnt/β-catenin signaling target genes in GC cells.
Recently, Mizuno and colleagues27 reported that Yap induces the transcription of cell cycle promoting genes, contributing to tumor progression in malignant mesothelioma cells. Zhou et al.28 also found that Yap suppression led to G0/G1 cell cycle arrest and a decrease in CyclinD1. In this study, we identified a comparable regulatory mechanism, whereby Fat4 suppression significantly promoted G1/S phase transition and led to an increase in S and G2/M phases, accompanied by increased expression of CyclinD1 and c-Myc. Thereby, suppression of Fat4 promotes cell cycle progression by regulation of Yap location.
In addition, we assessed cell motility following suppression of Fat4 in GC cells. Consistent with previous studies,18 we found that GC cell migration was enhanced, and this is associated with the increases in MMP-7 and Cyr61 and a decrease in E-cadherin. MMP-7 and Cry61 are well characterized inducers of migration, invasion and progression in a variety of tumors, and were reported to be upregulated in the context of Yap/Taz translocation.29 Thus, dysregulation of cadherin protein and migration associated proteins downstream of Yap, caused by suppression of Fat4 further validate Fat4 as critical factor in gastric cancer progression.
Since the HGC27 cells are expressing wild type Fat4, a full-length Fat4 was transfected into the shFat4-HGC27 cells, and revealed the decreased Fat4 and p-Yap and promoted cell cycle progression could be reversed. Therefore, we believe that those promoted tumor-promoting phenotypes of shFat4 cells were caused by the suppression of Fat4 which followed by the nuclear translocation of Yap.
Increased nuclear Yap accumulation was found associated with chemotherapy resistance in colon,30 urothelial31 and hepatocellular32 carcinoma. And we found Fat4 suppression may leads to the abnormal nuclear Yap accumulation, so we tried to make sure whether Fat4 suppression affects the sensitivities of GC cells to the chemotherapy drugs. The cell survival rates measured by MTT revealed that Fat4-silenced HGC27 cells were significantly higher than the shCtl cells after they were treated in the 5-FU, Cisplatin, Oxaliplatin and Paclitaxel individually for 72 h, so Fat4 suppression may inhibits the sensitivities of GC cells to these chemotherapy drugs.
Although previous studies, including ours confirm that Fat4 suppression plays an essential role in GC tumorigenesis and progression, the clinical relevance of this finding remains unclear. Based on our immunohistochemical analysis and the clinical characteristics of GC patients in this study, we show for the first time that Fat4 expression is reduced in GC tissues, and negatively correlates with tumor infiltration, lymph node metastasis and prognosis of GC patients. In contrast, expression of Yap is elevated in GC samples compared with matched noncancerous samples as previously described.33 Furthermore, Yap is a confirmed predictor of poor prognosis in a variety of cancers34 including gastric cancer.33 Moreover, the IHC image demonstrated a significant elevated nuclear location of Yap in GC tissues compared with noncancerous tissues, consistent with previous research.35 Remarkably, we observed a decreased expression of Fat4 with concomitant increased nuclear location of Yap in gastric cancer. Therefore, the nuclear accumulation of Yap in GC tissues may be ascribed to the suppression of diverse upstream Hippo signaling including Fat4 exerting on it. Taken together, with our findings in vitro, we believe that Fat4 suppression leads to aberrant nuclear translocation of Yap and contributes to poor prognosis in gastric cancer.
In conclusion, we demonstrate that expression of Fat4 is reduced in gastric cancer in vitro and in vivo. Suppression of Fat4 leads to elevated nuclear translocation of Yap and aberrant cytoplasmic accumulation of β-catenin, promoting the proliferation, migration and cell cycle progression in GC cells. Further clinicopathological analyses indicate that Fat4 expression negatively correlates with tumor infiltration and lymph node metastasis, and acts as predictor of poor prognosis in GC patients.
Material and methods
Culture of gastric cancer cells
The human gastric cancer (GC) cell lines HGC27, BGC823 and MGC803 were purchased from the Cell Bank of Shanghai, Institutes for Biological Sciences, China. The immortalized human gastric epithelial cell line, GES-1, was obtained from the Institute of General Surgery of Chinese People's Liberation Army General Hospital. All cell lines were cultured in RPMI-1640 medium supplemented with 10% fetal bovine serum (FBS, Gibco Inc.., NY, USA) in a humidified incubator at 37 ˚C and 5% CO2.
Construction of expression vectors and cell transfection
The sequences for the Fat4, Yap and β-catenin shRNAs are as follows: Fat4: 5’-CCGGGCGCATTGTTAGATAGGGAAACTCGAGTTTCCCTATCTAACAATGCGCTTTTTG-3’; Yap1:5’-CCGGGCCACCAAGCTAGATAAAGAACTCGAGTTCTTTATCTAGCTTGGTGGCTTTTTG-3’; β-catenin: 5’-CCGGTTGTTATCAGAGGACTAAATACTCGAGTATTTAGTCCTCTGATAACAATTTTTG-3’. The control shRNA was synthesized using a scrambled sequence. The shRNAs were cloned into the pLKO.1 lentiviral vector and virus were produced in HEK293T cells using second generation packaging vectors, psPAX2 (Addgene plasmid 12260) and pMD2.G (Addgene plasmid 12259). A full-length Fat4 cDNA was synthesized by Genepharma Company (Shanghai, China), and cloned into a plasmid–pGCMV/MCS/EGFP/Neo. Transfections were performed using Lipofectamine2000 (Invitrogen Inc.., Carlsbad, CA, USA).
Gastric cancer (GC) cells were seeded in 6 well plates for 24 h prior to transfection and grown to sub-confluence (70%-90%). Cells were transfected with Fat4-shRNA or Control-shRNA (8 μg) and lipofectamine2000 (20 μl) in Opti-MEM media (Invitrogen Inc.., Carlsbad, CA, USA). The full-length Fat4 plasmid (10 μg) and lipofectamine2000 (25 μl) in Opti-MEM media were used in the transfection of shFat4 and shCtl cells. Transfection media was replaced with RPMI-1640 Medium containing 10% FBS 5 h post-transfection. The ability of shRNA to silence Fat4 expression was confirmed by protein gel blotting. Geneticin Selective Antibiotic (Gibco Inc.., NY, USA) was added to Fat4-shRNA transfected GC cells (400 μg/ml) to select a poll of cells stably expressing Fat4-shRNA. For simultaneous knockdown of Yap or β-catenin, 10 μg shRNA and 25 μl lipofectamine2000 were used. GC cells were harvested 24-72 h post-transfection for downstream analysis.
In vitro cell proliferation assays
Cell viability was measured with the Cell Counting Kit-8 (CCK-8) (Dojindo Laboratories, Kumamoto, Japan). GC cells were seeded into 96-well plates and transfected with Fat4-shRNA or Control-shRNA for 24-96 h. CCK-8 solution was added to each well and were incubated for 2 h at 37 ˚C. Absorbance was then measured at 450 nm using Multiscan spectrum spectrophotometer (Thermo Fisher Scientific Inc.., MA, USA). Cell growth was measured using Clonogenic Assay. GC cells were seeded into 6-well plates (800 cells/well) in triplicate, and transfected as above. GC cells were then incubated for 10-14 days until visible colonies were formed. Colonies were fixed with methanol and dyed with crystal violet and counted.
Tumor xenograft study
Equal numbers (0.2 ml×1×106) of HGC27 GC cells transfected with lentivirus encoding either Fat4-shRNA or scrambled Control-shRNA were injected subcutaneously into the left armpit of 4-week-old immunodeficient BALB/c nude mice (Charles River). Tumor formation was measured once every 3 days, and tumor volumes were calculated by 1/2×length × width2, for 2 weeks. All mouse experiments were performed in accordance with internationally recognized guidelines and the Helsinki Declaration.
Cell cycle
Fat4-shRNA or scrambled Control-shRNA transfected GC cells were harvested by trypsinization and fixed with 70% ethanol overnight at 4˚C. Cells were then incubated with RNaseA (R4875, Sigma-Aldrich, MO, USA) (50 μg/ml) for 30 min and subsequently stained with propidium iodide (PI). Cell cycle distribution was analyzed by flow cytometry using BD FACS Calibur (BD Biosciences, NJ, USA).
Cell migration assay
Fat4-shRNA or Control-shRNA transfected HGC27 cells were incubated for 24 h in Opti-MEM media. Transfected GC cells were transferred to the upper chamber of a Transwell plate (Corning Inc.., NY, USA) in 200 μl Opti-MEM media, and, 500 μl of RPMI-1640 medium containing 10% FBS was added to the lower chamber. Cells in upper chamber were incubated for 4 h and then removed. Cells that migrated to the bottom of the membrane were stained with crystal violet and measured at 570 nm with a Multiscan Spectrum spectrophotometer.(Thermo Fisher Scientific Inc.., MA, USA).
MTT assay
shFat4 cells and shCtl cells were seeded in 96-well plates (2×10⁴ cells/well) and incubated overnight. Chemotherapy drugs at different concentration were added to each well for 72 h. Then the cells were incubated with MTT (0.5mg/ml) for 4 h. The formazan precipitate was dissolved in 200 μl dimethylsulfoxide, and the absorbance at wavelength of 570 nm was measured on a Multiscan spectrum spectrophotometer (Thermo Fisher Scientific Inc.., MA, USA). The cell survival rate was calculated as the value of [A570 (chemotherapy drugs)/A570 (Control)] ×100%. Each group contained 5 wells.
The shFat4 and shCtl cells were cultured with the 5-FU at the concentration of 0, 0.25, 0.5, 1.0, 2.5, 5 and 10 μg/ml; with oxaliplatin at the concentration of 0, 0.5, 1.0, 2.5, 5.0 and 10 μg/ml; with cisplatin at the concentration of 0, 0.3, 1.8, 3.6, 18 and 36 μg/ml; with paclitaxel at the concentration of 0, 0.1, 0.2, 0.4, 0.8 and 1.6 μmol/L. All of the survival rates were measured at mean ± SD, and the experiments were performed in triplicate independently.
Western blotting
Cells were collected and total protein was extracted with RIPA Lysis and Extraction Buffer (#89900, Thermo Fisher Scientific Inc.., MA, USA). For subcellular fractionation, protein was extracted using NE-PER™ Nuclear and Cytoplasmic Extraction Reagents (#78833, Thermo Fisher Scientific Inc.., MA, USA). Halt™ Phosphatase Inhibitor Cocktail (#78420, Thermo Fisher Scientific Inc.., MA, USA) was added to preserve protein phosphorylation when required. Proteins were separated by electrophoresis on 6% or 12% SDS-PAGE gels, transferred to PVDF membranes overnight at 4˚C and probed with the primary antibodies against Fat4 (1:1000, ab130076, Abcam), Yap (1:1000, #12395, CST), phospho-Yap (1:1000, #13008, CST), LATS1 (1:1000, #3477, CST), phospho-LATS1 (1:1000, #8654, CST), CyclinD1 (1:1000, ab131475, Abcam), c-Myc (1:5000, ab32072, Abcam), E-cadherin (1:2000, ab133597, Abcam), MMP-7 (1:1000, ab4044, Abcam), Cyr61 (1:500, ab80112, Abcam), β-catenin(1:4000, ab6302, Abcam), Histone H3 (1:5000, ab1791, Abcam), GAPDH (1:1000, #5174, CST). Proteins were visualized using an ECL kit (Merck Millipore Corp., MA, USA) according to the manufacturer's instructions.
qRT-PCR
Total RNA was extracted from gastric cancer cells and tissues cultures with Trizol (Thermo Fisher Scientific Inc.., MA, USA) according to the manufacturer's instructions. For mRNA detection, total RNA extracted from cell lines was reverse transcribed using the PrimeScriptTM RT reagent Kit (Takara Bio Inc.., Shiga, Japan), and then Real-time PCR was performed by using SYBR Premix Ex TaqTM II (Takara Bio Inc.., Shiga, Japan) and the following primers: Fat4-Forward 5’-ATGCCCAAAAACCCCAAAGAG-3’, Fat4-Reverse 5’-CCCATAGGGAGGGATGTTGTC-3’; Yap1-Forward 5’ -GCAACTCCAACCAGCAGCAACA-3′, Yap1-Reverse 5’ -CGCAGCCTCTCCTTCTCCATCTG-3’; β-catenin-Forward 5’- ATGGGTAGGGCAAATCAGTAAGAGGT-3’, β-catenin-Reverse 5’- AAGCATCGTATCACAGCAGGTTAC-3’. All samples were normalized to GAPDH levels and the fold change between samples was calculated using the comparative CT method. qRT-PCR experiments were performed on multiple independently derived cell lines and at least 3 independent shRNA transfections.
Immunohistochemistry
122 GC tissues and 85 paired adjacent noncancerous tissues were selected from 122 GC patients who underwent curative resection at the Chinese People's Liberation Army General Hospital (Beijing, China). Tissues were fixed in formalin and embedded in paraffin, and antigen retrieval was performed at 95 ˚C for 30 min. The sections were incubated with primary antibody against Fat4 (1:100, HPA052819, Sigma-Aldrich) and Yap (1:400, #12395, CST) overnight at 4˚C. Sections were washed and then incubated with appropriate biotinylated secondary antibodies (30 min, 20 ˚C), and visualized with DAB/H2O2. The sections were counterstained with haematoxylin, and then washed and mounted with mounting medium. Antigen expression was scored based on intensity (0, no staining; 1+, weak positive staining; 2+, moderate positive staining; and 3+, intense positive staining) and proportion (0, no cells stained; 1+, <10% positive staining of cells; 2+, 10–50% positive staining of cells; and 3+, >50% positive staining of cells). The final scores of IHC images were graded using a 4-point scale, and defined as follows: 1 or 2, negative staining and 3 or 4, positive staining. IHC images were examined by 2 experienced pathologists who were blinded to clinicopathological data, and the final score was evaluated twice.
Statistical analysis
All experiments were performed at least 3 times. The results of experiments comparing 2 groups were analyzed using a 2-tailed Student's t test. Pearson's χ2 test was used to assess the various clinicopathological characteristics as a function of Fat4 expression determined by IHC. The correlation between Fat4 and Yap was determined using Spearman's correlation coefficient test. Cumulative survival rate curves were drawn using the Kaplan–Meier method. The difference between the curves was analyzed using the log-rank test. P < 0.05 were considered to indicate statistical significance. The statistical analysis was performed using SPSS19.0.(SPSS Inc.., Chicago, IL, USA).
Disclosure of potential conflicts of interest
No potential conflicts of interest were disclosed.
Acknowledgment
The work was supported by a grant from Project supported by the National High Technology Research and Development Program of China (No. 2012AA02A504), a grant from the Special Scientific Research Foundation of Health Sector from the National Health and Family Planning Commission of China (No. 201302016), a grant from PLA Medical Technology key project of scientific research in the 12 th research projects in 12 th Five-Year-Plan (No. BWS12J049), a grant from PLA medical and health research fund project (No.11BJZ17), and a grant from People's Liberation Army Medical Technology Project for Fostering Youth (13QNP185).
Reference
- 1.Van Hateren NJ, Das RM, Hautbergue GM, Borycki AG, Placzek M, Wilson SA. FatJ acts via the Hippo mediator Yap1 to restrict the size of neural progenitor cell pools. Development 2011; 138:1893-902; PMID:21521736; http://dx.doi.org/ 10.1242/dev.064204 [DOI] [PMC free article] [PubMed] [Google Scholar]
- 2.Milton CC, Zhang X, Albanese NO, Harvey KF. Differential requirement of Salvador-Warts-Hippo pathway members for organ size control in Drosophila melanogaster. Development 2010; 137:735-43; PMID:20110315; http://dx.doi.org/ 10.1242/dev.042309 [DOI] [PubMed] [Google Scholar]
- 3.Oh H, Irvine KD. In vivo regulation of Yorkie phosphorylation and localization. Development 2008; 135:1081-8; PMID:18256197; http://dx.doi.org/ 10.1242/dev.015255 [DOI] [PMC free article] [PubMed] [Google Scholar]
- 4.Thomas C, Strutt D. The roles of the cadherins Fat and Dachsous in planar polarity specification in Drosophila. Dev Dynamics 2012; 241:27-39; http://dx.doi.org/ 10.1002/dvdy.22736 [DOI] [PubMed] [Google Scholar]
- 5.Bossuyt W, Chen CL, Chen Q, Sudol M, McNeill H, Pan D, Kopp A, Halder G. An evolutionary shift in the regulation of the Hippo pathway between mice and flies. Oncogene 2014; 33:1218-28; PMID:23563179; http://dx.doi.org/ 10.1038/onc.2013.82 [DOI] [PMC free article] [PubMed] [Google Scholar]
- 6.Murphy AJ, Pierce J, de Caestecker C, Libes J, Neblett D, de Caestecker M, Perantoni AO, Tanigawa S, Anderson JR, Dome JS, et al.. Aberrant activation, nuclear localization, and phosphorylation of yes-associated protein-1 in the embryonic kidney and Wilms tumor. Pediat Blood Cancer 2014; 61:198-205; http://dx.doi.org/ 10.1002/pbc.24788 [DOI] [PMC free article] [PubMed] [Google Scholar]
- 7.Das A, Tanigawa S, Karner CM, Xin M, Lum L, Chen C, Olson EN, Perantoni AO, Carroll TJ. Stromal-epithelial crosstalk regulates kidney progenitor cell differentiation. Nat Cell Biol 2013; 15:1035-44; PMID:23974041; http://dx.doi.org/ 10.1038/ncb2828 [DOI] [PMC free article] [PubMed] [Google Scholar]
- 8.Saburi S, Hester I, Fischer E, Pontoglio M, Eremina V, Gessler M, Quaggin SE, Harrison R, Mount R, McNeill H. Loss of Fat4 disrupts PCP signaling and oriented cell division and leads to cystic kidney disease. Nat Genet 2008; 40:1010-5; PMID:18604206; http://dx.doi.org/ 10.1038/ng.179 [DOI] [PubMed] [Google Scholar]
- 9.Cappello S, Gray MJ, Badouel C, Lange S, Einsiedler M, Srour M, Chitayat D, Hamdan FF, Jenkins ZA, Morgan T, et al.. Mutations in genes encoding the cadherin receptor-ligand pair DCHS1 and FAT4 disrupt cerebral cortical development. Nat Genet 2013; 45:1300-8; PMID:24056717; http://dx.doi.org/ 10.1038/ng.2765 [DOI] [PubMed] [Google Scholar]
- 10.Gao YB, Chen ZL, Li JG, Hu XD, Shi XJ, Sun ZM, Zhang F, Zhao ZR, Li ZT, Liu ZY, et al.. Genetic landscape of esophageal squamous cell carcinoma. Nat Genet 2014; 46:1097-102; PMID:25151357; http://dx.doi.org/ 10.1038/ng.3076 [DOI] [PubMed] [Google Scholar]
- 11.Du J, Ji J, Gao Y, Xu L, Xu J, Zhu C, Gu H, Jiang J, Li H, Ma H, et al.. Nonsynonymous polymorphisms in FAT4 gene are associated with the risk of esophageal cancer in an Eastern Chinese population. Int J Cancer J Int Du Cancer 2013; 133:357-61; http://dx.doi.org/ 10.1002/ijc.28033 [DOI] [PubMed] [Google Scholar]
- 12.Li M, Zhao H, Zhang X, Wood LD, Anders RA, Choti MA, Pawlik TM, Daniel HD, Kannangai R, Offerhaus GJ, et al.. Inactivating mutations of the chromatin remodeling gene ARID2 in hepatocellular carcinoma. Nat Genet 2011; 43:828-9; PMID:21822264; http://dx.doi.org/ 10.1038/ng.903 [DOI] [PMC free article] [PubMed] [Google Scholar]
- 13.Nikolaev SI, Rimoldi D, Iseli C, Valsesia A, Robyr D, Gehrig C, Harshman K, Guipponi M, Bukach O, Zoete V, et al.. Exome sequencing identifies recurrent somatic MAP2K1 and MAP2K2 mutations in melanoma. Nat Genet 2012; 44:133-9; http://dx.doi.org/ 10.1038/ng.1026 [DOI] [PubMed] [Google Scholar]
- 14.Agrawal N, Frederick MJ, Pickering CR, Bettegowda C, Chang K, Li RJ, Fakhry C, Xie TX, Zhang J, Wang J, et al.. Exome sequencing of head and neck squamous cell carcinoma reveals inactivating mutations in NOTCH1. Science 2011; 333:1154-7; PMID:21798897; http://dx.doi.org/; http://dx.doi.org/ 10.1126/science.1206923 [DOI] [PMC free article] [PubMed] [Google Scholar]
- 15.Yu J, Wu WK, Li X, He J, Li XX, Ng SS, Yu C, Gao Z, Yang J, Li M, et al.. Novel recurrently mutated genes and a prognostic mutation signature in colorectal cancer. Gut 2015. Apr; 64(4):636-45; PMID:24951259; http://dx.doi.org/ 10.1136/gutjnl-2013-306620 [DOI] [PMC free article] [PubMed] [Google Scholar]
- 16.Rauch TA, Wang Z, Wu X, Kernstine KH, Riggs AD, Pfeifer GP. DNA methylation biomarkers for lung cancer. Tumour Biol 2012; 33:287-96; PMID:22143938; http://dx.doi.org/ 10.1007/s13277-011-0282-2 [DOI] [PubMed] [Google Scholar]
- 17.Qi C, Zhu YT, Hu L, Zhu YJ. Identification of Fat4 as a candidate tumor suppressor gene in breast cancers. Int J Cancer J Int Du Cancer 2009; 124:793-8; http://dx.doi.org/ 10.1002/ijc.23775 [DOI] [PMC free article] [PubMed] [Google Scholar]
- 18.Zang ZJ, Cutcutache I, Poon SL, Zhang SL, McPherson JR, Tao J, Rajasegaran V, Heng HL, Deng N, Gan A, et al.. Exome sequencing of gastric adenocarcinoma identifies recurrent somatic mutations in cell adhesion and chromatin remodeling genes. Nat Genet 2012; 44:570-4; PMID:22484628; http://dx.doi.org/ 10.1038/ng.2246 [DOI] [PubMed] [Google Scholar]
- 19.Imajo M, Miyatake K, Iimura A, Miyamoto A, Nishida E. A molecular mechanism that links Hippo signalling to the inhibition of Wnt/β-catenin signalling. EMBO J 2012; 31:1109-22; PMID:22234184; http://dx.doi.org/ 10.1038/emboj.2011.487 [DOI] [PMC free article] [PubMed] [Google Scholar]
- 20.Rosenbluh J, Nijhawan D, Cox AG, Li X, Neal JT, Schafer EJ, Zack TI, Wang X, Tsherniak A, Schinzel AC, et al.. Beta-Catenin-driven cancers require a YAP1 transcriptional complex for survival and tumorigenesis. Cell 2012; 151:1457-73; PMID:23245941; http://dx.doi.org/ 10.1016/j.cell.2012.11.026 [DOI] [PMC free article] [PubMed] [Google Scholar]
- 21.Dong J, Feldmann G, Huang J, Wu S, Zhang N, Comerford SA, Gayyed MF, Anders RA, Maitra A, Pan D. Elucidation of a universal size-control mechanism in Drosophila and mammals. Cell 2007; 130:1120-33; PMID:17889654; http://dx.doi.org/ 10.1016/j.cell.2007.07.019 [DOI] [PMC free article] [PubMed] [Google Scholar]
- 22.Yu FX, Zhao B, Panupinthu N, Jewell JL, Lian I, Wang LH, Zhao J, Yuan H, Tumaneng K, Li H, et al.. Regulation of the Hippo-YAP pathway by G-protein-coupled receptor signaling. Cell 2012; 150:780-91; PMID:22863277; http://dx.doi.org/ 10.1016/j.cell.2012.06.037 [DOI] [PMC free article] [PubMed] [Google Scholar]
- 23.Visser S, Yang X. Identification of LATS transcriptional targets in HeLa cells using whole human genome oligonucleotide microarray. Gene 2010; 449:22-9; PMID:19799973; http://dx.doi.org/ 10.1016/j.gene.2009.09.008 [DOI] [PubMed] [Google Scholar]
- 24.Nguyen HB, Babcock JT, Wells CD, Quilliam LA. LKB1 tumor suppressor regulates AMP kinase/mTOR-independent cell growth and proliferation via the phosphorylation of Yap. Oncogene 2013; 32:4100-9; PMID:23027127; http://dx.doi.org/ 10.1038/onc.2012.431 [DOI] [PMC free article] [PubMed] [Google Scholar]
- 25.Konsavage WM Jr., Kyler SL, Rennoll SA, Jin G, Yochum GS. Wnt/β-catenin signaling regulates Yes-associated protein (YAP) gene expression in colorectal carcinoma cells. J Biol Chem 2012; 287:11730-9; PMID:22337891; http://dx.doi.org/ 10.1074/jbc.M111.327767 [DOI] [PMC free article] [PubMed] [Google Scholar]
- 26.Azzolin L, Panciera T, Soligo S, Enzo E, Bicciato S, Dupont S, Bresolin S, Frasson C, Basso G, Guzzardo V, et al.. YAP/TAZ incorporation in the β-catenin destruction complex orchestrates the Wnt response. Cell 2014; 158:157-70; PMID:24976009; http://dx.doi.org/ 10.1016/j.cell.2014.06.013 [DOI] [PubMed] [Google Scholar]
- 27.Mizuno T, Murakami H, Fujii M, Ishiguro F, Tanaka I, Kondo Y, Akatsuka S, Toyokuni S, Yokoi K, Osada H, et al.. YAP induces malignant mesothelioma cell proliferation by upregulating transcription of cell cycle-promoting genes. Oncogene 2012; 31:5117-22; PMID:22286761; http://dx.doi.org/ 10.1038/onc.2012.5 [DOI] [PubMed] [Google Scholar]
- 28.Zhou Z, Zhu JS, Xu ZP, Zhang Q. Lentiviral vector-mediated siRNA knockdown of the YAP gene inhibits growth and induces apoptosis in the SGC7901 gastric cancer cell line. Mol Med Rep 2011; 4:1075-82; PMID:21805037 [DOI] [PubMed] [Google Scholar]
- 29.Hsu YL, Hung JY, Chou SH, Huang MS, Tsai MJ, Lin YS, Chiang SY, Ho YW, Wu CY, Kuo PL. Angiomotin decreases lung cancer progression by sequestering oncogenic YAP/TAZ and decreasing Cyr61 expression. Oncogene 2015. Jul 30; 34(31):4056-68; PMID:25381822; http://dx.doi.org/ 10.1038/onc.2014.333 [DOI] [PubMed] [Google Scholar]
- 30.Touil Y, Igoudjil W, Corvaisier M, Dessein AF, Vandomme J, Monte D, Stechly L, Skrypek N, Langlois C, Grard G, et al.. Colon cancer cells escape 5FU chemotherapy-induced cell death by entering stemness and quiescence associated with the c-Yes/YAP axis. Clin Cancer Res 2014; 20:837-46; PMID:24323901; http://dx.doi.org/ 10.1158/1078-0432.CCR-13-1854 [DOI] [PMC free article] [PubMed] [Google Scholar]
- 31.Ciamporcero E, Shen H, Ramakrishnan S, Yu Ku S, Chintala S, Shen L, Adelaiye R, Miles KM, Ullio C, Pizzimenti S, et al.. YAP activation protects urothelial cell carcinoma from treatment-induced DNA damage. Oncogene 2015. Jun 29; PMID:26119935 [DOI] [PMC free article] [PubMed] [Google Scholar]
- 32.Park HW, Guan KL. The regulation of Hippo pathway and implications for anticancer drug development. Trends Pharmacolog Sci 2013; 34:581-9; http://dx.doi.org/ 10.1016/j.tips.2013.08.006 [DOI] [PMC free article] [PubMed] [Google Scholar]
- 33.Jiao S, Wang H, Shi Z, Dong A, Zhang W, Song X, He F, Wang Y, Zhang Z, Wang W, et al.. A peptide mimicking VGLL4 function acts as a YAP antagonist therapy against gastric cancer. Cancer Cell 2014; 25:166-80; PMID:24525233; http://dx.doi.org/ 10.1016/j.ccr.2014.01.010 [DOI] [PubMed] [Google Scholar]
- 34.Lin L, Sabnis AJ, Chan E, Olivas V, Cade L, Pazarentzos E, Asthana S, Neel D, Yan JJ, Lu X, et al.. The Hippo effector YAP promotes resistance to RAF- and MEK-targeted cancer therapies. Nat Genet 2015; 47:250-6; PMID:25665005; http://dx.doi.org/ 10.1038/ng.3218 [DOI] [PMC free article] [PubMed] [Google Scholar]
- 35.Kim NG, Koh E, Chen X, Gumbiner BM. E-cadherin mediates contact inhibition of proliferation through Hippo signaling-pathway components. Proc Natl Acad Sci USA 2011; 108:11930-5; PMID:21730131; http://dx.doi.org/ 10.1073/pnas.1103345108 [DOI] [PMC free article] [PubMed] [Google Scholar]