

Abstract
Aims/Introduction
The present cohort study assessed the risk among Japanese men for developing type 2 diabetes, based on the percentage of energy intake from carbohydrates and degree of obesity.
Participants and Methods
The participants were 2,006 male factory employees, and the macronutrient intake of each patient was measured using a self‐administered diet history questionnaire. The incidence of diabetes was determined in annual blood examinations over a 10‐year period.
Results
During the study, 232 participants developed diabetes. The crude incidence rates (/1,000 person‐years) for different levels of carbohydrate intake as a percentage of calories consumed (<50.0, 50.0–57.4, 57.5–65.0, >65.0% of energy intake) were 16.5, 14.4, 12.7 and 17.6. Overall, carbohydrate intake was not associated with the risk of diabetes. However, there was significant interaction between carbohydrate intake and degree of obesity on the incidence of diabetes (P for interaction = 0.024). Higher carbohydrate intake was associated with elevated risk for diabetes among participants with a body mass index ≥25.0 kg/m2 (P for trend = 0.034). For obese participants, the multivariate‐adjusted hazard ratio for those with carbohydrate intakes >65% energy was 2.01 (95% confidence interval 1.08–3.71), which was significantly higher than that of participants with carbohydrate intakes 50.0–57.4% energy.
Conclusions
Higher carbohydrate intake was associated with higher risk of diabetes in obese participants, but not in non‐obese participants. Obese participants with carbohydrate intakes >65% energy should reduce their intakes to levels within the desirable carbohydrate energy proportion for Japanese (50–65% energy) to prevent development of type 2 diabetes.
Keywords: Cohort study, Dietary carbohydrates, Incidence
Introduction
The prevalence of type 2 diabetes is similar in Asian and Western countries, although the prevalence of obesity is lower in Asia1. The high incidence of diabetes in the comparatively lean Asian populations might be explained, at least in part, by the presence of more abdominal fat in Asians, compared with Caucasians of a similar body mass index (BMI)2, 3. In addition, non‐obese Asians with low pancreatic B‐cell function also have an elevated risk of diabetes4, 5, 6.
Dietary factors could also play a role in the high incidence of diabetes in Asian populations. The traditional Japanese diet, characterized by a high intake of rice, soy‐based foods and fish, could improve cardiovascular health. However, the trend over recent years (partially as a result of an economic transition) has been the increasing consumption of a Western‐style diet. The average energy intake from fat increased from 10.6% in 1960 to 23.6% in 1980, and 25.5% in 2011.7 Meanwhile, the average energy intake from carbohydrates decreased from 76.1% in 1960 to 61.5% in 1980 and 59.7% in 2011.7 These dietary changes might partially explain the increasing prevalence of type 2 diabetes in Japanese populations.
In previous studies carried out in Western countries, carbohydrate intake was not associated with the incidence of type 2 diabetes.8, 9, 10, 11, 12, 13 In contrast, a study of Chinese women showed that a diet consisting of a higher percentage of carbohydrates and lower percentage of fat was associated with an elevated risk of type 2 diabetes.14 An international study of associations between macro‐ and micronutrient levels and blood pressure showed that carbohydrate intake was higher in East Asian countries, including China and Japan, than in Western countries15, 16, and these differences in macronutrient intake might affect the association between carbohydrate intake and diabetes. However, although decreased average carbohydrate intake has been correlated with increased prevalence of diabetes in these East Asian countries, it is unclear how dietary carbohydrate affects the incidence of diabetes in these populations.
In the present 10‐year prospective study of Japanese men, we investigated the relationship between dietary carbohydrate intake and the risk for developing type 2 diabetes.
Materials and methods
Participants
The study participants were employees of a factory that produces zippers and aluminum sashes in Toyama Prefecture, Japan. Detailed information on the study population has been reported previously6, 17, 18, 19. The Industrial Safety and Health Law in Japan requires employers to carry out annual health examinations for all employees. A test for diabetes mellitus was carried out during annual medical examinations between 2003 and 2013. In 2003, 2,275 (89%) out of 2,543 male employees aged 35–55 years received health examinations and responded to the dietary survey. Of these potential participants, 269 (12%) were excluded: 165 because they were diabetic or had high fasting plasma glucose (≥126 mg/dL) or high glycated hemoglobin (HbA1c; National Glycohemoglobin Standardization Program [NGSP] ≥6.5%) at the time of the baseline examination, nine because their total daily calorie intakes were below 500 kcal or above 5,000 kcal, 24 because of histories of cancer, 23 because of histories of cardiovascular disease and 48 because they did not participate in consecutive follow‐up annual health examinations. Therefore, a total of 2,006 participants were enrolled in the study.
Data Collection
The annual health examination was carried out by trained staff, and included a medical history, physical examination, anthropometric measurements, and the measurement of fasting plasma glucose, HbA1c and serum lipid levels. Height was measured without shoes to the nearest 0.1 cm using a stadiometer. Weight was measured with participants wearing only light clothing and no shoes to the nearest 0.1 kg using a standard scale. BMI was calculated as weight/height2 (kg/m2). Blood pressure was measured using a mercury sphygmomanometer after the participant had rested for 5 min in a seated position.
Plasma glucose levels were measured enzymatically using an Abbott glucose UV test (Abbott Laboratories, Chicago, IL, USA). HbAlc was measured by high‐velocity liquid chromatography using a fully automated analyzer (Kyoto Daiichi Kagaku, Kyoto, Japan). Quality control of HbA1c measurements was confirmed using the standards certified by the Japanese Diabetes Society (JDS), and HbA1c values were converted into NGSP values using the formula provided by the JDS: HbA1c (NGSP) = 1.02 × HbA1c (JDS) + 0.2520. Total cholesterol and triglycerides were assessed using an enzyme assay, and high‐density lipoprotein cholesterol was measured using direct methods.
A questionnaire was used to identify voluntary health‐related behaviors, such as alcohol consumption, smoking and regular exercise habits. An additional self‐administered questionnaire was used to collect information regarding medical history of hypertension, dyslipidemia, diabetes, the use of antidiabetic medication and any family history of diabetes. High blood pressure and dyslipidemia were defined using the Japanese criteria for metabolic syndromes:21 high blood pressure was defined as a systolic blood pressure ≥130 mmHg and diastolic blood pressure ≥85 mmHg, or the use of antihypertensive medication; and dyslipidemia was defined as serum triglycerides ≥150 mg/dL, high‐density lipoprotein cholesterol <40 mg/dL or the use of medication for dyslipidemia. The questionnaire also explored whether participants sometimes worked night shifts.
Dietary Assessment
At baseline examination, dietary habits during the month preceding the health examination were assessed using a self‐administered diet history questionnaire (DHQ)22. The DHQ was developed to estimate the dietary intakes of macro‐ and micronutrients for epidemiological studies in Japan. Detailed descriptions of the methods used for calculating dietary intakes and the validity of the DHQ have been reported previously23, 24, 25. Estimates of the dietary intake of 147 food and beverage items, and their corresponding energy and nutrients were calculated using an ad hoc computer algorithm developed for the DHQ that was based on the Standard Tables of Food Composition in Japan26. Dietary fiber level was determined by assessing the intakes of 86 fiber‐containing foods listed in the DHQ. The results from previous studies of middle‐aged Japanese women showed that the relative differences between the mean intake levels obtained from the DHQ and from the 3‐day diet records were 0.7% for total energy, 3.3% for carbohydrate, −1.4% for fat and 0.5% for protein intake22.
Diagnosis of Diabetes
Fasting plasma glucose and HbA1c were measured during the annual medical examinations. Based on the definition of the American Diabetes Association27 and the JDS28, the diagnosis of diabetes was confirmed by at least one of the following observations: a fasting plasma glucose concentration of ≥126 mg/dL, HbA1c value ≥6.5% and/or treatment with insulin or an oral hypoglycemic agent.
Statistical Analysis
According to the Dietary Reference Intakes for Japanese (2015), to prevent lifestyle‐related diseases in adults, the desirable percentage of energy intake (% energy) from carbohydrates is 50–65%29. We divided the participants into four categories according to carbohydrate intake: <50, 50–57.4% (median values for the ideal range), 57.5–65.0 and >65.0% energy. Similarly, participants were divided into four groups by carbohydrate intake (g/day), adjusted for total energy intake using residual methods. To compare baseline characteristics among the groups, continuous variables were subjected to covariance analysis. The Kruskal–Wallis test was used to compare non‐parametric variables, and the χ2‐test to compare categorical variables. We calculated the incidence rates and hazard ratios (HRs) for diabetes according to the level of carbohydrate intake. The Cox proportional hazards model was used to calculate HRs. Adjustment for possible confounders was carried out sequentially as follows: age (model 1); also for a family history of diabetes (no, yes), smoking status (never smoker, ex‐smoker or current smoker), alcohol consumption as determined by the DHQ (non‐drinker, occasional drinker, consumption <20 g/day, consumption ≥20 g/day), habitual exercise (no, yes) and performance of shift work (no, yes; model 2); also for total energy intake (kcal/day) and dietary fiber intake (g/day; model 3); also for hypertension (no, yes) and dyslipidemia (no, yes) at baseline (model 4a); or BMI (model 4b); or fasting plasma glucose level (model 4c). The HRs for diabetes were calculated separately for BMI (<25, ≥25 kg/m2). Statistical analyses were carried out using the Statistical Package for the Social Sciences (IBM SPSS statistics version 22.0; IBM Corporation, New York, USA). A P‐value of <0.05 was deemed statistically significant.
Ethical Considerations
Written informed consent was not obtained from the participants. The occupational safety and health committee of the subject company, which consisted of employee representatives, approved the design of the present study. Employees were informed of the study design and of their right to refuse to participate. Hence, participants who answered the questionnaire were considered to have consented to the survey. The company ensured that individuals were not identifiable by providing linkable anonymous data to the researchers. The institutional Review Committee of Kanazawa Medical University for Ethical Issues approved the study.
Results
The mean participant age at baseline was 45.9 years, and the mean BMI was 23.4 kg/m2. The baseline characteristics of the participants according to carbohydrate intake level are shown in Table 1 (carbohydrate energy ratio) and Table 2 (carbohydrate intake adjusted for total energy intake using residual methods). A higher carbohydrate intake was associated with a significantly lower total energy intake, lower fiber intake, higher prevalence of current smokers, lower percentage of excess alcohol consumption, a higher percentage of shift workers and lower prevalence of hypertension. Among the participants, 557 (27.0%) were obese (BMI ≥25.0 kg/m2). A higher carbohydrate intake was associated with a significantly lower total energy intake, and lower percentage of excess alcohol consumption for both non‐obese and obese participants. For non‐obese participants, a higher carbohydrate intake was associated with a significantly lower fiber intake, higher prevalence of current smokers and lower prevalence of hypertension (Table S1). Similar associations were observed when carbohydrate intake was expressed as an amount of daily intake (g/day; Table S2).
Table 1.
Baseline characteristics of study participants by level of dietary carbohydrate intake (% energy) in 2,006 Japanese men
| Carbohydrate intake (% energy) | P † | ||||
|---|---|---|---|---|---|
| <50.0 | 50.0–57.4 | 57.5–65.0 | >65.0 | ||
| n | 368 | 615 | 640 | 383 | |
| Age (years) | 45.1 ± 5.9 | 46.0 ± 5.9 | 46.0 ± 6.0 | 46.2 ± 6.0 | 0.060 |
| Body mass index (kg/m2) | 23.6 ± 2.9 | 23.3 ± 2.8 | 23.3 ± 2.9 | 23.5 ± 3.1 | 0.392 |
| Fasting plasma glucose (mg/dL) | 93.8 ± 10.2 | 93.1 ± 9.5 | 92.2 ± 9.7 | 92.0 ± 9.4 | 0.022 |
| HbA1c, NGSP (%) | 5.3 ± 0.4 | 5.3 ± 0.4 | 5.3 ± 0.4 | 5.3 ± 0.3 | 0.524 |
| Total energy intake (kcal/day) | 2,365 (955–4,516) | 2,171 (873–4,897) | 1,996 (671–4,742) | 1,886 (653–4,707) | <0.001 |
| Total fiber intake (g/day) | 10.4 (2.0–40.4) | 10.9 (2.0–28.0) | 10.2 (1.7–29.9) | 9.2 (2.4–30.3) | <0.001 |
| Fat (% energy) | 27.0 (6.4–51.1) | 24.3 (8.9–36.5) | 21.3 (4.4–32.4) | 15.7 (2.3–23.3) | <0.001 |
| Protein (% energy) | 12.7 (4.4–24.3) | 12.4 (5.6–18.4) | 11.6 (5.7–16.1) | 10.2 (5.7–15.0) | <0.001 |
| Family history of diabetes (%) | 12.6 | 13.7 | 14.4 | 12.6 | 0.823 |
| Smoking status (%) | |||||
| Non‐smoker | 61.4 | 57.2 | 49.2 | 54.6 | <0.001 |
| Ex‐smoker | 17.7 | 14.1 | 14.7 | 9.9 | |
| Current smoker | 20.9 | 28.6 | 36.1 | 35.5 | |
| Alcohol consumption (%) | |||||
| Never | 6.8 | 13.8 | 26.6 | 51.4 | <0.001 |
| Occasional | 0.8 | 1.1 | 2.0 | 4.7 | |
| Drink <20 g/day | 13.9 | 33.2 | 41.1 | 31.6 | |
| Drink ≥20 g/day | 78.5 | 51.9 | 30.3 | 12.3 | |
| Regular exercise (%) | 49.7 | 55.1 | 53.0 | 48.8 | 0.179 |
| Shift worker (%) | 16.6 | 16.7 | 20.9 | 30.0 | <0.001 |
| Presence of hypertension (%) | 41.8 | 35.6 | 31.4 | 32.4 | 0.006 |
| Presence of dyslipidemia (%) | 32.1 | 28.1 | 28.0 | 30.5 | 0.457 |
Values are presented as n, mean ± standard deviation, medians (with ranges) or %. †Covariance analysis was used for continuous variables, the Kruskal–Wallis test was used to compare non‐parametric variables and the χ2‐test was used to compare categorical variables. HbA1c, glycated hemoglobin; NGSP, National Glycohemoglobin Standardization Program.
Table 2.
Baseline characteristics of 2,006 Japanese men by quartile of dietary carbohydrate intake (g/day)
| Carbohydrate intake, g/day (quartile) | P † | ||||
|---|---|---|---|---|---|
| <285.7 | 285.8–313.8 | 313.9–341.7 | ≥341.8 | ||
| n | 502 | 501 | 502 | 501 | |
| Age (years) | 45.3 ± 5.9 | 46.0 ± 6.1 | 46.0 ± 6.0 | 46.3 ± 5.9 | 0.060 |
| Body mass index (kg/m2) | 23.6 ± 2.8 | 23.3 ± 2.8 | 23.2 ± 2.8 | 23.5 ± 3.1 | 0.055 |
| Fasting plasma glucose (mg/dL) | 93.4 ± 9.9 | 93.4 ± 9.9 | 92.0 ± 9.1 | 92.2 ± 9.8 | 0.021 |
| HbA1c, NGSP (%) | 5.3 ± 0.4 | 5.3 ± 0.4 | 5.3 ± 0.4 | 5.3 ± 0.3 | 0.510 |
| Total energy intake (kcal/day) | 2,308 (873–4,553) | 1,986 (653–4,206) | 1,971 (658–3,890) | 2,188 (1,124–4,897) | <0.001 |
| Total fiber intake (g/day) | 10.5 (2.0–40.4) | 10.1 (1.7–27.9) | 9.6 (2.5–29.9) | 10.8 (2.4–30.3) | <0.001 |
| Fat (% energy) | 26.8 (6.4–51.1) | 23.6 (4.4–36.5) | 21.4 (5.4–32.4) | 17.2 (2.3–29.7) | <0.001 |
| Protein (% energy) | 12.7 (4.4–24.3) | 12.1 (5.9–18.2) | 11.6 (5.7–17.8) | 10.7 (5.7–16.1) | <0.001 |
| Family history of diabetes (%) | 12.3 | 14.9 | 13.1 | 13.7 | 0.693 |
| Smoking status (%) | |||||
| Non‐smoker | 61.2 | 56.5 | 51.4 | 50.7 | <0.001 |
| Ex‐smoker | 16.1 | 14.0 | 15.3 | 11.2 | |
| Current smoker | 22.7 | 29.5 | 33.3 | 38.1 | |
| Alcohol consumption (%) | |||||
| Never | 8.4 | 15.0 | 28.1 | 43.7 | <0.001 |
| Occasional | 0.8 | 1.6 | 2.2 | 3.6 | |
| <20 g/day | 18.1 | 36.7 | 38.0 | 34.5 | |
| ≥20 g/day | 72.7 | 46.7 | 31.7 | 18.2 | |
| Regular exercise (%) | 51.8 | 51.1 | 53.2 | 52.9 | 0.904 |
| Shift worker (%) | 16.3 | 15.0 | 19.7 | 31.3 | <0.001 |
| Presence of hypertension (%) | 39.8 | 34.7 | 33.3 | 31.3 | 0.032 |
| Presence of dyslipidemia (%) | 30.3 | 29.3 | 27.3 | 30.1 | 0.710 |
Values are presented as n, means ± standard deviations, medians (with ranges) or %. †Covariance analysis was used to compare continuous variables, the Kruskal–Wallis test to compare nonparametric variables and the χ2‐test to compare categorical variables. HbA1c, glycated hemoglobin; NGSP, National Glycohemoglobin Standardization Program.
During the 10‐year follow up (15,593 person‐years), we documented 232 cases of type 2 diabetes. Among these, 121 diagnoses were based on high fasting plasma glucose levels, 75 on elevated HbA1c, 30 on both high fasting plasma glucose and elevated HbA1c levels, and six participants were being treated with hypoglycemic medications.
The crude incidence rates (per 1,000 person‐years) across the categories of carbohydrate intake (% energy) from lowest to highest were 16.5, 14.4, 12.7 and 17.6, respectively (Table 3). Dietary carbohydrate intake was not associated with higher HRs for diabetes after adjustment for dietary factors and other lifestyle factors. The crude incidence rates across the quintiles of carbohydrate intake (g/day), from lowest to highest, were 15.2, 14.1, 12.9 and 17.3, respectively, and carbohydrate intake was not associated with the risk of diabetes (Table 3).
Table 3.
Incidence of and adjusted hazard ratios for type 2 diabetes development, by dietary carbohydrate intake, in Japanese men
| Carbohydrate intake | P for trend | ||||
|---|---|---|---|---|---|
| Carbohydrate intake (% energy) | <50.0 | 50.0–57.4 | 57.5–65.0 | >65.0 | |
| n | 368 | 615 | 640 | 383 | |
| Cases (n) | 46 | 68 | 65 | 53 | |
| Person‐years of follow up | 2781 | 4708 | 5099 | 3004 | |
| Incidence (/1,000 person‐years) | 16.5 | 14.4 | 12.7 | 17.6 | |
| Adjusted hazard ratio (95% CI) | |||||
| Model 1 | 1.20 (0.83–1.74) | 1.00 (reference) | 0.88 (0.63–1.23) | 1.20 (0.84–1.72) | 0.851 |
| Model 2 | 1.12 (0.76–1.66) | 1.00 (reference) | 0.94 (0.66–1.33) | 1.34 (0.90–1.99) | 0.569 |
| Model 3 | 1.11 (0.75–1.65) | 1.00 (reference) | 0.95 (0.67–1.35) | 1.38 (0.93–2.06) | 0.457 |
| Model 4a | 1.04 (0.70–1.54) | 1.00 (reference) | 0.97 (0.68–1.38) | 1.32 (0.88–1.97) | 0.397 |
| Model 4b | 1.08 (0.73–1.60) | 1.00 (reference) | 0.96 (0.68–1.37) | 1.43 (0.95–2.14) | 0.344 |
| Model 4c | 0.88 (0.58–1.31) | 1.00 (reference) | 0.87 (0.61–1.23) | 1.18 (0.80–1.76) | 0.383 |
| Carbohydrate intake (g/day, quartile) | <285.7 | 285.8–313.8 | 313.9–341.7 | ≥341.8 | |
| n | 502 | 501 | 502 | 501 | |
| Cases (n) | 58 | 54 | 52 | 68 | |
| Person‐years of follow up | 3819 | 3827 | 4025 | 3922 | |
| Incidence (/1,000 person‐years) | 15.2 | 14.1 | 12.9 | 17.3 | |
| Adjusted hazard ratio (95% CI) | |||||
| Model 1 | 1.12 (0.77–1.62) | 1.00 (reference) | 0.91 (0.62–1.33) | 1.21 (0.84–1.72) | 0.742 |
| Model 2 | 1.03 (0.70–1.51) | 1.00 (reference) | 0.95 (0.64–1.39) | 1.32 (0.90–1.94) | 0.272 |
| Model 3 | 1.02 (0.69–1.51) | 1.00 (reference) | 0.95 (0.64–1.40) | 1.31 (0.89–1.94) | 0.283 |
| Model 4a | 0.99 (0.67–1.47) | 1.00 (reference) | 0.96 (0.65–1.42) | 1.27 (0.86–1.88) | 0.273 |
| Model 4b | 0.99 (0.67–1.46) | 1.00 (reference) | 0.97 (0.65–1.42) | 1.32 (0.89–1.95) | 0.204 |
| Model 4c | 0.95 (0.64–1.41) | 1.00 (reference) | 0.96 (0.65–1.42) | 1.19 (0.80–1.76) | 0.331 |
Model 1, adjusted for age; Model 2, adjusted for age, a family history of diabetes, smoking (yes), alcohol consumption, regular exercise and performance of shift work; Model 3, adjusted for the variables of model 2 plus total energy intake (kcal) and total fiber intake (g/day); Model 4a–c, adjusted for the variables of model 3 plus the presence of hypertension and hyperlipidemia at baseline (model 4a), body mass index (model 4b) or fasting plasma glucose level (model 4c). CI, confidence interval.
Next, we analyzed the association between carbohydrate intake and the incidence of diabetes in subgroups based on BMI (Table 4). A significant interaction between obesity and carbohydrate intake (% energy) levels was observed on the association with risk for diabetes (P for interaction = 0.024). Carbohydrate intake was not associated with the risk for diabetes in non‐obese participants. However, higher carbohydrate intake was associated with higher risk for diabetes in obese participants (P for trend = 0.034), and the risk of diabetes was significantly higher in participants with carbohydrate intakes >65% compared with 50.0–57.4% of total energy. Compared with the non‐obese participants with carbohydrate intakes of 50.0–57.4% energy, a significantly higher risk of diabetes was observed for obese participants with carbohydrate intakes 50.0–57.4% of total energy (HR 1.86, 95% CI 1.08–3.22), those with carbohydrate intakes 57.5–65.0% of total energy (HR 2.18, 95% CI 1.34–3.55) and those with carbohydrate intakes >65.0% of total energy (HR 3.57, 95% CI 2.11–6.03; Figure 1). Carbohydrate intake (g/day) was also associated with the risk of diabetes development in obese participants (P for trend = 0.050); however, the association was somewhat weaker than that between the risk and carbohydrate intake expressed as % total energy (Table 4 and Figure 1).
Table 4.
Incidence of and adjusted hazard ratios for type 2 diabetes development, by dietary carbohydrate intake, in the obese
| Carbohydrate intake | P for trend | ||||
|---|---|---|---|---|---|
| Carbohydrate intake (% energy) | <50.0 | 50.0–57.4 | 57.5–65.0 | >65.0 | |
| Body mass index <25.0 kg/m2 | |||||
| n | 261 | 443 | 478 | 267 | |
| Cases (n) | 32 | 39 | 36 | 24 | |
| Person‐years of follow up | 1984 | 3412 | 3852 | 2151 | |
| Incidence (/1,000 person‐years) | 16.1 | 11.4 | 9.3 | 11.2 | |
| Adjusted hazard ratio (95% CI)† | |||||
| Model 2 | 1.26 (0.77–2.06) | 1.00 (reference) | 0.86 (0.54–1.36) | 1.08 (0.62–1.87) | 0.446 |
| Model 3 | 1.23 (0.75–2.02) | 1.00 (reference) | 0.87 (0.55–1.38) | 1.09 (0.63–1.90) | 0.537 |
| Body mass index ≥25.0 kg/m2 | |||||
| n | 107 | 172 | 162 | 116 | |
| Cases (n) | 14 | 29 | 29 | 29 | |
| Person‐years of follow up | 798 | 1296 | 1247 | 853 | |
| Incidence (/1,000 person‐years) | 17.5 | 22.4 | 23.3 | 34.0 | |
| Adjusted hazard ratio (95% CI)† | |||||
| Model 2 | 0.91 (0.47–1.75) | 1.00 (reference) | 1.17 (0.68–2.00) | 1.86 (1.02–3.41) | 0.046 |
| Model 3 | 0.92 (0.48–1.79) | 1.00 (reference) | 1.19 (0.69–2.04) | 2.01 (1.08–3.71) | 0.034 |
| Carbohydrate intake, g/day (quartile) | <285.7 | 285.8–313.8 | 313.9–341.7 | ≥341.8 | |
| Body mass index <25.0 kg/m2 | |||||
| n | 353 | 364 | 383 | 349 | |
| Cases (n) | 37 | 32 | 29 | 33 | |
| Person‐years of follow up | 2698 | 2823 | 3080 | 2799 | |
| Incidence (/1,000 person‐years) | 13.7 | 11.3 | 9.4 | 11.8 | |
| Adjusted hazard ratio (95% CI)† | |||||
| Model 2 | 1.08 (0.66–1.77) | 1.00 (reference) | 0.89 (0.50–1.70) | 1.16 (0.69–1.95) | 0.944 |
| Model 3 | 1.04 (0.63–1.72) | 1.00 (reference) | 0.88 (0.53–1.46) | 1.10 (0.65–1.88) | 0.988 |
| Body mass index ≥25.0 kg/m2 | |||||
| n | 149 | 137 | 119 | 152 | |
| Cases (n) | 21 | 22 | 23 | 35 | |
| Person‐years of follow up | 1121 | 1004 | 945 | 1123 | |
| Incidence (/1,000 person‐years) | 18.7 | 21.9 | 24.3 | 31.2 | |
| Adjusted hazard ratio (95% CI)† | |||||
| Model 2 | 0.92 (0.50–1.70) | 1.00 (reference) | 1.12 (0.61–2.04) | 1.64 (0.91–2.94) | 0.059 |
| Model 3 | 0.97 (0.52–1.80) | 1.00 (reference) | 1.14 (0.62–2.10) | 1.76 (0.97–3.21) | 0.050 |
†Hazard ratios were adjusted for age, a family history of diabetes, smoking (yes), alcohol consumption, regular exercise and performance of shift work (model 2); plus total energy intake (kcal/day) and total fiber intake (g/day; model 3). CI, confidence interval.
Figure 1.
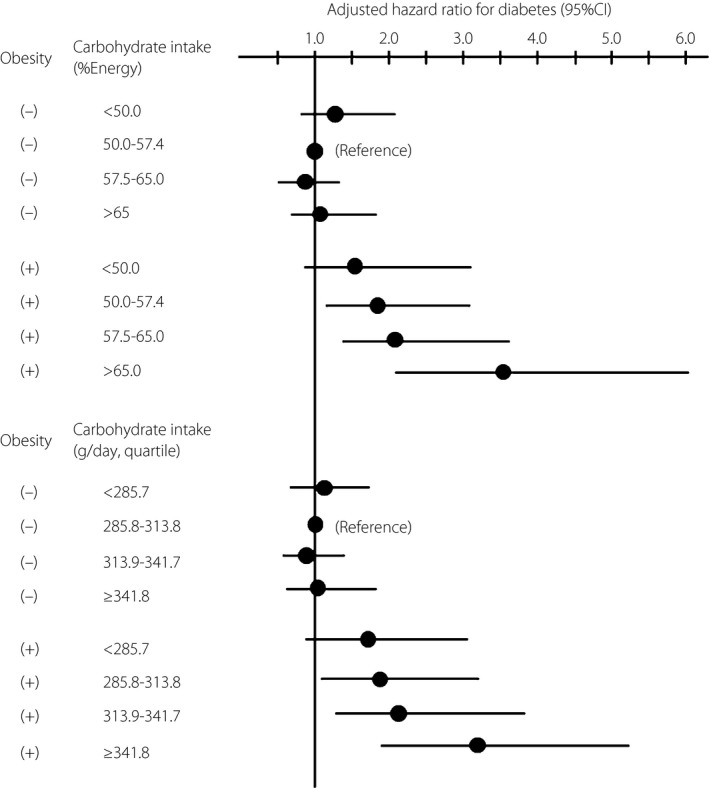
Adjusted hazard ratio for type 2 diabetes based on dietary carbohydrate intake by the presence of obesity in Japanese men. Hazard ratios were adjusted for age, family history of diabetes, smoking, alcohol drinking, habitual exercise, total energy intake and total fiber intake. CI, confidence interval.
Discussion
We assessed the association between dietary carbohydrate intake and the incidence of type 2 diabetes in middle‐aged Japanese men, and found that the association between these parameters varied with BMI: a carbohydrate intake higher than the desirable proportion for Japanese adults (50–65% energy)29 was associated with increased risk of type 2 diabetes in obese participants, but not non‐obese participants.
In previous studies from Western countries, carbohydrate intake was not associated with the incidence of type 2 diabetes8, 9, 10, 11, 12, 13. In contrast, both the results of the present study and those from a study of Chinese women14 showed that higher carbohydrate intake was associated with an increased risk of diabetes in participants with BMI ≥25 kg/m2. The difference in insulin secretory capacity between Asian and Western subjects4, 5, 6 might affect the results. Higher insulin demand as a result of both obesity‐related insulin resistance and excessive carbohydrate consumption could render compensatory insulin secretion inadequate only in Asian people because of their lower insulin secretory capacity compared with Western people4, 5, 6.
Carbohydrate intake is higher among Asians than Westerners15, 16. The difference in sources of carbohydrate between Asian and Western populations might also contribute to the differences in the relationship between carbohydrate intake and risk of type 2 diabetes. White rice is the main source of carbohydrates for East Asian people, and it constitutes ~70% of the carbohydrates consumed by Japanese people7, 16. In contrast, carbohydrate sources in Western populations frequently vary, and can include rice, bread, pasta and potatoes16. Diets high in refined grains30 and white rice31, or with an otherwise high glycemic index/glycemic load17, 32, can all increase the risk of diabetes. As such, the increased carbohydrate intake predominantly from white rice might increase the risk for type 2 diabetes in East Asian populations.
Although average carbohydrate intake has decreased in the past few decades7, the prevalence of diabetes has increased in Japan and other East Asian countries. These ecological observations might not be compatible with our results that high carbohydrate intake was associated with higher risk for diabetes in obese Japanese men. However, the prevalence of obesity has increased in Japanese men, and the rise in the numbers of such subjects who are at high risk for diabetes because of their carbohydrate intake might be reflected in an increase in actual diabetes cases.
We found linear trends in the associations between the carbohydrate energy ratio (% energy) and the total carbohydrate intake (g/day), and the incidence of diabetes in obese subjects. The association between the diabetes incidence and the carbohydrate energy ratio was stronger. As is true also of total energy intake, an appropriate carbohydrate intake depends on BMI and the level of physical activity. The carbohydrate energy ratio might be a more suitable index of dietary quality when diet is to be modified to prevent diabetes development in a general population. The Dietary Reference Intakes for Japanese (2015) show that the desirable energy intake from carbohydrates is 50–65%29. However, this value is based on the general Japanese diet. We found that carbohydrate intake was associated with the risk of diabetes development in a Japanese population; diets with desirable proportions of carbohydrates (50–65% energy) might effectively prevent the development of type 2 diabetes in obese Japanese subjects.
The present study had several strengths, including a relatively large sample size. In addition, although several previous cohort studies have used information collected from self‐administered questionnaires, our conclusions are based on more reliable data, including formal medical examinations, and fasting blood glucose and HbA1c measurements. However, the study also had several limitations. The study population only included participants who were employed. Because poor health might exclude some individuals from working, the prevalence of obesity and the incidence of diabetes might be lower in the present study than in the general Japanese population. Another limitation was that an observational study cannot evaluate the impact of fat intake on the association between carbohydrate intake and the incidence of diabetes. Carbohydrate intake is strongly and inversely associated with fat intake. Furthermore, subjects consuming high‐carbohydrate/low‐fat diets might include those on special diets, which could independently increase the risk of diabetes. Previous studies showed that a higher carbohydrate intake per se increased the risk of diabetes14, 17, 30, 31, 32. An interventional study is required to clarify whether a high‐carbohydrate or a low‐fat diet more strongly affects the incidence of diabetes. In addition, we did not distinguish between type 1 and type 2 diabetes. However, because the study participants were middle‐aged and the condition was detected during annual medical examinations, it is unlikely that many cases were type 1 diabetes.
In conclusion, the present results show that the association between carbohydrate intake and risk of diabetes varies with BMI, and that higher carbohydrate intake was associated with a greater risk of diabetes in obese subjects, but not in those who were not obese. Obese subjects with carbohydrate intake >65% energy should reduce their intakes to within the desirable energy proportions for Japanese people (50–65% energy), to prevent the development of type 2 diabetes.
Disclosure
The authors declare no conflict of interest.
Supporting information
Table S1| Baseline characteristics of study participants by dietary carbohydrate intake (% energy) and obesity status.
Table S2| Baseline characteristics of study participants by dietary carbohydrate intake (g/day) and obesity status.
Acknowledgments
This study was supported by a Grant‐in‐Aid from the Ministry of Health, Labor and Welfare; Health and Labor Sciences research grants, Japan (H18‐Junkankitou [Seishuu]‐Ippan‐012, H19‐Junkankitou [Seishuu]‐Ippan‐012, H19‐Junkankitou [Seishuu]‐Ippan‐ 021, H20‐Junkankitou [Seishuu]‐Ippan‐013, H22‐Junkankitou [Seishuu]‐Ippan‐005, H23‐Junkankitou [Seishuu]‐Ippan‐005, H26‐Junkankitou [Seisaku]‐Ippan‐001); a Grant‐in‐Aid from the Ministry of Education, Culture, Sports, Science and Technology of Japan for Scientific Research (B) 20390188, and for Young Scientists 20790449, a Grant for Promoted Research from Kanazawa Medical University (S2008‐5), and the Japan Arteriosclerosis Prevention Fund.
J Diabetes Investig 2016; 7: 343–351
References
- 1. Yoon KH, Lee JH, Kim JW, et al Epidemic obesity and type 2 diabetes in Asia. Lancet 2006; 368: 1681–1688. [DOI] [PubMed] [Google Scholar]
- 2. Park YW, Allison DB, Heymsfield SB, et al Larger amounts of visceral adipose tissue in Asian Americans. Obes Res 2001; 9: 381–387. [DOI] [PubMed] [Google Scholar]
- 3. He Q, Horlick M, Thornton J, et al Sex and race differences in fat distribution among Asian, African‐American, and Caucasian prepubertal children. J Clin Endocrinol Metab 2002; 87: 2164–2170. [DOI] [PubMed] [Google Scholar]
- 4. Chen KW, Boyko EJ, Bergstrom RW, et al Earlier appearance of impaired insulin secretion than of visceral adiposity in the pathogenesis of NIDDM. 5‐Year follow‐up of initially nondiabetic Japanese‐American men. Diabetes Care 1995; 18: 747–753. [DOI] [PubMed] [Google Scholar]
- 5. Matsumoto K, Miyake S, Yano M, et al Glucose tolerance, insulin secretion, and insulin sensitivity in nonobese and obese Japanese subjects. Diabetes Care 1997; 20: 1562–1568. [DOI] [PubMed] [Google Scholar]
- 6. Sakurai M, Miura K, Takamura T, et al J‐shaped relationship between waist circumference and subsequent risk for Type 2 diabetes: an 8‐year follow‐up of relatively lean Japanese individuals. Diabet Med 2009; 26: 753–759. [DOI] [PubMed] [Google Scholar]
- 7. The National Health and Nutrition Survey in Japan, 2011 . Office for Life‐style Related Diseases Control, General Affairs Division, Health Service Bureau, Ministry of Health, Labour and Welfare(in Japanese); 2013.
- 8. Colditz GA, Manson JE, Stampfer MJ, et al Diet and risk of clinical diabetes in women. Am J Clin Nutr 1992; 55: 1018–1023. [DOI] [PubMed] [Google Scholar]
- 9. Salmeron J, Ascherio A, Rimm EB, et al Dietary fiber, glycemic load, and risk of NIDDM in men. Diabetes Care 1997; 20: 545–550. [DOI] [PubMed] [Google Scholar]
- 10. Salmeron J, Manson JE, Stampfer MJ, et al Dietary fiber, glycemic load, and risk of non‐insulin‐dependent diabetes mellitus in women. JAMA 1997; 277: 472–477. [DOI] [PubMed] [Google Scholar]
- 11. Meyer KA, Kushi LH, Jacobs DR Jr, et al Carbohydrates, dietary fiber, and incident type 2 diabetes in older women. Am J Clin Nutr 2000; 71: 921–930. [DOI] [PubMed] [Google Scholar]
- 12. Harding AH, Day NE, Khaw KT, et al Dietary fat and the risk of clinical type 2 diabetes: the European prospective investigation of Cancer‐Norfolk study. Am J Epidemiol 2004; 159: 73–82. [DOI] [PubMed] [Google Scholar]
- 13. Schulze MB, Schulz M, Heidemann C, et al Carbohydrate intake and incidence of type 2 diabetes in the European Prospective Investigation into Cancer and Nutrition (EPIC)‐Potsdam Study. Br J Nutr 2008; 99: 1107–1116. [DOI] [PubMed] [Google Scholar]
- 14. Villegas R, Liu S, Gao YT, et al Prospective study of dietary carbohydrates, glycemic index, glycemic load, and incidence of type 2 diabetes mellitus in middle‐aged Chinese women. Arch Intern Med 2007; 167: 2310–2316. [DOI] [PubMed] [Google Scholar]
- 15. Zhou BF, Stamler J, Dennis B, et al Nutrient intakes of middle‐aged men and women in China, Japan, United Kingdom, and United States in the late 1990s: the INTERMAP study. J Hum Hypertens 2003; 17: 623–630. [DOI] [PMC free article] [PubMed] [Google Scholar]
- 16. Brown IJ, Elliott P, Robertson CE, et al Dietary starch intake of individuals and their blood pressure: the International Study of Macronutrients and Micronutrients and Blood Pressure. J Hypertens 2009; 27: 231–236. [DOI] [PMC free article] [PubMed] [Google Scholar]
- 17. Sakurai M, Nakamura K, Miura K, et al Dietary glycemic index and risk of type 2 diabetes mellitus in middle‐aged Japanese men. Metabolism 2012; 61: 47–55. [DOI] [PubMed] [Google Scholar]
- 18. Sakurai M, Nakamura K, Miura K, et al Self‐reported speed of eating and 7‐year risk of type 2 diabetes mellitus in middle‐aged Japanese men. Metabolism 2012; 61: 1566–1571. [DOI] [PubMed] [Google Scholar]
- 19. Sakurai M, Nakamura K, Miura K, et al Sugar‐sweetened beverage and diet soda consumption and the 7‐year risk for type 2 diabetes mellitus in middle‐aged Japanese men. Eur J Nutr 2014; 53: 2512–2558. [DOI] [PubMed] [Google Scholar]
- 20. Kashiwagi A, Kasuga M, Araki E, et al International clinical harmonization of glycated hemoglobin in Japan: From Japan Diabetes Society to National Glycohemoglobin Standardization Program values. J Diabetes Investig 2012; 3: 39–40. [DOI] [PMC free article] [PubMed] [Google Scholar]
- 21. The Examination Committee of Criteria for Metabolic Syndrome . Definition and Criteria of Metabolic Syndrome. J Jpn Soc Int Med 2005; 94: 794–809. [Google Scholar]
- 22. Sasaki S, Yanagibori R, Amano K. Self‐administered diet history questionnaire developed for health education: a relative validation of the test‐version by comparison with 3‐day diet record in women. J Epidemiol 1998; 8: 203–215. [DOI] [PubMed] [Google Scholar]
- 23. Sasaki S, Ushio F, Amano K, et al Serum biomarker‐based validation of a self‐administered diet history questionnaire for Japanese subjects. J Nutr Sci Vitaminol (Tokyo) 2000; 46: 285–296. [DOI] [PubMed] [Google Scholar]
- 24. Okubo H, Sasaki S, Rafamantanantsoa HH, et al Validation of self‐reported energy intake by a self‐administered diet history questionnaire using the doubly labeled water method in 140 Japanese adults. Eur J Clin Nutr 2008; 62: 1343–1350. [DOI] [PubMed] [Google Scholar]
- 25. Kobayashi S, Honda S, Murakami K, et al Both comprehensive and brief self‐administered diet history questionnaires satisfactorily rank nutrient intakes in Japanese adults. J Epidemiol 2012; 22: 151–159. [DOI] [PMC free article] [PubMed] [Google Scholar]
- 26. Science and Technology Agency . Standard Tables of Food Composition in Japan (in Japanese). 5th rev. Tokyo: Printing Bureau of the Ministry of Finance; 2005. [Google Scholar]
- 27. Diagnosis and classification of diabetes mellitus . Diabetes Care 2013; 36(Suppl 1): S67–S74. [DOI] [PMC free article] [PubMed] [Google Scholar]
- 28. Seino Y, Nanjo K, Tajima N, et al Report of the Committee on the Classification and Diagnostic Criteria of Diabetes Mellitus. J Diabetes Investig 2010; 1: 212–228. [DOI] [PMC free article] [PubMed] [Google Scholar]
- 29. Ministry of Health, Labour, and Welfare, Japan . Dietary Reference Intakes for Japanese, 2015. Tokyo, Japan: Daiichi Shuppan Publishing Co, Ltd, 2015(in Japanese). [Google Scholar]
- 30. Ye EQ, Chacko SA, Chou EL, et al Greater whole‐grain intake is associated with lower risk of type 2 diabetes, cardiovascular disease, and weight gain. J Nutr 2012; 142: 1304–1313. [DOI] [PMC free article] [PubMed] [Google Scholar]
- 31. Hu EA, Pan A, Malik V, et al White rice consumption and risk of type 2 diabetes: meta‐analysis and systematic review. BMJ 2012; 344: e1454. [DOI] [PMC free article] [PubMed] [Google Scholar]
- 32. Barclay AW, Petocz P, McMillan‐Price J, et al Glycemic index, glycemic load, and chronic disease risk–a meta‐analysis of observational studies. Am J Clin Nutr 2008; 87: 627–637. [DOI] [PubMed] [Google Scholar]
Associated Data
This section collects any data citations, data availability statements, or supplementary materials included in this article.
Supplementary Materials
Table S1| Baseline characteristics of study participants by dietary carbohydrate intake (% energy) and obesity status.
Table S2| Baseline characteristics of study participants by dietary carbohydrate intake (g/day) and obesity status.