Abstract
Background
Psychomotor retardation, leaden paralysis and fatigue are often used to describe patients with depressive disorders. However, there is limited understanding of their meaning and how they are objectively manifested in the physical world. Patients with seasonal affective disorder (SAD) are characteristically hypoactive, and experience restoration in energy during effective treatment with bright light. In this study, we attempt to identify quantitative metrics of psychomotor activity that correspond to the clinical perceptions of hypoactivity and to the early activating effects of treatment.
Methods
Novel means of assessing the microstructure of activity was employed using wavelets and Hurst exponents to indicate the proclivity of subjects to persist at higher and lower levels of activity. This was assesed using actigraphs in 16 unmedicated patients with SAD before and following two weeks of bright light therapy.
Results
Two weeks of phototherapy had no significant effect on mean levels of diurnal activity, but altered the microstructure of the activity. Specifically, phototherapy produced a significant reduction in inertial resistance in patients who had a 50% or greater reduction in Hamilton Depression scores (n=8), as reflected in reduced tendency to persist at low levels of activity. There was also a strong correlation between ratings of fatigue and measures of persistence at high versus low activity in initial responders, but not in initial non-responders.
Conclusion
These findings suggest that light therapy alters the nature of diurnal activity troughs in early responsive patients, reducing their tendency to persist at low levels, possibly reflecting an alleviation of psychomotor retardation.
Keywords: Seasonal affective disorders, locomotor activity, bright light phototherapy, wavelets, non-linear dynamics, psychomotor retardation
Background
Seasonal affective disorder (SAD) is a recurring mood disorder that affects about 6% of adults living far from the equator [1]. Most patients with SAD have atypical depressive symptoms characterized by fatigue, hypersomnia, and carbohydrate cravings [1]. Objective measures of locomotor activity levels with wrist-worn actigraphs, have reported that adults with SAD were, on average, 14% less active than healthy controls [2]. However, there was considerable overlap in activity levels between groups despite prominent symptoms of fatigue or psychomotor retardation in subjects with SAD [2]. Traditional measures such as mean activity levels ignore the richness and complexity of human activity and potentially provide a incomplete picture of activity disturbances that we describe as psychomotor agitation or retardation and lack the sensitivity to detect therapeutic effects. In the present paper we illustrate a new analysis of locomotor activities and show that this method reveals effects of treatment that were not discernible using conventional methods.
Locomotor activity patterns of humans are characterized by a prominent circadian cycle and often a modest 2-cycle per day hemicircadian component. Together, these rhythms account for about 50% of the variance. Otherwise, the pattern is essentially aperiodic (e.g., [3]). A number of investigators have studied the time correlations of locomotor activity to assess hidden temporal characteristics [4]. These studies have shown that human physical activity has so-called scale-invariant features. This means that the pattern of fluctuations in activity have a fractal-like nature, and look similar whether one examines slow fluctuations over long periods of activity or rapid fluctuations during brief periods. Due to this self-similarity it turns out that a single mathematical parameter called a power-law scaling exponent essentially characterizes the pattern of fluctuations. Furthermore this exponent characterizes the degree of persistency of activity, i.e., whether high periods of activity tend to be followed by high periods (persistent) or tend to be followed by low periods (anti-persistent). This parameter conveys a great deal of information about the temporal structure of activity and may provide greater insight into the nature of activity disturbances in psychiatric disorders.
Ohashi et al. [5] reported that locomotor activity in children with SAD have different power-law scaling exponents compared to the age matched controls. Another study with healthy adults, found that the power-law scaling exponents were different for periods with higher (e.g., in motion) and lower (e.g., resting) activity levels [6]. Healthy controls had more anti-persistent patterns of activity at higher than at lower levels of activity. This means that periods of high activity were associated with abrupt onsets and offsets, while lower periods of activity were associated with more gradual transitions. Patients with chronic fatigue syndrome (CFS) [7] lacked these abrupt anti-persistent bursts of activity, and had equivalent scaling exponents during periods with higher and lower activity levels, possibly due to exaggerated fatigue [8]. Differentiating the scaling exponents for higher and lower activity levels improved sensitivities to evaluate the disease severity [9] and the effect of potential treatment [10] in patients with Parkinson’s disease.
Bright light therapy has been reported to alleviate symptoms of SAD [1,11]. Previous studies quantifying the effect of bright light therapy have focused on circadian rest-activity rhythms [12]. However, little is known about the effects of bright light therapy activity patterns within the daytime period. In this study, we used the method incorporating bidirectional analysis of scaling exponents [5,6,8] and studied the alterations in the time correlations of daytime locomotor activity data before and during the second week of bright-light therapy in patients with seasonal affective disorders (SAD). Locomotor micro-activities were examined separately for responsive and non-responsive SAD patients to therapy as assessed using the 21-item Hamilton’s depression scale, with an eight-item addendum for atypical depressive symptoms for SAD (SIGH-SAD) [13].
Methods
Subjects
Adult subjects were recruited by advertising who met criteria for SAD and were interested in a trial of bright light phototherapy. Subjects were assessed by structured clinical interview (SCID-CV) [14] and met DSM-IV criteria for major depression with seasonal pattern and Rosenthal-NIMH criteria for SAD [1]. The sample consisted of 12 women and 4 men who ranged in age from 21 to 52 years (39.6±8.45 years; mean±S.D). All the subjects were studied during their natural daily routine and all were free from psychotropic medications. The protocol was approved by the McLean Hospital Institutional Review Board, and all subjects provided informed written consent.
Procedures
Activity data were collected with an ambulatory activity monitor (Mini-Motionlogger Ambulatory Monitors Inc., Ardsley, NY) that was worn on the non-dominant wrist. The device counted all accelerations (>0.01g force zero-crossing mode) and stored results in 1 minute epochs. The subjects were instructed to wear the device continuously except while bathing and to record times when the device was taken off along with bedtimes and rise times. At least 72 hours of continuous recording were collected during pretreatment baseline, and again during the first and second weeks of phototherapy. Subjects received an open trial of bright light phototherapy using a tilted UV-filtered commercial light box (SunRay II, SunBox, Inc. Gaithersburg, Maryland), which provided 10,000 lux of light at a distance of 58 cm from the source. Intensity was confirmed using a Minolta Chroma Meter II. Subjects received 30 min of daily treatment each morning (increasing to 60 minutes in non-responders) using procedures described by Terman et al [11]. Response to treatment was assessed weekly using the SIGH-SAD.
Data Analyses
We analyzed the daytime locomotor activities during one week prior to the bright light therapy as the baseline. Activity data were also collected during the second week of phototherapy (days 8–14) to examine the changes due to the treatment. Subjects continued to receive 30–60 minutes of bright light therapy in the morning during this phase.
Periods when the subjects removed the actigraph or napped were marked as invalid and interpolated linearly. Such periods were determined by the subjects’ written record and the Cole’s algorithm for sleep detection [15]. Days containing less than 720 points of valid daytime data (i.e., less than 12 hours), were excluded from analysis.
After the week of pre-therapy activity recording, SIGH-SAD was measured as a baseline depression score. The SIGH-SAD was again measured at the beginning and the end of the second week of therapy and was averaged within each subject to provide their depression score during treatment. For three subjects who lacked one of the post-treatment SIGH-SAD ratings the single score available was used. We classified the patients into responders and non-responders to compare the effect of therapy on locomotor activities. We defined “responders” as those who showed 50 percent or more decreases in SIGH-SAD during light treatment compared to the pre-therapy values, with the rest of the patients defined as “non-responders”. Consequently, 8 patients (1M/7F) were categorized into the responder group and the remaining 8 patients (3M/5F) were categorized into the non-responder group. This resulted in marked decreases in the SIGH-SAD for the responders and minimal change for non-responders. The two groups had nearly equivalent pretreatment SIGH-SAD ratings (Table 1).
Table 1.
SIGH-SAD scores and average scaling exponents at maxima and minima
| Pre-Treatment | Post-Treatment | |||||||||
|---|---|---|---|---|---|---|---|---|---|---|
|
| ||||||||||
| HAMD | Retardationa | Fatigabilityb | Maxima | Minima | HAMD | Retardationa | Fatigabilityb | Maxima | Minima | |
| Responder | ||||||||||
|
| ||||||||||
| Subj 1 | 33 | 2 | 3 | 1.082 | 1.019 | 5 | 0 | 0 | 1.035 | 1.020 |
| Subj 2 | 33 | 0 | 3 | 1.019 | 1.025 | 1 | 0 | 0 | 1.001 | 0.940 |
| Subj 3 | 32 | 0 | 3 | 1.022 | 1.004 | 1 | 0 | 0 | 0.806 | 0.827 |
| Subj 4 | 24 | 0 | 2 | 0.796 | 0.918 | 11.5 | 0 | 1.5 | 0.883 | 0.902 |
| Subj 5 | 27 | 2 | 2 | 0.896 | 1.032 | 12.5 | 0.5 | 1.5 | 0.844 | 0.909 |
| Subj 6 | 27 | 2 | 2 | 0.856 | 0.876 | 2 | 0 | 1 | 0.852 | 0.870 |
| Subj 7 | 18 | 1 | 1 | 0.784 | 1.136 | 5 | 0 | 0.5 | 0.897 | 0.951 |
| Subj 8 | 37 | 1 | 3 | 0.957 | 0.857 | 15.5 | 0.5 | 1 | 0.848 | 0.768 |
|
| ||||||||||
| Mean | 28.9 | 1.0 | 2.4 | 0.926 | 0.983 | 6.7 | 0.1 | 0.7 | 0.896 | 0.898 |
| 95% CI | 23.8–34.0 | 0.2–1.8 | 1.8–3.0 | 0.834–1.019 | 0.905–1.061 | 1.9–11.4 | −0.1–0.3 | 0.1–1.2 | 0.828–0.963 | 0.833–0.963 |
|
| ||||||||||
| Non-Responder | ||||||||||
|
| ||||||||||
| Subj 9 | 32 | 2 | 4 | 0.826 | 0.677 | 26.5 | 0.5 | 2 | 0.947 | 1.000 |
| Subj 10 | 27 | 2 | 2 | 0.701 | 0.688 | 20 | 2 | 2 | 0.808 | 0.866 |
| Subj 11 | 32 | 2 | 2 | 1.116 | 1.131 | 26 | 2 | 2 | 0.877 | 0.978 |
| Subj 12 | 28 | 2 | 3 | 1.030 | 1.024 | 16 | 1 | 1.5 | 1.003 | 1.083 |
| Subj 13 | 24 | 1 | 2 | 0.721 | 0.838 | 27 | 0.5 | 2 | 0.850 | 0.949 |
| Subj 14 | 19 | 0 | 3 | 0.877 | 1.036 | 18 | 0 | 3 | 0.809 | 0.775 |
| Subj 15 | 38 | 2 | 4 | 0.991 | 0.985 | 32.5 | 1 | 3 | 0.881 | 0.962 |
| Subj 16 | 25 | 2 | 3 | 0.768 | 0.952 | 18.5 | 1.5 | 2.5 | 0.727 | 0.768 |
|
| ||||||||||
| Mean | 28.1 | 1.6 | 2.9 | 0.879 | 0.916 | 23.1 | 1.1 | 2.3 | 0.863 | 0.923 |
| 95% CI | 23.2–33.0 | 1.0–2.2 | 2.2–3.6 | 0.751–1.006 | 0.777–1.055 | 18.3–27.9 | 0.5–1.7 | 1.8–2.7 | 0.791–0.935 | 0.830–1.015 |
- 0 - normal speech and thought
- 1 - slight retardation at interview
- 2 - obvious retardation at interview
- 3 - interview difficult
- 4 - complete stupor
- 0 - does not feel more fatigued than usual
- 1 - feels more fatigued than usual but this has not impaired function significantly; less frequent than in 2
- 2 - more fatigued than usual; at least one hour a day; at least three days a week
- 3 - fatigued much of the time most days
- 4 - fatigued almost all the time
Microstructure Analysis
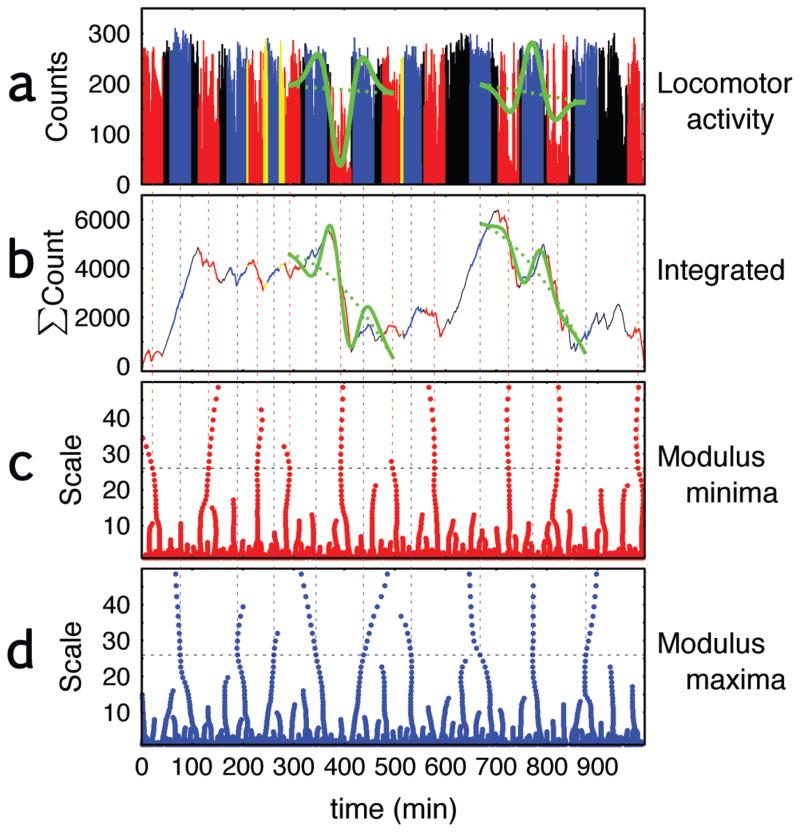
The scale-invariant dynamics of the locomotor activity data were examined by a modification [6,8] of the wavelet transform modulus maxima (WTMM) approach [16]. The WTMM approach uses wavelets to detect discontinuities or singularities in the actigraph data. The basic idea behind the analysis is as follows. The actigraph time series for each subject is fit to a series of wavelets that resemble right-side up or upside-down “Mexican Hats” (see Fig. 1a). The wavelets range in scale from “skinny” to “fat”, reflecting the entire range of short-term (rapid) to long-term (slow) fluctuations in activity. These wavelets are essentially templates for low-high-low activity patterns (Fig. 1a right green), or high-low-high activity level patterns (Fig. 1a left green) depending on the direction of the wavelet. Wavelets of each scale are slid along the time series to assess their degree of correspondence at each time point using a mathematic procedure known as convolution. Then a calculation is made to determine whether the smaller or the larger scales wavelets are more dominant in the data by looking at the values of the convolution for all scales. Predominance of longer scales is indicative of persistence, whereas predominance of shorter scales indicates anti-persistence. The original WTMM approach provides one measure of persistence, using both upward and downward pointing wavelets. However, in this study measures of persistence were calculated separately for low-high-low activity patterns and high-low-high activity patterns.
Figure 1. Locations of modulus minima and maxima, and average, variance, DFA exponent of locomotor activities.
(a) A daytime record of locomotor activity collected by a wrist-worn actigraph in a patient with seasonal affective disorder, (b) the integrated physical activity, (c) the locations of local minima of the wavelet transform of the integrated series, and (d) location of the local maxima. The locomotor activities (a) and the integrated activities (b) are colored red at the locations of all the minima and blue for all the maxima, based on wavelets time frames of about 26 and 40 minutes. The data are colored yellow when the minima and maxima overlap. Green curves on the actigraph records show the Gaussian 2nd derivative with the local linear trend and those on the integrated activities show the Gaussian 3rd derivative with the 2nd order polynomial trend detecting one local minimum (left) and maximum (right) at their locations.
The more rigid procedure of the analysis is as follows. In this study, we used the Gaussian 3rd derivative
| (1) |
as a mother wavelet to examine the integrated locomotor activity data. This is equivalent to using the Gaussian 2nd derivative (so-called “Mexican hat”) wavelet to examine the raw signals though the integrated approach automatically removes the local mean and the local linear trend (Fig. 1b).
In the WTMM method [16], the degree of the temporal correlation is calculated from a partition function Zq(a), defined as the sum of the q-th powers of the local maxima of the modulus of the wavelet transform coefficients at wavelet scale a from the entire record. The moment parameter q is used to control the degree of emphasis on magnitude of fluctuations matching the wavelet template. For example, if q=0, Zq(a) just counts the number of maxima/minima at the scale a, irrespective of whether they are large or small in terms of the magnitude. In case of q=2, however, the average degree of predominance of fluctuation at the scale a is evaluated by the squared local maxima, i.e., the variance, at that scale. With q ≥ 2 large fluctuations matching the template (see, e.g., large troughs in Fig. 5) predominantly determine the results. The power law scaling of Zq(a), or a linear relationship between log(a) and log(Zq(a)), yields the scaling exponents τ(q) for small a. The scaling exponents τ(q) is then related to the so-called local Hurst exponent by h ≈ dτ(q)/dq [17], which quantifies the overall degree of temporal correlation of the time series.
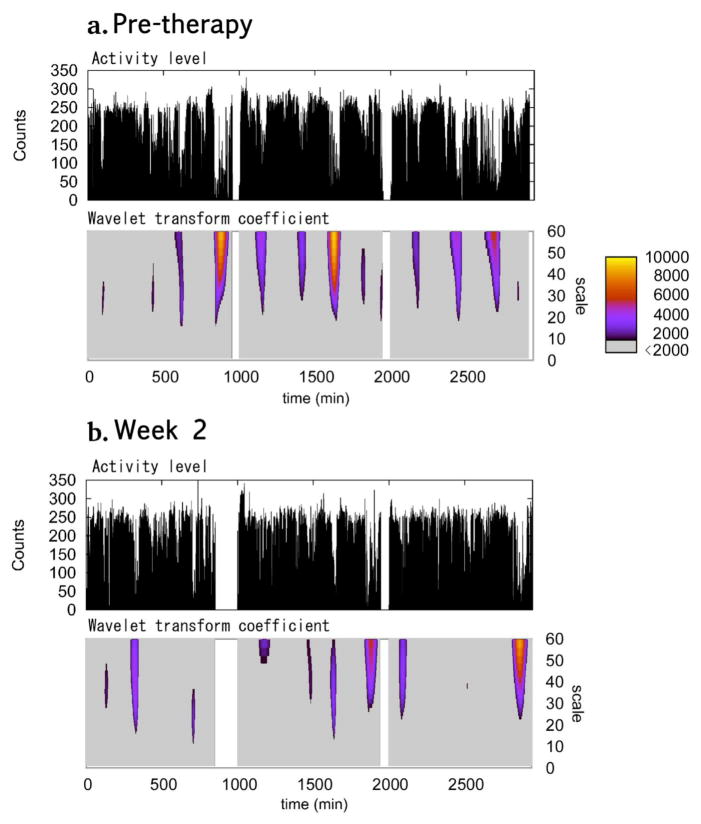
Figure 5. Locomotor activity and wavelet transform coefficient before and 2nd week of phototherapy.
Typical example of 3 day locomotor activity (top) and the values of the wavelet transform coefficient (bottom) for the minima from patient categorized as responders before (a) and during (b) the second week of phototherapy. The second and the third days are shifted so that they start from 1,000 min and 2,000 min, respectively. The wavelet transform coefficients are colored according to their values for those larger than 2000 (right bar). Values smaller than 2000 are colored grey. Slower drops with the lower activity levels are seen in the pre-therapy locomotor activity where the wavelet transform coefficient has larger values (yellow-orange). The drops are much more rapid in the second week of therapy and the minima have the smaller wavelet transform coefficients at larger scales.
Ohashi, et al. [6] reported that, in many real-world signals including locomotor activity time series, the time correlation are asymmetrical between positive and negative changes suggesting different scale-invariant dynamics depending on the direction of the changes. In particular, in locomotor activity, the power-law scaling exponent at the higher levels of activity (which correspond to local maxima of the wavelet transform coefficients) and those at the lower levels of activity (corresponding to local minima) would correspond to qualitatively different physiological states, i.e., active and rest, respectively. Thus, in this study, we analyzed the time correlation for local maxima and minima separately by calculating the partition functions ZqM(a) and Zqm(a) respectively from the maxima and the minima of the wavelet coefficients [6,8].
The partition functions were averaged over all the days prior to therapy and all the days during the second week of therapy to construct ZqM(a) and Zqm(a) for each patient. The scaling exponents τ(q) were obtained for the average of 0.97 < log(a) ≤ 1.74, which correspond to about 9–55 minutes. As shown in Fig. 1, the minima (maxima) respectively identify periods with lower (higher) levels of activity than surrounding periods. The exponents τ(q) and h ≈ dτ(q)/dq were calculated for 0 ≤ q ≤ 3, where asymmetrical properties were observed for locomotor activity time series of healthy individuals [6].
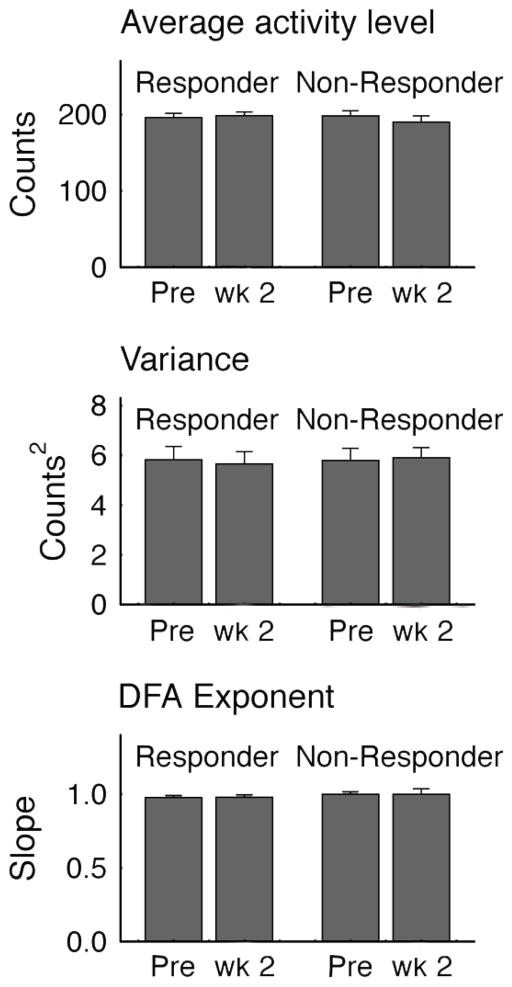
Before conducting the wavelet analysis, we calculated the average, the variance, and the global scaling exponent—calculated by the detrended fluctuation analysis (DFA) [18]—of the activity time series. None of these parameters differed significantly between responders and non-responders (Fig. 2), giving rise to the need for a measure of local dynamics to better delineate the effects of treatment on psychomotor activity.
Figure 2. Measures of average activity, variance and global scaling.
Differences between light-therapy responders versus non-responders in average activity counts per minute, the average within subject variance and the global scaling exponent calculated by the detrended fluctuation analysis (DFA) [18]. Vertical bars represent S.E.M. There were no significant differences in any of the values between responders and non-responders.
Statistical Analysis
The average h ≈ dτ(q)/dq for 0 ≤ q ≤ 3 was calculated separately for the responders and non-responders before and during the therapy. A repeated measure analysis of variance (ANOVA) was performed using SAS software (SAS Institute, Cary, NC) to evaluate the effects of therapy, group (responders or non-responders), and direction (maxima or minima) on the average h, with the subject effects nested in the group as a factor.
Results
Prior to treatment responders and non-responders had mean SIGH-SAD scores of 29 [95% Confidence Intervals (CI), 24 – 34] and 28 [95% CI, 23 – 33], respectively (F[1,16] = 0.063, p > 0.8). During treatment SIGH-SAD scores fell by 76 [95% CI, 60 – 92]% in responders, and by only 17 [95% CI, 3.7 – 31]% in non-responders, which was a direct consequence of the way the groups were defined. The results of the repeated measure ANOVA showed no significant main effects of group, direction, or phototherapy for the average h for 0 ≤ q ≤ 3. However, there was a significant “group X therapy” interaction (F[1, 27] = 7.47, p = 0.01) indicating that the responders and non-responders reacted differently to phototherapy. Thus, for each group, an additional repeated measure ANOVA was conducted to examine the effects of therapy and minima- maxima direction with subjects included as an independent factor. The results revealed that the effect of the therapy was significant only in the responder group (F[1, 7] = 8.34, p = 0.02; non-responders: F[1, 7] = 0.04, p > 0.8). The local Hurst exponent h in responders fell from 0.983 [95% CI, 0.905 – 1.061] to 0.898 [95% CI, 0.833 – 0.963]. In contrast, h for non-responders was 0.916 [95% CI, 0.777 – 1.055] at baseline and 0.923 [95% CI, 0.830 – 1.016] during the second treatment week.
Post-hoc paired t-tests showed that significant alterations in h for responders occurred during the minima (t[7] = 3.25, p < 0.02) but not the maxima (t[7] = 0.83, p > 0.4).
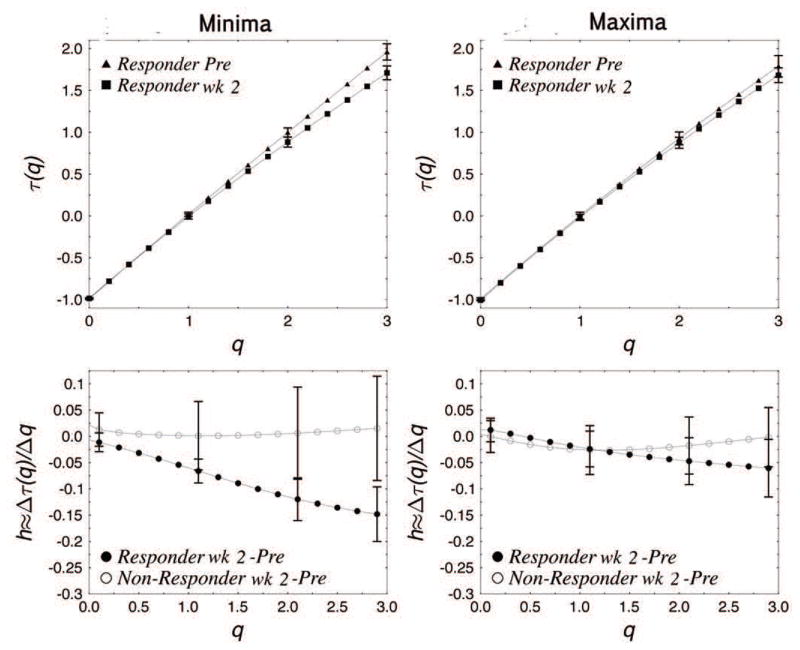
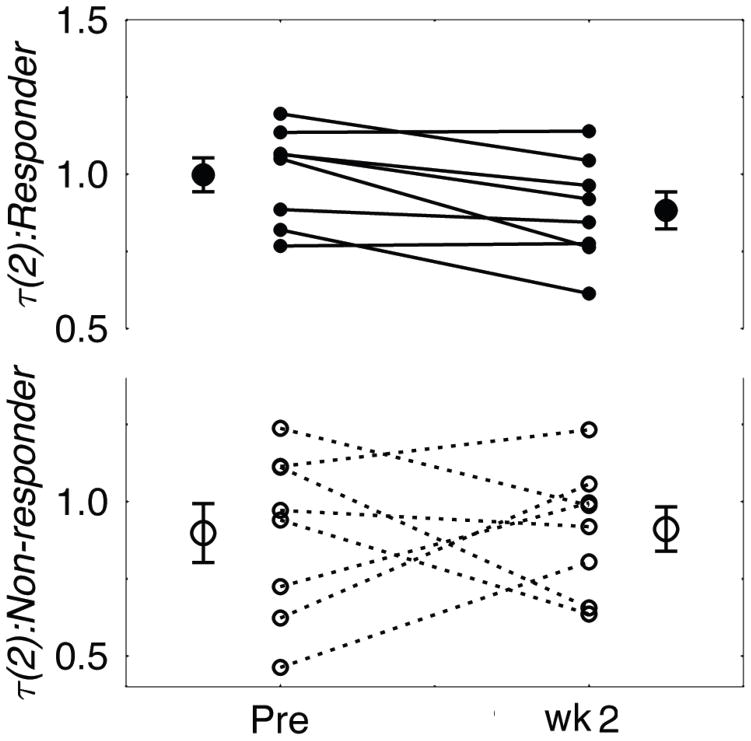
This can be seen in the τ(q) spectra for the minima (Fig. 3, top). The slope of τm(q), which is equivalent to local Hurst exponent h for 0 ≤ q ≤ 3 was smaller for the second week of therapy compared to the pretreatment baseline in the responders’ group (Fig. 3, top left). In addition, the value of τ(2) for the minima, which is equivalent to the DFA exponent but calculated by using the minima only, was decreased during therapy in the responder’s group (t[7] = 3.148, p < 0.02), while there was no significant difference in the non-responder’s group (Fig. 4). The difference between the h ≈ dτ(q)/dq prior to and following treatment in each group (Fig. 3, bottom) shows that for the minima the responders’ h was decreased during therapy, particularly for larger q, while there was no significant change observed in the non-responders’ group. This indicates that the responders had significantly smaller h or stronger anti-persistence at lower levels, or larger troughs, of activity after the initiation of treatment. This difference was not seen in non-responders. In neither group were pre and post light therapy differences in persistence significant during periods with higher levels of the activity.
Figure 3. Multifractal spectra and Hurst exponents.
Multifractal τ(q) spectra for responders prior to light treatment and during the second week of phototherapy within the range of 0 ≤ q ≤ 3 (top), where q is the moment parameter. Comparison between responders and non-responders (bottom) showing the changes in Hurst exponent h within the range 0 ≤ q ≤ 3. The multifractal spectra of non-responders were similar before and during the therapy for minima and maxima (not shown). The vertical bars represent S.E.M. for each group.
Figure 4. τ(2) changes in responders and non-responders.
The τ(q) value at q=2 for each subject in the responder’s group (top; filled circles) and the non-responder’s group (bottom; open circles) before and during the second week of phototherapy. The average and the S.E.M. are shown in the left and the right of each period for both groups. The patients in the responder’s group showed significant decreases in the τ(2) values, while the changes in the non-responder’s group were less consistent.
In responders, locomotor activity before therapy was characterized by having slower or “sluggish” transitions at the lower levels of activity, and the pattern was altered during treatment to show more rapid transitions. In other words, the activity pattern of responders prior to treatment was characterized by the presence of epochs of low level activity in which periods of low level activity were persistently followed by further periods of low level activity. During the second week of treatment this pattern changed. Now during epochs of relative inactivity there was a less persistent tendency to remain at low levels of activity.
Fig. 5 shows the typical 3-day recordings of the locomotor activity in a patient in the responder group. During the pre-treatment period (Fig. 5a), the wavelet transform coefficient for the minima had greater values at larger scales, which are colored in red-yellow. In contrast, during the post-treatment period (Fig. 5b), there was a decrease in these episodes. Greater wavelet transform coefficients generally appear in the graph as broad epochs in which minute-to-minute measure of activity fall to relatively low levels (Fig. 5a). After treatment minima epochs tend to be less broad and/or less deep.
The change in responders’ locomotor activity from slower transitions at the lower levels of activity to more rapid transitions was accompanied by an improvement in the item score in SIGH-SAD for psychomotor retardation based on observation of the interviewer (Table 1). Before treatment, the scores were comparable between responders and non-responders (Wilcoxon rank sum test; p>0.23). However, after treatment, there were significant differences in the scores between the two groups (p<0.008) and the responders showed marked decreases in this score.
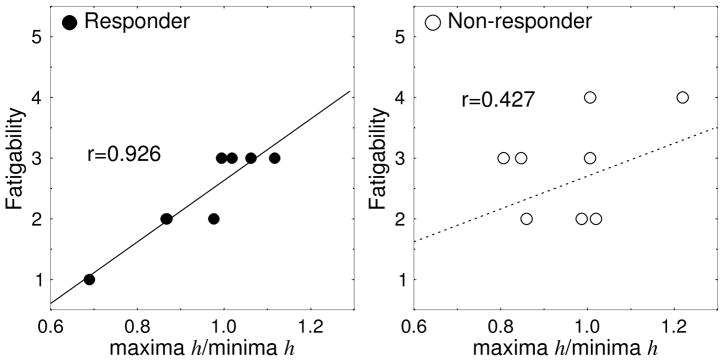
Light therapy responders reporting higher fatigability had more “sluggish” bursts in activities and higher values of the maxima to minima ratio of h before treatment. There was a highly significant correlation between the SIGH-SAD item score of “Fatigability” and the ratio of maxima over minima (r=0.926, p<0.001) in responders (Fig. 6). A significant correlation was also seen between SIGH-SAD scores for item number 15, which asks about “Loss of energy and fatigability”, and the ratio of maxima over minima (r=0.900, p<0.003) in this group. These two items contributed to the significant correlation between the total SIGH-SAD scores and the maxima to minima ratio (r=0.961, p<0.0002) in responders before treatment. Neither of these correlations were found in the non-responders group before treatment (maxima/minima vs. Fatigability, r=0.427, p=0.291; Loss of energy, r=−0.374, p=0.361; total SIGH-SAD, r=0.634, p=0.091).
Figure 6. Relation between Fatiguability and the scaling exponents.
The relation between the ratio of the scaling exponents (maxima/minima) and the SIGH-SAD item score of “Fatigability” for patients in the responder group before treatment (r=0.926, p<0.001; regression line: y = 5.0708x - 2.4367).
Discussion
SAD patients who were responsive to light therapy showed a significant increase in anti-persistence at the lower levels of activity. We postulate that persistence during periods of rest or relative inactivity may be an indication of psychomotor retardation and the quickening of these transitions may indicate the alleviation of this sign of depression. The changes due to the therapy were discernable only when we analyzed separately the time correlation at the higher and lower levels of activity, as the therapeutic effect was seen only at the lower levels of activity. This suggests that the global scaling exponents calculated by conventional fluctuation analyses that evaluate the time correlation of the entire record would obscure the changes due to the therapy. In locomotor activity time series, the time correlation at different levels of activity corresponds to substantially different phases of patients’ activity, i.e., active and rest. Hence, it seems important to analyze the time correlation at higher and lower levels of activity separately.
In treatment-responsive SAD patients baseline ratios of the exponents at maxima versus minima were significantly correlated with the ratings of “Fatigability” (r=0.926) and also with the total SIGH-SAD score (r=0.961). Thus, in the responsive patients before treatment, the severity of their symptoms seemed to be correlated with the persistence during higher levels of activity compared to lower levels of activity, which is consistent with the result for CFS patients [6]. These correlations were not significant in the non-responders group. It is interesting to speculate that phototherapy responsive patients of SAD show a close match between subjective symptom and the microstructure of their activity. In contrast, there appears to be a mismatch between subjective state and objective measures in non-responders.
Conclusions
Overall, this study reveals differences between responders and non-responders to phototherapy in the microstructure of their rest-activity rhythms. Effective treatment appears to exert discernible effects in the microstructure on the way activity fluctuates during periods of reduced activity. Wavelet analysis may have revealed a specific signature reflecting periods of psychomotor retardation and their abatement during treatment. This approach is far more sophisticated and more revealing than traditional measures of mean activity. Further research is needed however to establish a connection between the anti-persistence at lower levels of activity and psychomotor retardation. Few studies have performed microstructure analysis of rest-activity rhythms in patients with psychiatric disorders. One preliminary report suggests the possibility that activity time series of some manic-depressive patients may show temporal power-law correlations [4]. More recent papers have shown altered scaling properties in major depression using a threshold to distinguish low versus high activity periods [19] and an altered distribution of wavelet amplitudes in subjects with bipolar disorders [20]. The present findings suggest that it may be fruitful to utilize this approach in other patient populations, to assess the effects of psychotropic medications on the parameters as well as the correlations between these parameters and ratings of symptom severity.
Acknowledgments
We thank Ann Polcari, Ph.D., R.N., Carol A. Glod, R.N., C.S., Ph.D. and Cynthia E. McGreenery for recruiting subjects and collecting the data, and Z. R. Struzik, Ph.D. for discussion and helpful suggestions. This study was supported by the U.S.A. NIMH award R01-MH48343 to MHT.
Contributor Information
Kyoko Ohashi, Email: kohashi@mclean.harvard.edu.
Yoshiharu Yamamoto, Email: yamamoto@p.u-tokyo.ac.jp.
Martin H. Teicher, Email: martin_teicher@hms.harvard.edu.
References
- 1.Rosenthal NE, Sack DA, Gillin JC, Lewy AJ, Goodwin FK, Davenport Y, et al. Seasonal affective disorder. A description of the syndrome and preliminary findings with light therapy. Arch Gen Psychiatry. 1984 Jan;41:72–80. doi: 10.1001/archpsyc.1984.01790120076010. [DOI] [PubMed] [Google Scholar]
- 2.Teicher MH, Glod CA, Magnus E, Harper D, Benson G, Krueger K, et al. Circadian rest-activity disturbances in seasonal affective disorder. Arch Gen Psychiatry. 1997 Feb;54:124–130. doi: 10.1001/archpsyc.1997.01830140034007. [DOI] [PubMed] [Google Scholar]
- 3.Teicher MH. Actigraphy and motion analysis: new tools for psychiatry. Harv Rev Psychiatry. 1995 May;3:18–35. doi: 10.3109/10673229509017161. [DOI] [PubMed] [Google Scholar]
- 4.Selz KA, Mandell AJ, Anderson CM. Distributions of local Mandelbrot-Hurst exponents: motor activity in fetal rats of cocainized mothers and manic-depressive patients. Fractals. 1995 doi: 10.1142/S0218348X95000783. [DOI] [Google Scholar]
- 5.Ohashi K, Polcari A, HM Scale-Invariant Locomotor Activity Patterns in Children with SAD. International Journal of Integrative Medicine. 2013;1:1. [Google Scholar]
- 6.Ohashi K, Nunes Amaral LA, Natelson BH, Yamamoto Y. Asymmetrical singularities in real-world signals. Phys Rev E Stat Nonlin Soft Matter Phys. 2003 Dec;68:065204. doi: 10.1103/PhysRevE.68.065204. [DOI] [PubMed] [Google Scholar]
- 7.Fukuda K, Straus SE, Hickie I, Sharpe MC, Dobbins JG, Komaroff A. The chronic fatigue syndrome: a comprehensive approach to its definition and study. International Chronic Fatigue Syndrome Study Group. Ann Intern Med. 1994 Dec 15;121:953–959. doi: 10.7326/0003-4819-121-12-199412150-00009. [DOI] [PubMed] [Google Scholar]
- 8.Ohashi K, Bleijenberg G, van der Werf S, Prins J, Amaral LAN, Natelson BH, et al. Decreased fractal correlation in diurnal physical activity in chronic fatigue syndrome. Methods Inf Med. 2004;43:26–29. [PubMed] [Google Scholar]
- 9.Pan W, Ohashi K, Yamamoto Y, Kwak S. Power-law temporal autocorrelation of activity reflects severity of parkinsonism. Mov Disord. 2007 Jul 15;22:1308–1313. doi: 10.1002/mds.21527. [DOI] [PubMed] [Google Scholar]
- 10.Pan W, Soma R, Kwak S, Yamamoto Y. Improvement of motor functions by noisy vestibular stimulation in central neurodegenerative disorders. J Neurol. 2008 Nov;255:1657–1661. doi: 10.1007/s00415-008-0950-3. [DOI] [PubMed] [Google Scholar]
- 11.Terman JS, Terman M, Schlager D, Rafferty B, Rosofsky M, Link MJ, et al. Efficacy of brief, intense light exposure for treatment of winter depression. Psychopharmacol Bull. 1990;26:3–11. [PubMed] [Google Scholar]
- 12.Winkler D, Pjrek E, Praschak-Rieder N, Willeit M, Pezawas L, Konstantinidis A, et al. Actigraphy in patients with seasonal affective disorder and healthy control subjects treated with light therapy. Biol Psychiatry. 2005 Aug 15;58:331–336. doi: 10.1016/j.biopsych.2005.01.031. [DOI] [PubMed] [Google Scholar]
- 13.Williams J, Link MJ, Rosenthal NE, Amira L. Structured Interview Guide for the Hamilton Depression Scale-Seasonal Affective Disorder Version (SIGH-SAD) New York: New York State Psychiatric Institute; 1992. [Google Scholar]
- 14.Spitzer RL, Gibbon M, Williams JBW. User’s Guide for the Structured Clinical Interview for DSM-IV Axis I Disorders SCID-I. 1997. [Google Scholar]
- 15.Cole RJ, Kripke DF, Gruen W, Mullaney DJ, Gillin JC. Automatic sleep/wake identification from wrist activity. Sleep. 1992 Oct;15:461–469. doi: 10.1093/sleep/15.5.461. [DOI] [PubMed] [Google Scholar]
- 16.Muzy JF, Bacry E, Arneodo A. The multifractal formalism revisited with wavelets. International Journal of Bifurcation. 1994 doi: 10.1142/S0218127494000204. [DOI] [Google Scholar]
- 17.Vicsek T. Fractal growth phenomena. 1989. [Google Scholar]
- 18.Peng CK, Havlin S, Stanley HE, Goldberger AL. Quantification of scaling exponents and crossover phenomena in nonstationary heartbeat time series. Chaos: An Interdisciplinary Journal of Nonlinear Science. 1995 Mar 1;5:82–87. doi: 10.1063/1.166141. [DOI] [PubMed] [Google Scholar]
- 19.Nakamura T, Kiyono K, Yoshiuchi K, Nakahara R, Struzik ZR, Yamamoto Y. Universal scaling law in human behavioral organization. Phys Rev Lett. 2007 Sep 28;99:138103. doi: 10.1103/PhysRevLett.99.138103. [DOI] [PubMed] [Google Scholar]
- 20.Indic P, Salvatore P, Maggini C, Ghidini S, Ferraro G, Baldessarini RJ, et al. Scaling behavior of human locomotor activity amplitude: association with bipolar disorder. PLoS ONE. 2011;6:e20650. doi: 10.1371/journal.pone.0020650. [DOI] [PMC free article] [PubMed] [Google Scholar]


