

Abstract
Glioblastoma multiforme (GBM) is the most common and malignant primary brain tumor in adults because of its highly invasive behavior. The existing treatment for GBM, which involves a combination of resection, chemotherapy, and radiotherapy, has a very limited success rate with a median survival rate of <1 year. This is mainly because of the failure of early detection and effective treatment. We designed a novel 3-D GBM cell culture model based on microwells that could mimic in vitro environment and help to bypass the lack of suitable animal models for preclinical toxicity tests. Microwells were fabricated from simple and inexpensive polyethylene glycol material for the control of in vitro 3-D culture. We applied the 3-D micropatterning system to GBM (U-87) cells using the photolithography technique to control the cell spheroids’ shape, size, and thickness. Our preliminary results suggested that uniform GBM spheroids can be formed in 3-D, and the size of these GBM spheroids depends on the size of microwells. The viability of the spheroids generated in this manner was quantitatively evaluated using live/dead assay and shown to improve over 21 days. We believe that in vitro 3-D cell culture model could help to reduce the time of the preclinical brain tumor growth studies. The proposed novel platform could be useful and cost-effective for high-throughput screening of cancer drugs and assessment of treatment responses.
Keywords: Glioblastoma, in vitro, microwells, PEG hydrogel
Glioblastoma multiforme (GBM) is the most common and malignant primary brain tumor in adults. The existing treatment for GBM, which involves a combination of resection, chemotherapy and radiotherapy, has a very limited success rate with a median survival rate of less than 1 year, mainly because of the failure of early detection and effective treatment. We present a novel 3D GBM cell culture model based on microwells that could mimic the in vivo environment and help to bypass the lack of suitable animal models for preclinical toxicity tests. Microwells were fabricated from simple and inexpensive PEG material for the control of in vitro 3D culture. The viability of the spheroids generated in this manner was quantitatively evaluated using live/dead assay and shown to improve over 21 days. The proposed novel platform could be useful and cost-effective for high-throughput screening of cancer drugs and assessment of treatment responses.

I. Introduction
Glioblastoma multiforme (GBM) is the most common and deadly among all human primary brain tumors [1]. It is estimated there are annually 9000 new cases of GBM cancer diagnosed in the United States, and the survival rate is as low as 5 years and 12–15 months of median survival [2], [3]. Current therapies such as surgery [4], radiotherapy followed by chemotherapy [5]–[7] do not significantly increase the poor prognosis. Early detection failure, therapeutic resistance, and the unidentified mechanisms underlying GBM tumor development are the main reasons of poor treatment outcomes [8].
The GBM’s tumor size is an ideal indicator of either early GBM development or therapeutic resistance. Further, therapeutic resistance requires combined therapies [9]–[11] that might be a rational and practical option in a high-throughput manner. Therefore, in vitro GBM models that enhance the understanding of GBM development and act as screening tools, such as for drug screening and therapeutics, are urgently needed.
In vitro models based on two-dimensional (2D) monolayer culture were used to study cancer behavior, e.g., tumor growth, metastasis and resistance to antitumor agents [12]–[14]. Significant differences have been observed for cancers in 2D and three-dimensional (3D) microenvironments [15]–[17], such as treatment response [18]–[20], aggressiveness [21]–[24], gene expression profiles [21], and response to mitogenic factors [25]. For example, cancer cells grown in 2D monolayer are morphologically diverse and express dissimilar markers compared to 3D cancer models because of the lack of in vivo microenvironmental context to reproduce the earliest stages of metastasis [26]–[29]. The altered microenvironments, such as cell-to-cell and cell-extracellular matrix (ECM) interactions, which limit the models’ application for studying tissue specific functions, may explain the difference. Effective 3D in vitro glioblastoma cancer models that can recapitulate in vivo features are thus needed.
Numerous methods were recently used to grow 3D spheroids [30], [31]. In vitro 3D tumor models contribute a promising platform of disease that mimics in vivo behaviors of tumor cells to develop potential cancer therapies [16], [32]–[37]. A variety of approaches have been used, such as well-plates [34], [36], or several types of scaffolds and matrix materials, e.g. collagen [37], 3D polymeric nanoparticles [35], porous scaffolds fabricated from poly(lactide-co-glycolide) (PLG) [16] and hydrogel scaffolds fabricated via polydimethylsiloxane (PDMS) templates [33]. Cell-encapsulated hydrogels with 3D structures provide a powerful tool to create the cellular microenvironment for in vitro studies. In the context of 3D microenvironment, hydrogels are one of the tools that are increasingly used as biomaterials for cell biology, tissue engineering, and drug delivery applications [38]. Poly(ethylene glycol) (PEG)-based hydrogels play a significant role in microwell fabrication because of their bioinertness, hydrophilicity, low-cost, and rapid microfabrication [39], [40]. Stimuli-responsive PEG can, in the presence of a chemical initiating agent, be photocrosslinked and potentially used in cell patterning and encapsulation [41]–[44].
In this paper, we focus on the design of a novel 3D platform to better control cultured U87-MG Glioblastoma (GBM) cells in Poly(ethylene glycol) dimethyl acrylate (PEGDA) microwells over 21 days to make the GBM spheres more realistic. We assess how the microwell size and coating affected the acini formation, and the growth kinetics of the sphere size and shape in the microwells. We measure the cell viability using Live/Dead assays and quantified the cell spheroid sizes as a function of the concentration of fluorescence intensity over time. Compared to the well-plates based models [36] and PDMS (polydimethylsiloxane) templates [33], our proposed platform allows us to design different size and shape microwells using photo-polymerization technology and adjustable photomasks, while also being cost-effective. Also, compared to scaffold and matrix hydrogels based methods [16], [33], [37] our PEG-based hydrogel platform, provides a cell-repellent microenvironment which allows unconstrained growth into 3D spheroids [45].
II. Materials and Methods
A. Materials
Poly(ethylene glycol) dimethyl acrylate (PEGDA) (MW 750 Da), 3-(Trimethoxysilyl)propyl methacrylate 98% (TMSPMA), 2-hydroxy-2-methyl propiophenone photoinitiator (PI) were purchased from Sigma-Aldrich Chemical Company (St. Louis, MO). For cell culture, U-87 MG Human Glioblastoma (GBM) cell line was purchased from American Type Culture Collection (ATCC). Dulbecco’s modified Eagle’s medium (DMEM), phosphate buffered saline (PBS), fetal bovine serum (FBS), Calcein AM, ethidium homodimer and 4’, 6-diamidino-2-phenylindole (DAPI) were obtained from Life Technologies (Grand Island, NY). Penicilin and streptomycin antibiotics were purchased from Corning Cellgro (Mediatech, Inc., Manassas, VA).
B. PEGDA Microwell Preparation
The PEGDA-hydrogel-based microwells were fabricated by using the approach shown in Fig. 1. PEGDA was dissolved at 10–80% w/w concentration in PBS and prepared fresh for each experiment. The PI was dissolved in PEGDA solution to have a final working concentration of 0.05% w/v. Solutions were thoroughly mixed before the polymerization. Photo-polymerization was carried out with an Omnicure S2000 (320-500 nm, EXFO, Ontario, Canada) lamp at 100 mW/cm (measured for 365 nm) to yield solid hydrogels.
FIGURE 1.

Schematic of the process for formation of controlled-size GBM cancer spheriods using microwells. The hydrogel of poly(ethylene glycol) dimethyl acrylate (PEGDA) was used as a biomaterial to fabricate 3D microwells due to its biocompatible, hydrophilic, UV-sensitive properties.
We covered the glass cover glasses’ surface with the first layer of PEGDA hydrogel to prevent cellular interaction with the underlying glass substrate. For this first layer of the hydrogel,  of the solution was dropped on the cover glass and exposed UV for 30 s. at a working distance of 6 inches, and then 50 to
  of PEGDA hydrogel was dropped on a new petri dish with spacers. The UV exposed cover glass was turned upside down and left on top of the second drop for the second layer of the hydrogel. The desired patterns were prepared using AutoCAD (Autodesk Inc) and the printed photomasks (purchased from CADart Washington, USA) were placed on the cover glass for UV exposure (Related data was given in Supplementary Table 1). We used photomasks with different sizes i.e.,
  ,
,  , and
, and  and geometries i.e. round and square.
C. Stability Testing of PEGDA on Treated and Untreated Cover Glasses
3-(Trimethoxysilyl)propyl methacrylate 98% (TMSPMA) was used to generate an adhesive surface to PEGDA hydrogels on the cover glass ( mm cover glasses purchased from Corning Incorporated). For the TMSPMA treatment, the cover glasses were placed overnight in a beaker, which was filled with 10% NaOH solution. These treated cover glasses were rinsed under distilled water and then dipped in the 100% reagent alcohol, and left to dry in the fume hood. The cover glasses were ready for use after being baked at 80 °C for 1 hour within aluminum foil.
A series of concentrations of PEGDA hydrogels, i.e., 10%, 20%, 40%, 60% and 80%, were prepared on TMSPMA treated glasses that were prepared as previously described (Fig. 1). The same samples of PEGDA hydrogels were fabricated on the untreated cover glasses as a control group. These PEGDA hydrogels were immersed in PBS and kept in the incubator for 21 days. These samples were observed daily under microscopy (Olympus, IX51). A cover glass was marked “unstable” when any part of the PEGDA hydrogel was detached from the cover glass’s surface.
D. Optimization of U87 Cells’ Seeding Concentration
The U87 cells were cultured in cell culture medium consisting of DMEM supplemented with 10% (v/v) FBS, 100 U/ml penicillin and  /ml streptomycin. All cells were manipulated under sterile tissue culture hoods and maintained in a 95% air-5% CO2 humidified incubator at 37 °C. The U87 cells were plated at a concentration of
  cells/ml (10 ml total volume) in 100 mm diameter tissue culture dishes and were passaged every 3 days at a subculture ratio of 1:4. After trypsinization and centrifugation, the U87 cells were collected and then suspended in PEGDA precursor solution at five different concentrations,
  cells/ml,
  cells/ml,
  cells/ml,
  cells/ml and
  cells/ml.
E. Culturing of U87 Cell in the PEGDA Microwells
Initial cell concentration was calculated using a hemacytometer (Hausser Scientific, 1483). The cell suspensions were diluted with the cell medium to prepare the exact concentrations ( cells/ml) and seeded on a microwell. The cells were cultured in the microwells for 21 days; media was changed every 2-3 days. The cells were imaged under fluorescence microscope.
F. Cell Viability
Live/Dead Cell Viability Assay Kit was performed to measure the U87 cell viability in the microwells. The Live/Dead kit containing calcein AM ( /ml, in PBS) and ethidium homodimer (
 /ml in PBS) reagents was prepared as per manufacturer’s instructions. Cells in the hydrogel were incubated with Live/Dead solution for 30 min and the images were captured. Green fluorescence was measured because of the calcein AM reaction from viable cells and damaged cell membranes stained red because of their reaction with ethidium homodimer. The cell aggregates and microwells were monitored for 21 days using an Olympus fluorescence microscope. The fluorescence intensity was quantified using ImageJ (National Institutes of Health). The green and the red fluorescence images from viable and non-viable cells, respectively, were merged to one image and the intensity was evaluated using ImageJ. Four images from each individual microwell were taken to count the fluorescence intensity. Each image was first thresholded, segmented to identify individual spheroid, and measured to calculate fluorescence intensity.
G. Statistical Analysis
Data were compared using one-way and two-way analysis of variance (ANOVA) followed by Tukey’s post-hoc comparisons for repeated measures. A statistical significance threshold was set at 0.05 for all tests (with  ). Error bars in the figures represent mean ± standard deviation.
III. Results and Discussion
A. PEGDA Microwell Arrays’ Stability
The fabricated microwells were tested for stability before culturing the cells for 21 days. The PEGDA microwells’ stability was affected because of different conditions, such as the surface modifications (TMSPMA treated and untreated cover glass surfaces), molecular weight (750 and 1000 Da.), and hydrogel’s compositions (PEGDA and PI’s concentrations). We first tested PEGDA-750 and PEGDA-1000 on both TMSPMA treated and untreated cover glasses. Fig. 2(A) and (B) indicated both TMSPMA-treated cover glasses were more stable compared to the non-treated ones regardless of PEGDA’s molecular weight. Only 7% of both PEGDA-750 and PEGDA-1000 hydrogels remained stable during 21 days in the untreated cover glass.
FIGURE 2.
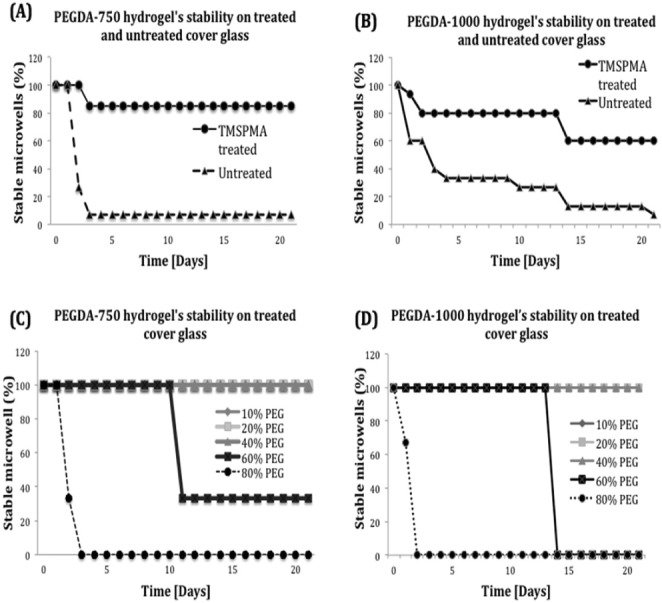
Stability of PEGDA hydrogel on treated and untreated cover glasses. (A and B) Percentage of stable microwells prepared by PEGDA-750 and PEGDA-1000 on TMSPMA treated and untreated cover glasses. The results showed that TMSPMA-treated cover glasses leaded to stable hydrogel attachment comparing to untreated cover glasses. (C and D) Different concentration (10% to 80%) of PEGDA-750 and PEGDA-1000 were prepared and applied on the TMSPMA- treated cover glasses.
We tested a series of concentrations of PEGDA hydrogel, i.e., 10%, 20%, 40%, 60% and 80% of both PEGDA-750 and 1000 to evaluate the influence of hydrogel’s composition. All these PEGDA hydrogels were prepared based on the previous stability testing on TMSPMA-treated cover glasses. All of the hydrogels with a concentration of 80% PEGDA-750 were detached at Day 2 and 60% PEGDA-750 were detached at Day 11. However, 10%, 20% and 40% PEGDA-750 still remained stable for 21 days (shown in Fig. 2 (C)). Similarly, the hydrogels prepared with a concentration of 80% PEGDA-1000 detached after 2 days while 60% remained stable for 14 days. In contrast, 10%, 20% and 40% PEGDA-1000 were still stable for 21 days as shown in Fig. 2(D). These experiments suggested that using PEGDA-750 or PEGDA-1000 for hydrogel-based microwell formation showe
To further optimize the PEGDA-750 hydrogel’s concentration, we then compared the fidelity of fabricated microwells under concentrations of 10%, 20% and 40% PEGDA-750 (Supplementary Table S1). To conclude, for a photomask with a different size, shorter or longer exposure times can result in under-crosslinked or overcrosslinked hydrogels. Our results indicated that for 10%, 20% and 40% of PEGDA-750, the optimal UV exposure times were 85, 55 and 12 seconds respectively, to achieve the fidelity of  microwells; 110, 75 and 20 seconds to get the fidelity of
  microwells, respectively and finally 140, 95 and 32 seconds were enough to achieve the fidelity of
  microwells. The UV exposure time for microwell formation can be changed according to PEGDA-750 concentration. However, we used less UV exposure because of time cost and fabrication efficiency. Thus, 40% PEGDA-750 conditions that yielded accurate polymerization time were used for the further experiments.
B. Cell Seeding Concentrations
Cell seeding concentration plays an important role in controlling the cell spheroids’ size. To inspect proper and efficient cell seeding densities, we assessed a large range of cell concentrations of U87 cells, i.e.,  cells/ml,
  cells/ml,
  cells/ml,
  cells/ml and
  cells/ml in different microwell sizes as 200
  , 400
, 400  , 600
, 600  as shown in Fig. 3 (A-C). In 200
  microwells, we initially started with cell concentrations of
  cells/ml and
  cells/ml, and observed that the microwells were overfilled with cells under both cells concentrations (Fig. 3D, columns 4 and 5). Thus, we tried concentration of
  cells/ml, there was still excessive amount of cells in the microwells for long term cell culturing (Fig. 3D, row 3). At a concentration of
  cells/ml, cell density was only
  cells/mm
 which was low for the quick formation of cell spheroids. For a cell concentration of
  cells/ml, approximately 20, 60 and 88 cells were seeded in
  ,
,  ,
,  microwells, respectively (shown in Fig. 3A-C, and E). Fig. 3E shows that seeding different cell concentrations could control the cell density in the microwells. As shown in Fig. 3, cell concentration of
  cells/ml generated a cell seeding density of 15 cells/mm
 , which allows the formation of proper sized U87 spheroids in 200
  , 400
, 400  , 600
, 600  microwells during 3 weeks culture. The cell densities in microwells were significantly different between the five seeding concentrations (
 ,
,  and
and  for 200
  ,
,  and
and  respectively, after wash; sample size
  ). Thus, the concentration of
  cells/ml was hereafter used for the following experiments.
FIGURE 3.

Quantification of the seeding density of initial U-87 cells into the microwells. (A-C) The seeding concentrations of initial cells were optimized. The cells were seeded and the images were taken before and after wash with PBS. The number of the cells in the microwells was counted. (D) The representative bright field images of cells in the round and square microwells with the size of  . Images showed that
  cells/ml leads to the optimal formation of cancer spheriods over 3 weeks in culture. Scale bars represent
  . (E) Graphical representation of U87 cell density versus cell concentration in solution. Cells in the PEGDA microwells counted for calculating the cell density. Error bars represent standard error of the mean.
C. Cell Culture and U87 Cancer Spheroids Formation
We performed the long-term cell culture up to 21 days and the evolution of spheroids was monitored daily using the fluorescence microscope to track the growth and formation of U87 cancer spheroids. Fig. 4 presents the formation of the in vitro 3D human GBM spheroid in microwells over 21 days. The seeded U87 cells started to migrate and aggregate after 1-2 days cell culture. The cells then proliferated and grew within the PEGDA microwells during the following days, and finally formed U87 cancer spheroids. We used  , 400
, 400  , and
, and  round and square microwells and noticed that the PEGDA microwells’ microenvironment determined the U87 cancer spheroids’ formation in the microwells. Cell-repellant microwells failed to curb cell formation and growth. Cells were distinguished starting from the first day of cell culture (shown in Fig. 4).
FIGURE 4.

Time course of GBM cells within PEGDA-750 microwells of different sizes. Each row is a specific microwell size ( round and square,
  round and square and
  round and square) and each column is a different time point (Day1, 4, 7, 14 and 21) Bright field images of the U87 cancer cells cultured in PEGDA-750 microwells for 21 days were taken. The U87 cells’ aggregation, proliferation and spheroids’ formation from day 0 to day 21 were observed over a period of 21 days. The size of the microwell affected the U87 cancer spheroids’ formation in the microwells. The more the size of the microwell is smaller, the more the cells get in the microwells and connect with each other easily.
After 4 days, U87 cells formed clusters, composed of 15–20 cells on average and continued growing in the microwells. However, because of the dimension of the different-sized microwells, the cells’ aggregation rates varied even under the same seeding concentration. The cancer spheroids started forming in  microwells after culturing for 1 week. After 2 weeks of culture, cell spheroids matched the microwells’ size and shape. In
  microwells, cell spheroids with a diameter of
  , after 14 days of culture, were observed. In
  microwells, the development of the cell spheroids with a diameter of 550
  was also observed at Day 14. The analysis of aggregates grown in PEGDA-750 platform revealed a faster formation of U87 cancer spheroids in
  and
and  microwells compared to
  under the same seeding concentration at Day 21. A broad range of cell spheroid’s diameter distributions were obtained depending on the diameters of the microwells. These results showed the disparate cancer development because of the microenvironments such as the microwells’ size.
Fig. 5 summarizes the cellular growth of U87 cells in the microwells during the formation of cancer spheroids. The U87 cell cultures were stained using the Live/dead kit at Day 1, 4, 7, 14, and 21. The fluorescence intensities were quantified using ImageJ (National Institutes of Health). Each data point is an average of 8 samples taken over a period of 21 days. We initially observed a slow growth rate on the first week after seeding. Two-way ANOVA statistical analysis indicated there was no significant differences between the three different microwell sizes ( ,
,  and 600
  over days 1 to 7), p > 0.1 (Fig. 5A).
FIGURE 5.

Cellular growth of GBM spheroids over a period of 21 days in the different size of microwells. The cell growth was affected by the size and the shape of the microwell. ( denotes
  denotes
  .
.
These results support our hypothesis that cancer spheroids initially develop without spatial constraints (as observed also in Fig. 4). The spheroids showed significant growth after the first week. On Day 21, we observe a decrease on cellular growth in the case of the  microwells. We hypothesize that the small size of the microwell caused space and nutrients deficiency, which may explain the dearth of viable cells observed in these microwells. One-way ANOVA analysis shows that there is no significant change between day 14 and day 21 in the case of
  microwells (
 ). A significant increase in the spheroids’ size in
  and
and  microwells was observed between day 14 and day 21 (
 0.05 and
  0.01 respectively), as the microwells’ dimensions did not induce any growth restraints (as can be observed also from Fig. 4). We conclude that the microwell’s size affected the cell growth, as this can be a restraining factor in the case of smaller microwells. This is supported also by the one-way ANOVA analysis, which indicates a significant difference (
 ) between the spheroid sizes for the 200
  ,
,  and
and  microwells at day 21.
D. U87 Cancer Spheroids’ Characteristics
To characterize U87 spheroids, we took 3D side view images of the formed U87 spheroids in microwells as shown in Fig. 6. Side view images confirmed that GBM cells adapted to the microwells’ dimensions regardless of microwell diameter. Although the growth was slightly slow during the first 7 days of culture (Fig. 5), after 21 days of culture, the bright field and fluorescent images demonstrated that GBMs spheroids lacked space in the  microwell (Fig. 6A). However
  and
and  microwells provided more space for the spheroids’ growth as confirmed in Figs. 5 and 6 (Fig. 6B-C). The top view of the spheroids (Fig. 6D) confirmed that the GBM cells are viable for 3 weeks and the shape of the spheroids can be controlled as well as their size. This figure suggested that in vitro 3D spheroids were successfully constructed in the PEGDA microwells. Culturing the cells in different microwell shapes will enable us to control the spheroid’s shape in the 3D cell culture.
FIGURE 6.

GBM aggregates in PEGDA-750 microwells. Bright field and fluorescent images after applying Live/dead assay to GBM cells. Side view images of the aggregates in  (A-1, 2)
 m (B-1, 2) and
  (C-1, 2) microwells on Day 21. Significant aggregations with controlled sizes were observed. Cells formed 3D spheroids with diameters closely corresponding to the respective microwells. Scale bars correspond to
  . (D) Aggregates grown in different shape microwells on day 21; PEGDA-750 microwells confirmed that the GBM cells are viable for 3 weeks and the shape of the spheroids can be controlled as well as their size.
IV. Conclusion
We developed an optimized poly(ethylene glycol) dimethyl acrylate (PEGDA) hydrogel-based microwell platform. We used the PEGDA microwells’ cell-repellant properties to control the development of cultured U87 cells, and finally generate a 3D GBM model. A series of microwells with different sizes ( to
to  ) and shapes (squares, rounds, triangles) were fabricated by photolithography. Long-term culture experiment successfully shows the controlled development of the GBMs spheroids in the microwells. The generated spheroids’ viability was quantitatively evaluated using live/dead assay and shown to improve over 21 days. The cell spheroids’ shape and thickness were observed by fluorescence microscopy.
Thus, we demonstrated that uniform GBM spheroids formed in 3D, and the size of these GBM spheroids depended on the size of microwells. The preliminary data indicated that our PEGDA microwell platform is robust and reproducible. We believe that this in vitro platform is an ideal building unit for 3D GBM spheroid formation and will serve as a reliable in vitro model that may reduce the need for in vivo studies in terms of time for the preclinical brain tumor growth studies.
V. Future Studies
Our ultimate goal is to provide a novel in vitro platform for longitudinal cancer studies with support for selective suppression of tumor growth and angiogenesis. We plan to treat the 3D GBM spheres with highly-specific cancer treatment based on aptamer and nanoparticle assemblies, conjugated with molecular profiling of targeted cellular pathways. We will quantify and compare the morphological changes on GBM spheres in response to the anti-angiogenic effect of the delivered treatment. Additionally we will investigate the effect of the treatment on endothelial and cancer cells signaling pathways using gene expression profiling.
We also plan to build computational models of dynamic regulatory networks during GBM progression. Using temporal gene expression profiles collected at several GBM tumor developmental stages, network-based modeling will be developed to identify and study risk pathways involved in tumor progression.
The replication of tumor microenvironments could replace in vivo animal studies and shorten the time of study and bypass the lack of the suitable animal for the in vivo applications such as drug discovery. We believe that this novel translational approach will be beneficial for many applications, including stem cells, cell biology, drug discovery, and high-throughput screening. Furthermore, it will pave the way for truly “personalized” cancer intervention.
Biographies

Yantao Fan received the Ph.D. degree in biology. He currently holds a post-doctoral position with the University of Houston. His research interests are in 3-D nano/microtechnologies, cutting-edge point of care methods, and translational research.

Naze G. Avci received the M.Sc. degree in bioengineering from Marmara University, Istanbul, Turkey. She is currently pursuing the Ph.D. degree with the Department of Biomedical Engineering, University of Houston, Houston. Her research interest is to investigate the application of hydrogel microwells for in vitro 3-D size-controlled glioblastoma (GBM) spheres formation and the treatment of GBM spheres with adenoviruses.

Duong T. Nguyen received the master’s degree from The University of Tokyo. He is currently pursuing the Ph.D. degree with the Department of Biomedical Engineering, University of Houston. His research interest is in the areas of drug delivery system, 3-D cell culture, and diagnostics.

Andrei Dragomir received the B.S. degree in electrical engineering from Politehnica University, Bucharest, Romania, in 1999, and the M.S. and Ph.D. degrees in biomedical engineering from the University of Patras, Greece, in 2002 and 2006, respectively. He joined the Harrington Department of Bioengineering, Arizona State University, as a Post-Doctoral Researcher, in 2006. He is currently an Instructional and Research Assistant Professor with the Department of Biomedical Engineering, Cullen College of Engineering, University of Houston. His research interests are in the areas of biosignal processing, pattern recognition, machine learning, and complex networks modeling.

Yasemin M. Akay received the B.S. degree in pharmaceutical sciences from Hacettepe University, Ankara, Turkey, in 1980, and the M.S. and Ph.D. degrees in biomedical engineering from Rutgers University, Piscataway, NJ, USA, in 1991 and 1998, respectively. She was a Post-Doctoral Fellow with the Physiology Department and the Pharmacology Department, Dartmouth Medical School, and the Department of Physiology and Biophysics, School of Medicine, Boston University. She is currently an Instructional and Research Assistant Professor with the Department of Biomedical Engineering, Cullen College of Engineering, University of Houston. Her current research interests include molecular neuroengineering, neural growth, and neurodegeneration. She was an Assistant Editor of the IEEE Book Series from 2001 to 2004, and has been the Managing Editor of the Wiley Encyclopedia of Biomedical Engineering since 2004.

Feng Xu received the B.S. and M.S. degrees in mechanical engineering from Xi’an Jiaotong University, in 2001 and 2004, respectively, and the Ph.D. degree in engineering from Cambridge University, in 2008. From 2008 to 2011, he was a Research Fellow with the Harvard Medical School and Harvard-MIT Health Science and Technology. He is currently a Full Professor with Xi’an Jiaotong University. His current research aims in advancing human health through academic excellence in education and research that integrates engineering, science biology, and medicine with a focus on biothermomechanics, engineering of cell microenvironment, and point-of-care technologies.

Metin Akay received the B.S. and M.S. degrees in electrical engineering from Bogazici University, Istanbul, Turkey, in 1981 and 1984, respectively, and the Ph.D. degree from Rutgers University, in 1990. He has played a key role in promoting the biomedical education in the world by writing several prestigious books and editing the Biomedical Engineering Book Series (Wiley and IEEE Press). He has authored, co-authored and edited 14 books and given more than 50 keynote, plenary, and invited talks at the international meetings, including the first, second, and third Latin-American Conference on Biomedical Engineering in 1998, 2001, and 2004. He is the Founding Chair of the Annual International Summer School on Biocomplexity from System to Gene sponsored by NSF and Dartmouth College, and technically co-sponsored by the IEEE EMBS of the Satellite Conference on Emerging Technologies in Biomedical Engineering. He is also the Founding Chair of the International IEEE Conference on Neural Engineering in 2003. These activities were sponsored by NSF, and largely attended by the women and minorities.
Funding Statement
This work was supported by the University of Houston, Houston, TX, USA.
References
- [1].Chen J., McKay R. M., and Parada L. F., “Malignant glioma: Lessons from genomics, mouse models, and stem cells,” Cell, vol. 149, no. , pp. 36–47, 2012. [DOI] [PMC free article] [PubMed] [Google Scholar]
- [2].Wen P. Y. and Kesari S., “Malignant gliomas in adults,” New England J. Med., vol. 359, no. 5, pp. 492–507, 2008. [DOI] [PubMed] [Google Scholar]
- [3].Gabrusiewicz K., et al. , “Anti-vascular endothelial growth factor therapy-induced glioma invasion is associated with accumulation of Tie2-expressing monocytes,” Oncotarget, vol. 5, no. 8, pp. 2208–2220, 2014. [DOI] [PMC free article] [PubMed] [Google Scholar]
- [4].Brandes A. A., “State-of-the-art treatment of high-grade brain tumors,” Seminars Oncol., vol. 30, pp. 4–9, Dec. 2003. [DOI] [PubMed] [Google Scholar]
- [5].Walker M. D., et al. , “Randomized comparisons of radiotherapy and nitrosoureas for the treatment of malignant glioma after surgery,” New England J. Med., vol. 303, no. 23, pp. 1323–1329, 1980. [DOI] [PubMed] [Google Scholar]
- [6].Grossman S. A. and Batara J. F., “Current management of glioblastoma multiforme,” Seminars Oncol., vol. 31, no. 5, pp. 635–644, 2004. [DOI] [PubMed] [Google Scholar]
- [7].DeAngelis L. M., “Chemotherapy for brain tumors—A new beginning,” New England J. Med., vol. 352, no. 10, pp. 1036–1038, 2005. [DOI] [PubMed] [Google Scholar]
- [8].Mao H., LeBrun D. G., Yang J., Zhu V. F., and Li M., “Deregulated signaling pathways in glioblastoma multiforme: Molecular mechanisms and therapeutic targets,” Cancer Invest., vol. 30, no. 1, pp. 48–56, 2012. [DOI] [PMC free article] [PubMed] [Google Scholar]
- [9].Ramirez Y. P., Weatherbee J. L., Wheelhouse R. T., and Ross A. H., “Glioblastoma multiforme therapy and mechanisms of resistance,” Pharmaceuticals, vol. 6, no. 12, pp. 1475–1506, 2013. [DOI] [PMC free article] [PubMed] [Google Scholar]
- [10].Perry J., Okamoto M., Guiou M., Shirai K., Erret A., and Chakravarti A., “Novel therapies in glioblastoma,” Neurol. Res. Int., vol. 2012, Dec. 2011, Art. ID 428565. [DOI] [PMC free article] [PubMed] [Google Scholar]
- [11].Facchino S., Abdouh M., and Bernier G., “Brain cancer stem cells: Current status on glioblastoma multiforme,” Cancers, vol. 3, no. 2, pp. 1777–1797, 2011. [DOI] [PMC free article] [PubMed] [Google Scholar]
- [12].Celli J. P., Rizvi I., Evans C. L., Abu-Yousif A., and Hasan T., “Three-dimensional ovarian cancer models: Imaging and therapeutic combinations,” Proc. SPIE, Opt. Methods Tumor Treatment Detection, Mech. Techn. Photodyn. Therapy XIX, vol. 7551, p. 75510I, Feb. 2010, doi: 10.1117/12.843279. [DOI] [Google Scholar]
- [13].Kunz-Schughart L. A., “Multicellular tumor spheroids: Intermediates between monolayer culture and in vivo tumor,” Cell Biol. Int., vol. 23, no. 3, pp. 157–161, 1999. [DOI] [PubMed] [Google Scholar]
- [14].Mayer B., et al. , “Multicellular gastric cancer spheroids recapitulate growth pattern and differentiation phenotype of human gastric carcinomas,” Gastroenterology, vol. 121, no. 4, pp. 839–852, 2001. [DOI] [PubMed] [Google Scholar]
- [15].Yamada K. M. and Cukierman E., “Modeling tissue morphogenesis and cancer in 3D,” Cell, vol. 130, no. 4, pp. 601–610, 2007. [DOI] [PubMed] [Google Scholar]
- [16].Fischbach C., et al. , “Engineering tumors with 3D scaffolds,” Nature Methods, vol. 4, no. 10, pp. 855–860, 2007. [DOI] [PubMed] [Google Scholar]
- [17].Debnath J. and Brugge J. S., “Modelling glandular epithelial cancers in three-dimensional cultures,” Nature Rev. Cancer, vol. 5, no. 9, pp. 675–688, 2005. [DOI] [PubMed] [Google Scholar]
- [18].Fiebig H. H., Maier A., and Burger A. M., “Clonogenic assay with established human tumour xenografts: Correlation of in vitro to in vivo activity as a basis for anticancer drug discovery,” Eur. J. Cancer, vol. 40, no. 6, pp. 802–820, 2004. [DOI] [PubMed] [Google Scholar]
- [19].Cukierman E., Pankov R., Stevens D. R., and Yamada K. M., “Taking cell-matrix adhesions to the third dimension,” Science, vol. 294, no. 5547, pp. 1708–1712, 2001. [DOI] [PubMed] [Google Scholar]
- [20].Ghosh S., et al. , “Three-dimensional culture of melanoma cells profoundly affects gene expression profile: A high density oligonucleotide array study,” J. Cellular Physiol., vol. 204, no. 2, pp. 522–531, 2005. [DOI] [PubMed] [Google Scholar]
- [21].Hanahan D. and Weinberg R. A., “The hallmarks of cancer,” Cell, vol. 100, no. 1, pp. 57–70, 2000. [DOI] [PubMed] [Google Scholar]
- [22].Harris A. L., “Hypoxia—A key regulatory factor in tumour growth,” Nature Rev. Cancer, vol. 2, no. 1, pp. 38–47, 2002. [DOI] [PubMed] [Google Scholar]
- [23].Pickl M. and Ries C. H., “Comparison of 3D and 2D tumor models reveals enhanced HER2 activation in 3D associated with an increased response to trastuzumab,” Oncogene, vol. 28, no. 3, pp. 461–468, 2009. [DOI] [PubMed] [Google Scholar]
- [24].Kenny H. A., Krausz T., Yamada S. D., and Lengyel E., “Use of a novel 3D culture model to elucidate the role of mesothelial cells, fibroblasts and extra-cellular matrices on adhesion and invasion of ovarian cancer cells to the omentum,” Int. J. Cancer, vol. 121, no. 7, pp. 1463–1472, 2007. [DOI] [PubMed] [Google Scholar]
- [25].Miralem T., Steinberg R., Price D., and Avraham H., “VEGF165 requires extracellular matrix components to induce mitogenic effects and migratory response in breast cancer cells,” Oncogene, vol. 20, no. 39, pp. 5511–5524, 2010. [DOI] [PubMed] [Google Scholar]
- [26].Debnath J., Mills K. R., Collins N. L., Reginato M. J., Muthuswamy S. K., and Brugge J. S., “The role of apoptosis in creating and maintaining luminal space within normal and oncogene-expressing mammary acini,” Cell, vol. 111, no. 1, pp. 29–40, 2002. [DOI] [PubMed] [Google Scholar]
- [27].Beningo K. A., Dembo M., and Wang Y.-L., “Responses of fibroblasts to anchorage of dorsal extracellular matrix receptors,” Proc. Nat. Acad. Sci. United States Amer., vol. 101, no. 52, pp. 18024–18029, 2004. [DOI] [PMC free article] [PubMed] [Google Scholar]
- [28].Zietarska M., et al. , “Molecular description of a 3D in vitro model for the study of epithelial ovarian cancer (EOC),” Molecular Carcinogenesis, vol. 46, no. 10, pp. 872–885, 2007. [DOI] [PubMed] [Google Scholar]
- [29].Sutherland R. M., “Cell and environment interactions in tumor microregions: The multicell spheroid model,” Science, vol. 240, no. 4849, pp. 177–184, 1988. [DOI] [PubMed] [Google Scholar]
- [30].Haycock J. W., “3D cell culture: A review of current approaches and techniques,” in 3D Cell Culture (Methods in Molecular Biology), vol. 695 New York, NY, USA: Humana Press, 2011, pp. 1–15. [DOI] [PubMed] [Google Scholar]
- [31].Goodman T. T., Ng C. P., and Pun S. H., “3-D tissue culture systems for the evaluation and optimization of nanoparticle-based drug carriers,” Bioconjugate Chem., vol. 19, no. 10, pp. 1951–1959, 2008. [DOI] [PMC free article] [PubMed] [Google Scholar]
- [32].Stratmann A. T., Dandekar G., and Nietzer S. L., “Three-dimensional in vitro tumor models as an alternative for animal models in preclinical studies,” Pharmazeutische Ind., vol. 75, no. 3, pp. 485–489, 2013. [Google Scholar]
- [33].Shin C. S., Kwak B., Han B., and Park K., “Development of an in vitro 3D tumor model to study therapeutic efficiency of an anticancer drug,” Molecular Pharmaceutics, vol. 10, no. 6, pp. 2167–2175, 2013. [DOI] [PMC free article] [PubMed] [Google Scholar]
- [34].Dolznig H., et al. , “Modeling colon adenocarcinomas in vitro: A 3D co-culture system induces cancer-relevant pathways upon tumor cell and stromal fibroblast interaction,” Amer. J. Pathol., vol. 179, no. 1, pp. 487–501, 2011. [DOI] [PMC free article] [PubMed] [Google Scholar]
- [35].Horning J. L., et al. , “3-D tumor model for in vitro evaluation of anticancer drugs,” Molecular Pharmaceutics, vol. 5, no. 5, pp. 849–862, 2008xs. [DOI] [PubMed] [Google Scholar]
- [36].Vinci M., et al. , “Advances in establishment and analysis of three-dimensional tumor spheroid-based functional assays for target validation and drug evaluation,” BMC Biol., vol. 10, p. Mar. 29, 2012. [DOI] [PMC free article] [PubMed] [Google Scholar]
- [37].Lee M.-Y., Kumar R. A., Sukumaran S. M., Hogg M. G., Clark D. S., and Dordick J. D., “Three-dimensional cellular microarray for high-throughput toxicology assays,” Proc. Nat. Acad. Sci. United States Amer., vol. 105, no. 1, pp. 59–63, 2008. [DOI] [PMC free article] [PubMed] [Google Scholar]
- [38].Gurski L. A., Jha A. K., Zhang C., Jia X., and Farach-Carson M. C., “Hyaluronic acid-based hydrogels as 3D matrices for in vitro evaluation of chemotherapeutic drugs using poorly adherent prostate cancer cells,” Biomaterials, vol. 30, no. 30, pp. 6076–6085, 2009. [DOI] [PMC free article] [PubMed] [Google Scholar]
- [39].Peppas N. A., Hilt J. Z., Khademhosseini A., and Langer R., “Hydrogels in biology and medicine: From molecular principles to bionanotechnology,” Adv. Mater., vol. 18, no. 11, pp. 1345–1360, 2006. [Google Scholar]
- [40].Kirschnera C. M. and Anseth K. S., “Hydrogels in healthcare: From static to dynamic material microenvironments,” Acta Mater., vol. 61, no. 3, pp. 931–944, 2013. [DOI] [PMC free article] [PubMed] [Google Scholar]
- [41].Khademhosseini A., et al. , “Micromolding of photocrosslinkable hyaluronic acid for cell encapsulation and entrapment,” J. Biomed. Mater. Res. A, vol. 79A, no. 3, pp. 522–532, 2006. [DOI] [PubMed] [Google Scholar]
- [42].Hahn M. S., Miller J. S., and West J. L., “Three-dimensional biochemical and biomechanical patterning of hydrogels for guiding cell behavior,” Adv. Mater., vol. 18, no. 20, pp. 2679–2684, 2006. [Google Scholar]
- [43].Chan V., Zorlutuna P., Jeong J. H., Kong H., and Bashir R., “Three-dimensional photopatterning of hydrogels using stereolithography for long-term cell encapsulation,” Lab Chip, vol. 10, no. 16, pp. 2062–2070, 2010. [DOI] [PubMed] [Google Scholar]
- [44].Yanagawa F., et al. , “Directed assembly of cell-laden microgels for building porous three-dimensional tissue constructs,” J. Biomed. Mater. Res. A, vol. 97A, no. 1, pp. 93–102, 2011. [DOI] [PMC free article] [PubMed] [Google Scholar]
- [45].Hirschhaeuser F., Menne H., Dittfeld C., West J., Mueller-Klieser W., and Kunz-Schughart L. A., “Multicellular tumor spheroids: An underestimated tool is catching up again,” J. Biotechnol., vol. 148, no. 1, pp. 3–15, 2010. [DOI] [PubMed] [Google Scholar]