Abstract
Cameras embedded in consumer devices have previously been used as physiological information sensors. The waveform of the photoplethysmographic image (PPGi) signals may be significantly affected by the light spectra and intensity. The purpose of this paper is to evaluate the performance of PPGi waveform acquisition in the red, green, and blue channels using a commercial camera in different light conditions. The system, developed for this paper, comprises of a commercial camera and light sources with varied spectra and intensities. Signals were acquired from the fingertips of 12 healthy subjects. Extensive experiments, using different wavelength lights and white light with variation light intensities, respectively, reported in this paper, showed that almost all light spectra can acquire acceptable pulse rates, but only 470-, 490-, 505-, 590-, 600-, 610-, 625-, and 660-nm wavelength lights showed better performance in PPGi waveform compared with gold standard. With lower light intensity, the light spectra >600 nm still showed better performance. The change in pulse amplitude (ac) and dc amplitude was also investigated with the different light intensity and light spectra. With increasing light intensity, the dc amplitude increased, whereas ac component showed an initial increase followed by a decrease. Most of the subjects achieved their maximum averaging ac output when averaging dc output was in the range from 180 to 220 pixel values (8 b, 255 maximum pixel value). The results suggested that an adaptive solution could be developed to optimize the design of PPGi-based physiological signal acquisition devices in different light conditions.
Keywords: Photoplethysmographic image, low-cost camera, light spectrum, light intensity
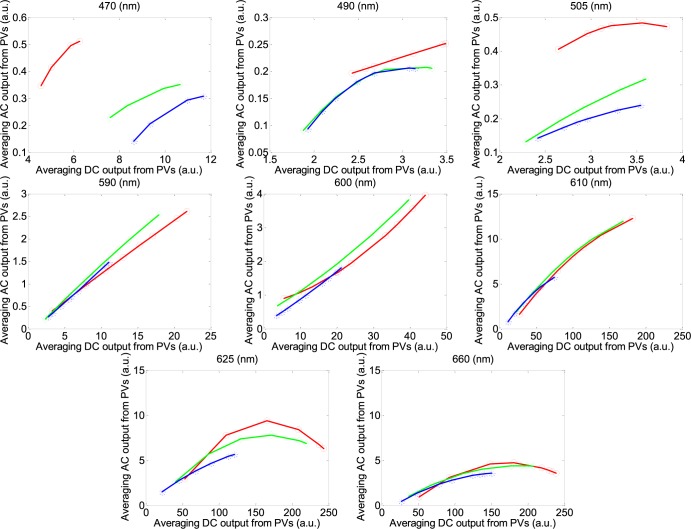
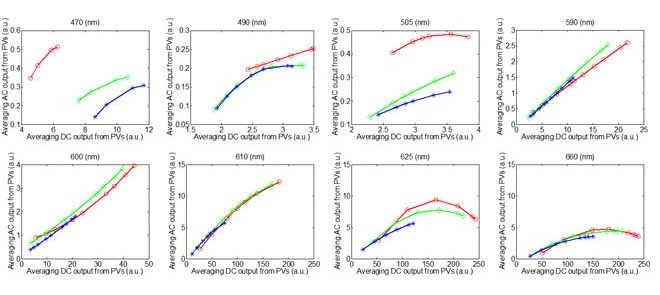
The waveform of the photoplethysmographic image (PPGi) signals may be significantly affected by the light spectra and intensity. The purpose of this study is to evaluate the performance of PPGi aveform acquisition in the red, green and blue channels using a commercial camera in different light conditions. The fitted curve of PPGi amplitudes in the RGB channels with different light intensity for 470 nm, 490 nm, 505 nm, 590 nm, 600 nm, 610 nm, 625 nm, 660 nm wavelengths and white light. X-axes represent averaging DC output form pixels and y-axes represent averaging AC output form pixels. These representative data are from one male, age 30 years old.
I. Introduction
The photoplethysmography (PPG) technology was first introduced in 1930; this has allowed us to monitor several important physiological information, such as blood oxygen saturation (SpO2), heart and respiration rates, cardiac output and assessment autonomic functions [1] in the biomedical and clinical community. The conventional PPG system consists of two components: a light source to light a part of the body and a photo detector to measure small variations in light intensity after interaction with the light part. The interaction of light with biological tissue is complex and it includes the processes of light transmission, reflection, absorption, multiple scattering and fluorescence.
The recently introduced technique called photoplethysmographic imaging (PPGi) overcame above problems using a camera. The pulse rate (PR) detection principle using PPGi is similar to the PPG technology, however, instead of a single photodiode, a two-dimensional image matrix is used. In past years, many literatures regarding PPGi have been introduced. For instance, more recently physiological parameter monitoring via a mobile phone recording has been proposed. For example, Lamonaca et al. [2] dealt with a robust and reliable evaluation of the PR with a smart phone. Moreover, Karlen et al. [3] presented design challenges for camera oximetry on a mobile phone. Each of these instances uses Light-emitting diodes (LEDs) or ambient light as illumination source in reflection mode: this showed its advantages in terms of simplicity and low cost. Region of interest (ROI) was captured by camera and for each image frame the level of light absorption that passes through pulsating capillary tissue was evaluated. The blood volumetric variation changes light absorption allowing the PPG evaluation. Through image processing pipeline and spatial averaging, the red, green and blue (RGB) components were separated. Some research groups have utilized the combination of RGB components and lights with different wavelengths to estimate physiological information. One of the best-known is the estimation of oxygen saturation (SpO2). For instance, Wieringa et al. investigated the contactless multiple wavelength PPGi technology which was a first step toward ‘SpO2 camera’ [4]. Kong et al. used two CCD cameras mounted with different narrow-band filters (i.e., 660 and 520 nm, respectively) [5] and the estimated SpO2 showed a high correlation with a conventional pulse oximetry. Scully et al. [6] presented SpO2 measurements made by comparing PPGi waveforms of the red and the blue bands from a flash light with reflective mode. Tarassenko et al. estimated the respiration rate, heart rate and SpO2 from different RGB bands under ambient light [7].
The body tissues exhibit different absorption coefficient for different wavelength lights. For instance, low wavelength photons (blue and green) have much higher skin absorbance. Oxygenated hemoglobin and deoxygenated hemoglobin have significantly different optical spectra in the wavelength range from 500 to 1000 nm, using CMOS cameras. However, to the best of our knowledge, it has never been reported about the performance of the RGB channels for PPGi signals in different light conditions. A great amount of physiological information is reflected in different light conditions. One of the most famous examples can be found in the use of 660 nm and 940 nm wavelength light as the light source for SpO2 determination [8]. Moreover, Shimizu et al. [9], in contrast to past studies, have shown that the best light source for alcohol intake detection is a green-LED.
In this study, an FPGA-based system with a commercial camera has been developed and PPGi waveform in different light conditions has been evaluated. The fingertip of participant was put on the camera lens. The LEDs described in [10] was attached to a lens of a digital camera as light source and it supplied different light intensities and wavelength lights among visible light spectrum. Light intensity was controlled by Pulse-Width Modulation (PWM) current; as a consequence, light intensity changed linearly. Light reflected from the fingertips skin of twelve healthy subjects was collected into a monochrome CMOS camera for recording the videos. Extensive experiments, using 430nm, 450nm, 470nm, 490nm, 505nm, 525nm, 535nm, 545nm, 570nm, 590nm, 600nm, 610nm, 625nm, 660nm wavelength lights and white light with different light intensities were applied respectively. The PPGi signal performance of the RGB channels in the different light conditions including signal-to-noise ratio (SNR), the change in pulse amplitude (AC) and Direct Current (DC) amplitude was evaluation.
II. Method
A. Image Sensor Module
A simple and inexpensive (<$10) digital camera (OV9715 from OmniVision) was used as an image sensor. OV9715 is a low-voltage and high-performance CMOS WXGA ( pixels) camera that provides full functionality on a single chip. It provides full-frame, sub-sampled, windowed 8-bit/10-bit images in raw RGB format via Digital Video Port (DVP). Furthermore it is capable of operating at up to 30 frames per second (fps) in WXGA resolution with full user control over image quality and formatting and it provides output data transfer. Fig. 1 shows quantum efficiency for colored pixels of RGB CMOS camera sensor from the OV9715.
FIGURE 1.
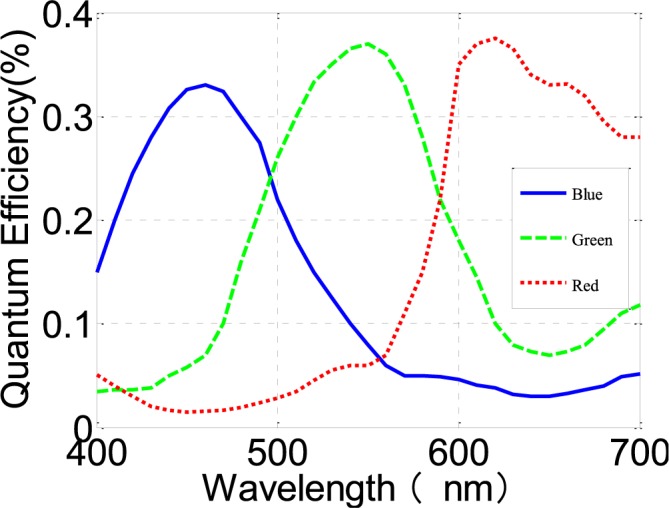
Quantum efficiency for colored pixels of RGB CMOS camera sensor from OV9715. Adapted from OV9715 datasheet.
B. Measurement System
The hardware used for this study is shown in Fig. 2a. The system mainly consists of a FPGA development board (XC6SLX150T-3FGG676 from Xilinx), a commercial camera, an SD card and a touch screen. The camera is connected to the FPGA development board. All features of the camera, including the exposure control, white balance control, defective pixel canceling etc. were configured by commands sent from the development board to the camera through the SCCB interface. By proper adjustments of the camera parameters, clear images were acquired. In the FPGA development board the raw data from the camera was first passed to the video pipeline and then processed to acquire PPGi waveform by the algorithm introduced in section D (Fig. 2b). The processed results were stored in a text file on the SD card. Subsequently this text file was copied to a PC for data analysis.
FIGURE 2.
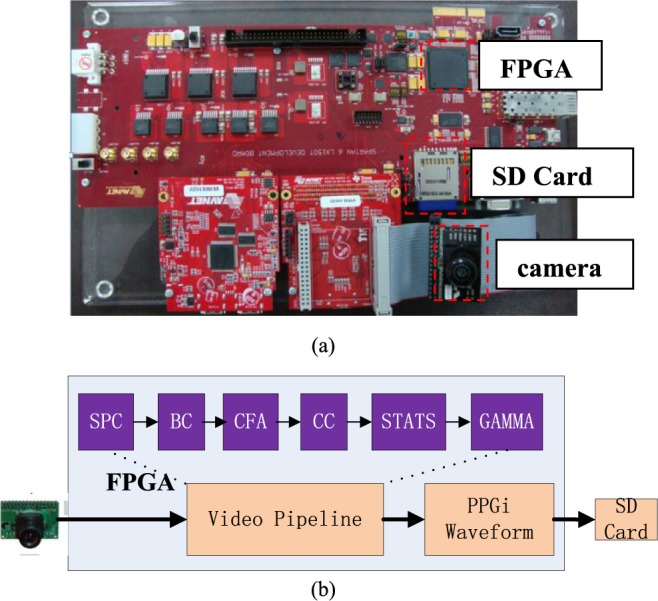
The PR acquisition system based on an FPGA development board. (a) The development board. (b) The block-diagram of the system function, the video pipeline includes: Stuck Pixel Correction (SPC), Brightness Control and Contrast Control (BC), Bayer Conversion (CFA), Color Balance Control (CC), Image Statistics (STATS), and Gamma Correction (GAMMA).
C. Subjects and Experimental Protocol
A total of twelve healthy volunteers (ten males and two females; aged from 24 to 35 with a mean age of 28 years), recruited from the Shenzhen Institutes of Advanced Technology, Chinese Academy of Sciences, were enrolled in this study. Our sample featured participants of both genders, different ages and with varying skin colors (Asians and Africans). For obtaining the PPG signals as reference, an FDA-approved PPG measurement system, TP-TSD200A from BIOPAC was used. The reference PPG signals were acquired at a sampling rate of 1 kHz for validation. Each subject was required to avoid any body movements and to keep normal breathing during image capture. A 30-second image episode was captured.
Various LEDs with narrow band and accurate emission wavelength lights (430 nm, 450 nm, 470 nm, 490 nm, 505 nm, 525 nm, 535 nm, 545 nm, 570 nm, 590 nm, 600 nm, 610 nm, 625 nm and 660 nm) were implemented for fingertip illumination in preliminary experiments. The light intensity of LED was controlled by PWM current. LED attached to a lens of a digital camera was used as light source. The fingertips of participants were put on the camera lens. Light reflected from the skin of the fingertip was collected into a monochrome CMOS camera for recording the videos with  pixel resolution; this was then processed to estimate the amplitude and phase of light-intensity oscillations at the pulse-beat frequency of the subject by using synchronous detection. All experiments were implemented in an optical chamber, using only one wavelength each time. The performance in the white light has also been evaluated. An adjustable linear xenon cold light source (MCL-350X from Xuzhou Pengkang Elec. Equipment Co.) was used for emitting white light with variation light intensity. The temperature of the fingertips also affects PPGi signal [11], so a temperature sensor (TSD202D from BIOPAC) has been used for recording finger temperature recording at the beginning and end of the experiment.
Fig. 3 shows the top view and the side view of the sensing unit layout. Three kinds of experiments were conducted. The cases in which the fingertip is moving or not relatively to the camera lens, were considered. In experiment I, each subject was asked to put his or her index fingertip naturally on the camera lens with consciously contacting force; meanwhile signals were recorded. In experiment II, subjects were instructed to put the index fingertip on the camera lens vertically, irregularly and constantly contacting forces, meanwhile signals were recorded. On the contrary, in experiment III, subjects were required to move the index fingertip on the camera lens horizontally, irregularly and constantly with stable contacting forces, meanwhile signals were recorded.
FIGURE 3.

(a) Top view and (b) side view of the camera.
D. Image Acquisition and Processing
30-second image episodes were recorded by the camera at a frame rate of 30 per second. After this, images were processed in the FPGA by the video pipeline: the pixel values (PVs, 8 bits) for the R, G and B channels were acquired. For each channel the PVs were averaged in time and the corresponding results were called  (t),
(t),  (t), and
  (t) respectively, where t corresponded to the frame period. Recorded videos were processed offline using MATLAB.
In previous paper, spectral analysis in frequency domain such as the Fast Fourier Transform (FFT) [12] was used to acquire the PR. The FFT has been widely used in traditional approaches, because of its simplicity and its ability to provide fundamental physiological information easily and directly. However FFT-use may lead to ambiguous results in time domain, especially in the case in which the subject fingertip moves in the vertical or horizontal directions relatively to the contacting camera lens. Recent PPGi studies have increasingly revealed that a smoothed pseudo Wigner-Ville distribution (SPWVD) approach can provide more reliable physiological assessments [13]–[15], when compared to FFT and other signal processing methods, especially when subjects bend their fingertip or press their fingertip against the sensor. So the SPWVD approach was chosen to estimate the PPGi signals in our study.
 |
Where  and
and  , are the instantaneous auto correlation function, and
  is smoothing window of 2Q-1 length used in time direction while
  is another smoothing window of length 2P-1. A Gaussian and Hamming windows were adopted in this study for both time and frequency smoothing. In this work, the SPWVD of the PPG signals were obtained with custom written software in MATLAB 2011a. PR is calculated by Eq. (2) in beat per minute (bpm) unit, and
  is the maximum peak value of the SPWVD. The nFFT corresponds to the number of the points of the SPWVD. Fs is the value of fps.
 |
The AC signals were obtained from PPGi signals using a band-pass filter (128-point Hamming window, 0.5 to 4 Hz). The PPGi AC signals were acquired offline using MATLAB to detect peak and foot points of PPGi in each PPGi pulse [16]. The DC amplitude was acquired separately by averaging PPGi signal values corresponding to the obtained AC signal.
E. Statistical Analysis
Statistical analysis has been performed using the SPSS software package (version 17.0 from IBM). Bland-Altman plotting [17] was performed to compare PPGi with the gold standard. The mean deviation and standard deviation (SD) of the differences and the mean of the absolute differences and 95% limits of agreement (±1.96 SD) were calculated. The Pearson’s correlation coefficients of waveform were also used as a standard to evaluate performance of the PPGi waveform with gold standard. The analyses were performed with t-test set at 0.05 which was considered statistically significant. The p-values were calculated to estimate the difference in AC component between two interval DC components from twelve health subjects. The measurement error  can be defined as (3).
  was the PR value measured by the gold standard and
  was PR value measured based on the camera. In addition, One-way analysis of variance (ANOVA) (factor = movement condition) was performed to assess differences among PPGi signal acquisition in the two movements and stationary condition in white light.
 |
III. Results
Table 1 gives the systolic (SBP) and diastolic (DBP) blood pressure as well as PR measured at the beginning (first trial) and the end (last trial) of the experiment in the form of mean ± SD. During the experiment, there were no significant changes in PR (p = 0.90), systolic (p =0.93), mean and diastolic (p = 0.88) blood pressure. There was also no significant change in the skin temperature at the measurement site (p = 0.81).
TABLE 1.
Subjects’blood pressure, heart rate and finger temperature recorded at the beginning and at the end of the experiment (n ).
).
A. PR Performance
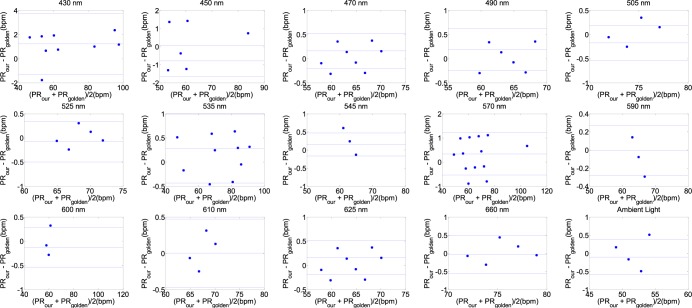
Fig. 4 shows Bland-Altman plot applied from one male, age 30 years old to PR agreement analysis between gold standard and PPGi signal in the G channels under 430nm, 450nm, 470nm, 490nm, 505nm, 525nm, 535nm, 545nm, 570nm, 590nm, 600nm, 610nm, 625nm, 660nm wavelength lights and white light with 90% light intensity, respectively. PR component has the strongest power in PPGi signal in these spectra lights and no significant difference in performance has been found.
FIGURE 4.
Bland-Altman plot is applied to agreement analysis between PPGi and gold standard from the G channels for 430nm, 450nm, 470nm, 490nm, 505nm, 525nm, 535nm, 545nm, 570nm, 590nm, 600nm, 610nm, 625nm, 660nm and white light respectively, which reflect PR measurement. The solid lines are the mean of differences, and the broken lines represent the upper and lower limits of agreement, i.e., +1.96 SD and −1.96 SD, respectively. SD is standard deviation. These representative data are from male, age 30 years old.
B. Correlation Coefficients in the RGB Channels Between the PPGi and Gold Standard
Except the main PR component, clear PPGi signal should include harmonic signals from the steady-state oscillation characteristics of arterial system. Good PPGi signal can show more details in physiological information. Clear PPGi waveform easily distinguishes a systolic peak (peak point), dicrotic notch (reflected wave) and diastolic peak (foot point) which is helpful for physiological information analysis such as pulse transit time [18], [19] and pulse wave velocity [20]. Therefore, the correlation coefficients were calculated. Fig. 5 shows the correlation coefficients for 430nm, 450nm, 470nm, 490nm, 505nm, 525nm, 535nm, 545nm, 570nm, 590nm, 600nm, 610nm, 625nm and 660nm wavelength lights with 90% light intensity and white light in the RGB channels, respectively.
FIGURE 5.
Box-and-whisker plot showing correlation coefficients from the R (a), G (b), B (c) channels for 430nm, 450nm, 470nm, 490nm, 505nm, 525nm, 535nm, 545nm, 570nm, 590nm, 600nm, 610nm, 625nm, 660nm with 90% light intensity and white light respectively. The red cross are drawn as outliers if they are larger than  (q3 - q1) or smaller than q1 – 1.5(q3 - q1), where q1 and q3 are the 25th and 75th percentiles, respectively. These representative signals are from twelve subjects.
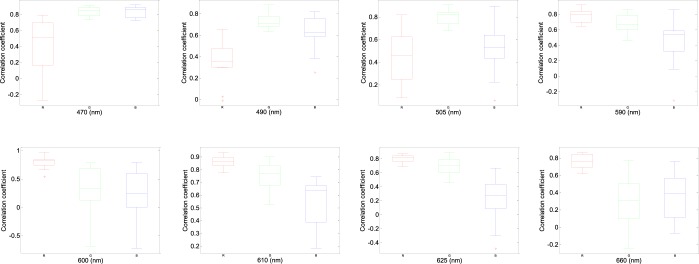
The correlation coefficients 0.8 are empirically selected as threshold standard for a better performance PPGi signal compared with gold standard signal. As shown in the Fig. 5, in 430 nm, 450 nm, 525 nm, 535 nm, 540 nm and 570nm wavelength lights the correlation between PPGi signal in the RGB channels and gold standard signal was very weak; this means that the PR had a high error rate. In 90% LED light intensity, B channel showed the worst correlation in waveform except 470 nm wavelength light and G channel showed the best correlation in waveform under 600 nm wavelength lights. Above 600 nm wavelength lights, the R channel showed the best correlation and G channel showed comparable PPGi signals with R channels.
C. PPGi Amplitudes in the RGB Channels With Different Light Intensity
According to the performance in Fig. 5, 470 nm, 490 nm, 505 nm, 590 nm, 600 nm, 610 nm, 625 nm and 660 nm wavelength lights have been chosen to acquire better performances with minimum light intensity in the RGB channels from twelve subjects, respectively. Fig. 6 shows better correlation coefficients from the RGB channels with minimum light intensity for 470 nm, 490 nm, 505 nm, 590 nm, 600 nm, 610 nm, 625 nm and 660 nm wavelength lights with 68%, 38%, 48%, 9%, 4%, 3.8%, 3.5%, 2% light intensity from male, age 30 years. Fig. 8 shows correlative coefficient fitting curves in different intensity spectra for 470 nm, 490 nm, 505 nm, 590 nm, 600 nm, 610 nm, 625 nm and 660 nm wavelength lights from male, age 30 years.
FIGURE 6.
Box-and-whisker plot showing better correlation coefficients from in the RGB channels with minimum light intensity for (68%), 490 nm (38%), 505 nm (48%), 590 nm (9%), 600 nm (4%), 610 nm (3.8%), 625 nm (3.5%) and 660nm (2%) wavelengths. The red cross are drawn as outliers if they are larger than  (q3 - q1) or smaller than q1 – 1.5(q3 - q1), where q1 and q3 are the 25th and 75th percentiles, respectively. These representative data are from twelve subjects.
FIGURE 8.
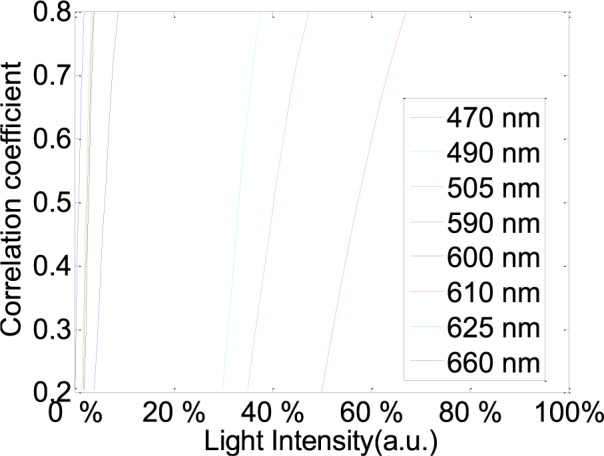
Correlative coefficient fitting curves in different intensity spectra for 470 nm, 490 nm, 505 nm, 590 nm, 600 nm, 610 nm, 625 nm and 660 nm wavelength lights. These representative data are from twelve subjects.
The influence of light intensity for PPGi waveform was also considered. G component of the PPG signal appeared to be stronger than that of the R and B channels [21]. However, it has been found that, above 590 nm, physiological pulsations were more apparent in the R channel than that of the G and B channels (Fig. 6). Particularly, above 600nm wavelength lights with a lower light intensity the R channel still had a strong relative in waveform with the gold standard signal.
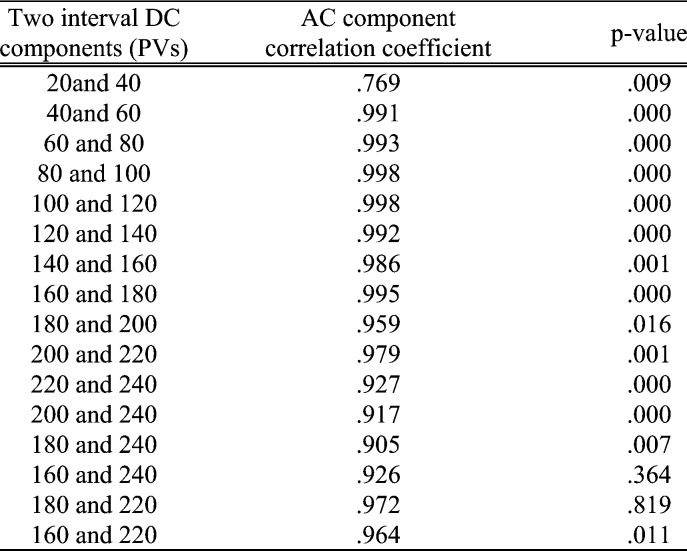
The performance of the RGB channels in different light intensity was considered. Fig. 7 shows the fitted curve of PPGi amplitudes in the RGB channels with different light intensities for 470 nm, 490 nm, 505 nm, 590 nm, 600 nm, 610 nm, 625 nm, 660 nm wavelength lights and white light from (male, age 30 years). Fig. 9 shows AC amplitude changes with DC amplitude in white light. These representative data have been collected from the twelve subjects. The AC amplitude obtained with increasing light intensity showed an initial increase and then a decrease. The maximum AC amplitude a subject achieved was different from subject to subject, but most of the subjects achieved their maximum averaging AC output when averaging DC output was in the range from 180 to 220 PVs (8bits, 255 maximum PVs). Table 2 shows the results of the Pearson’s correlation coefficients and the corresponding p-value which were calculated to estimate the difference in AC component between two interval DC components from twelve subjects.
FIGURE 7.
The fitted curve of PPGi amplitudes in the RGB channels with different light intensity for 470 nm, 490 nm, 505 nm, 590 nm, 600 nm, 610 nm, 625 nm, 660 nm wavelengths and white light. X-axes represent averaging DC output form pixels and y-axes represent averaging AC output form pixels. These representative data are from male, age 30 years old.
FIGURE 9.
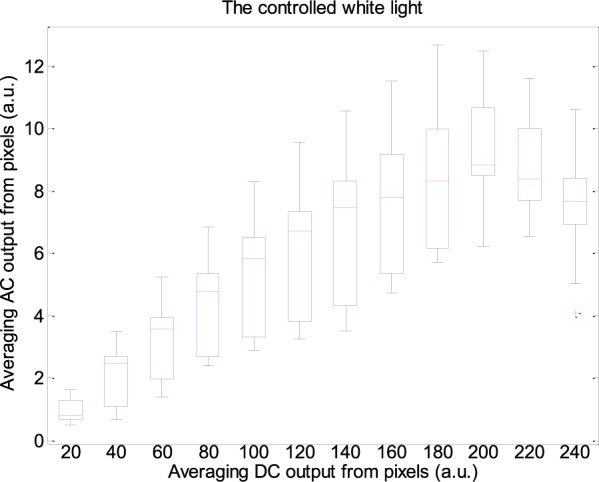
Box-and-whisker plot showing AC amplitudes changes with DC amplitude in white light. These representative data are from twelve subjects.
TABLE 2.
Results of the Pearson’s correlation coefficients and the corresponding p-value which were calculated to estimate the difference in AC component between two interval DC components from twelve subjects.
D. PPGi Performance in Different Movements
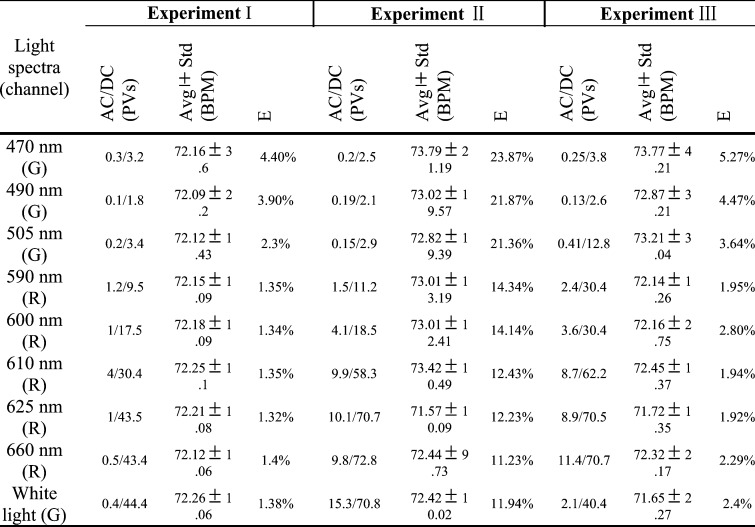
Table 3 shows results of PPGi performance in the experiment I, experiment II and experiment III including AC components, DC components, E, average value and Std of PR with 90% light intensity. Compared with PPGi performance in the RGB channels, the signal in the best channel was shown in the table which was consistent with that as shown in Fig. 6. Comparing with the three experiments, PPGi signal in the experiment I showed the best performance and PPGi signal in the experiment II showed the worst performance.
TABLE 3.
Results of PPGi performance in experiment I, experiment II and experiment III with 90% light intensity are from male, age 30 years. These results are from 100 seconds signals.
One-way ANOVA was then applied to the PR values derived from the SPWVD approach in order to compare the performance of these two movements and the stationary measurements. The data are acquired in white light from male (age 30 years). ANOVA performed on the parameter PR shows no significant difference between the movement and stationary condition (stationary and horizontal movement p = 0.948; horizontal vertical movement p = 0.804; stationary and vertical movement p = 0.754).
E. PPGi Performance in White Light
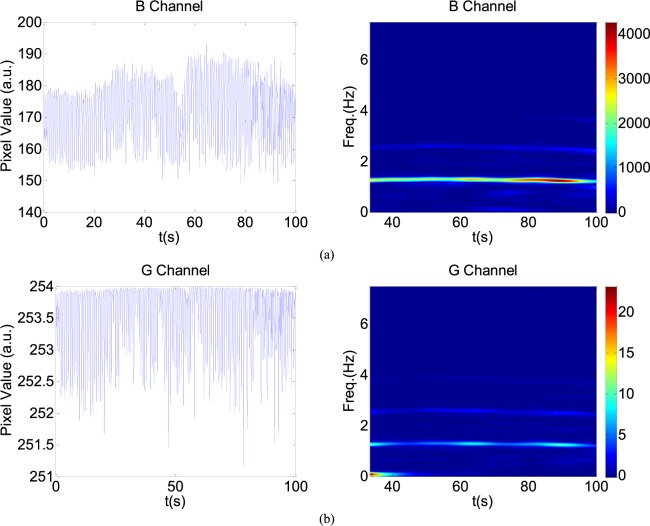
PPGi performance in white light was also considered. With increasing light intensity, the DC component increased, whereas when averaging DC output in the RGB channels was more than about 200 PVs (8bits, 255 maximum PVs), the AC amplitude decreased (Fig.7) which means PPGi in R and G channels may include more noise. Especially when PVs in the R and G channels saturated, the signal may be affected by distortion. For example, 100 seconds PPGi signals in the G (Fig.10a) and B (Fig.10b) channels in white light are shown. The absolute power intensity in the B channel is much clearer than that in the G channel. The amplitude of AC component in the B channel is evidently larger than that in the G channels. When signal in the R or G channel saturated, signal in the B channel can also show better performance.
FIGURE 10.
A representative figure showing B (a) and G (b) channels PPGi signals in white light. Left figure represents the raw signals. Right figure represents the corresponding SPWVD results with color bar indicating the absolute power intensity.
IV. Discussion
A. The RGB Channels Features in Different Light Conditions
A great amount of physiological information using PPG technology can be obtained from different light conditions. One of the most famous examples can be found in the use of 660 nm and 940 nm wavelength lights for SpO2 determination. Shimizu et al. [9], in contrast, past studies have shown that the best light source for alcohol intake detection is a green-LED. Moreover, a lot of physiological information using PPG technology showed different characteristics in the different light conditions. For example, the pulse rates obtained from green light (525 nm) PPG were strongly correlated with the R-R interval of an electrocardiogram in all environments, but those obtained from infrared light (880 nm) PPG displayed a weaker correlation with cold exposure [17].
The conventional PPG devices are required to follow with ISO standards [18] and an accuracy of less than 4% ± 1SD is required. Common challenges in PPG device design are the deterioration of accuracy due to motion artifacts, low perfusion, low saturation calibration, and probe positioning [19]. In addition to these challenges, PPGi technology based on the camera comes with additional design challenges. As shown in the Fig. 1, the consumer camera has a particular reflective curve for the different light conditions in the RGB channels. Other research groups have found that in ambient light, the G channel offers the strongest plethysmographic signal, which corresponds to an absorption peak by (oxy-)hemoglobin. PPGi signals in the various light spectra show different performance in each channel.
Because PPG signal contains a number of features described in literature [20], signal correlation between PPGi and gold standard was considered in different light spectra. After extensive experiments, it has been found that, with a 0.8 correlation coefficient, PPGi signal can better show many details in waveform, such as systolic peak, dicrotic notch, diastolic peak and so on. In the experiment I, as shown in Fig. 5 and Fig. 6, it was found that the light in 470 nm, 490 nm, 505 nm, 590 nm, 600 nm, 610 nm, 625 nm and 660 nm wavelengths can produce PPGi signal with 0.8 of correlation coefficient compared to the gold standard signal. The performance was correspondent with Fig. 11 which shows absorption curves for O2Hb and Hb between 400 nm and 700 nm wavelength lights. The difference was in the light intensity and channels. The R and B channels can also obtain excellent PPGi waveform compared to gold standard in some wavelength lights. Especially, above the 590nm wavelength lights, R channel shows the best PPG component in the RGB channels and in 470 nm wavelength light the PPGi performance in the B channel was also comparable with that in the G channel. As shown in the Fig. 1, the channel performing the best PPGi waveform always corresponds to light wavelength intensity from the camera in the RGB channels.
FIGURE 11.
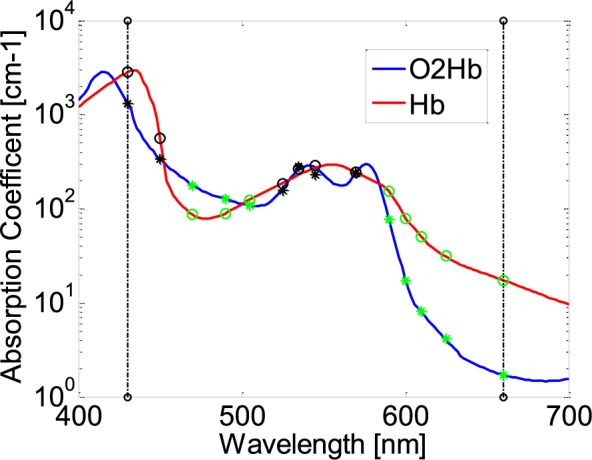
Absorption curves for O2Hb and Hb between 400 nm and 700 nm light spectrum. Created with data from [21]. G hollow circles and asterisks represent absorption coefficients in O2Hb and Hb for 470 nm, 490 nm, 505 nm, 590 nm, 600 nm, 610 nm, 625 nm and 660 nm wavelengths.
B. Amplitude Related Changes With Light Intensity
The reflected PPGi signal includes two components: AC component and DC component. AC component represents physiology information which indicates arterial pulsation. DC component contains reflectance and scattering from tissue. Many simple applications are available: pulse counters, using the AC component, skin color and hemoglobin saturation meters, using the DC component [22]. The DC component of the photoplethysmographic signal is a function of the blood flux beneath the device. The ratio of AC and DC components in 660nm and 940nm wavelength lights gives the SpO2. In convention PPG method, there are some elements which impact on AC and DC components including contacting force to PPG sensor [23] and relative movement to detection sensor. However, for PPGi signal acquirement based on the camera, except for the above mentioned two kinds of factors, sensitivity to reflective light from fingertip in the RGB channels with different light conditions has very important influence for AC and DC components.
In the current experiment, it was found that the DC amplitude of PPGi signals significantly increased with gradually improved light intensity until PVs reached saturation in all light spectra. Then 200 PVs from averaging DC output as a threshold were utilized to distinguish AC component peak point. The effective threshold was limited in 625 nm, 660nm wavelength lights and the white light. Other light spectra cannot reach so high DC component because low wavelength photons have much higher skin absorbance, and therefore less reflected light. The first increase followed by a decrease in pulse amplitude, with increasing in the light intensity, may be related to in the light sensitivity of the camera. The camera has a higher sensitivity in the low light intensity than that in the high light intensity. From the viewpoint of the RGB channels for light sensitivity, the AC component increases as the light intensity increases up to a certain point where a maximum of AC component was acquired. The phenomenon occurs in the RGB channels.
C. SNR Related Changes in Movement
Motion artifact was one of main noise signals in the convention PPG method and PPGi technology. Especially in PPGi technology, the fingertips cannot be fixed so the measurement is directly affected by external environment light. Any fingertip movements influence the light condition, so the motion artifacts were inevitable. The motion artifacts were divided in two kinds: vertically contact movement and horizontally contact movement relative to the camera lens.
Table 3 shows that the PPGi performance in the horizontal movement was better than that in the vertical movement. The main reason is that the arterial wall properties, that peak point of the AC amplitude appeared when intra-arterial pressure and contacting force was equal. In the previous literature, a pulse amplitude which first increases and then decreases with increase in external pressure has been found in the conventional PPG measurements [23]. The changes in the AC amplitude and the ratio of AC and DC over the contacting force had the similar changing trend. As a consequence, more noisy signals were produced. The subjects were required to move the index fingertip on the camera lens horizontally, irregularly and constantly with stable contacting forces, so the PPGi was mainly influenced from the reflected light intensity. When the averaging DC output from pixels was less than 150, as shown in Fig. 7, the ratio of AC and DC was almost constant. So horizontal movements less impact on the PR component in frequency domain.
V. Conclusion
This study analyzed the influence of light conditions on physiological information acquisition using a commercial camera from twelve young healthy subjects. The PPGi obtained from fingertip in a fixed position and in movement in horizontal and vertical direction relatively to the camera was also implemented.
Physiological information acquisition in the RGB channels show different features in the various light conditions. The channel performing the best PPGi waveform always corresponds to light wavelength intensity from the camera in the RGB channels: when the light wavelengths were less than 590nm, PPGi signal in the G channel showed better SNR than that in the R channels, whereas when the light wavelengths were more than 590nm, PPGi signal in the R channel shows better SNR than that in the G channels. The PPGi signal in the G channels always shows best SNR in the RGB channel in white light.
Over a range from 470 nm to 660 nm wavelength lights and white light, the DC amplitude changed progressively with the light intensity. The changes in the AC amplitude had a different changing trend which show a first increase and followed by a decrease. Through the extensive experiments, the AC peak amplitude occurred when averaging DC output from pixels was in the range of 200 ± 20 PVs (8bits, 255 maximum PVs). The PPGi performance in the horizontal movement relative to the camera lens was better than that in vertical movement.
The results are helpful for estimation of physiological information, especially requirement for combination of different light wavelengths or RGB bands, such as SpO2. It was feasible for PPGi technology to monitor PR, RR and SpO2 in a clinical environment [7], [8]. It also suggests that the effects of light conditions should be carefully examined in the design of photoplethysmography-based health care devices. The choice of different bands can also optimize the SNR of the PPGi signal and improve the accuracy of detection.
Biographies
He Liu, photograph and biography not available at the time of publication.
Yadong Wang, photograph and biography not available at the time of publication.
Lei Wang, photograph and biography not available at the time of publication.
Funding Statement
This work was supported in part by the National 863 Program of China under Grant 2012AA02A604, the Guangdong Innovation Research Team Funds for Low-Cost Healthcare and Image-Guided Therapy, the Shenzhen Science and Technology Innovation Project under Grant CXZZ20130517104329683, and the Next Generation Communication Technology-Major Project of National Scientific and Technological Programs under Grant 2013ZX03005013.
References
- [1].Allen J., “Photoplethysmography and its application in clinical physiological measurement,” Physiol. Meas, vol. 28, no. , pp. R1–R39, Mar. 2007. [DOI] [PubMed] [Google Scholar]
- [2].Lamonaca F., Kurylyak Y., Grimaldi D., and Spagnuolo V., “Reliable pulse rate evaluation by smartphone,” in Proc. IEEE Int. Symp. Med. Meas. Appl. (MeMeA), May 2012, pp. 1–4. [Google Scholar]
- [3].Karlen W., Lim J., Ansermino J. M., and Dumont G., “Design challenges for camera oximetry on a mobile phone,” in, Proc. Annu. Int. Conf. IEEE Eng. Med. Biol. Soc. (EMBC), Aug. 2012, pp. 2448–2451. [DOI] [PubMed] [Google Scholar]
- [4].Wieringa F. P., Mastik F., and van der Steen A. F., “Contactless multiple wavelength photoplethysmographic imaging: A first step toward ‘SpO2 camera’ technology,” Ann. Biomed. Eng., vol. 33, no. 8, pp. 1034–1041, 2005. [DOI] [PubMed] [Google Scholar]
- [5].Kong L., et al. , “Non-contact detection of oxygen saturation based on visible light imaging device using ambient light,” Opt. Exp., vol. 21, no. 15, pp. 17464–17471, 2013. [DOI] [PubMed] [Google Scholar]
- [6].Scully C. G., et al. , “Physiological parameter monitoring from optical recordings with a mobile phone,” IEEE Trans. Biomed. Eng., vol. 59, no. 2, pp. 303–306, Feb. 2012. [DOI] [PMC free article] [PubMed] [Google Scholar]
- [7].Tarassenko L., Villarroel M., Guazzi A., Jorge J., Clifton D. A., and Pugh C., “Non-contact video-based vital sign monitoring using ambient light and auto-regressive models,” Physiol. Meas., vol. 35, no. 5, pp. 807–831, 2014. [DOI] [PubMed] [Google Scholar]
- [8].Webster J. G., Design of Pulse Oximeters. Bristol, PA, USA: IOP, 1997. [Google Scholar]
- [9].Shimizu Y. and Omura Y., “Advanced spectroscopic characterization of impact of alcoholic intake on variation in blood-pulse waveform,” IEEE Sensors J., vol. 11, no. 9, pp. 1998–2006, Sep. 2011. [Google Scholar]
- [10].[Online]. Available: http://www.epitex.com/products/led_plastic_mold/led_plastic_mold.ht
- [11].Talke P., Snapir A., and Huiku M., “The effects of sympathectomy on finger photoplethysmography and temperature measurements in healthy subjects,” Anesth Analg, vol. 113, no. 1, pp. 78–83, Jul. 2011. [DOI] [PubMed] [Google Scholar]
- [12].Karlen W., Raman S., Ansermino J. M., and Dumont G. A., “Multiparameter respiratory rate estimation from the photoplethysmogram,” IEEE Trans. Biomed. Eng., vol. 60, no. 7, pp. 1946–1953, Jul. 2013. [DOI] [PubMed] [Google Scholar]
- [13].Sun Y., Papin C., Azorin-Peris V., Kalawsky R., Greenwald S., and Hu S., “Use of ambient light in remote photoplethysmographic systems: Comparison between a high-performance camera and a low-cost webcam,” J. Biomed. Opt., vol. 17, no. 3, p. 037005, Mar. 2012. [DOI] [PubMed] [Google Scholar]
- [14].Sun Y., Hu S., Azorin-Peris V., Greenwald S., Chambers J., and Zhu Y., “Motion-compensated noncontact imaging photoplethysmography to monitor cardiorespiratory status during exercise,” J. Biomed. Opt., vol. 16, no. 7, p. 077010, Jul. 2013. [DOI] [PubMed] [Google Scholar]
- [15].Hlawatsch F. and Boudreaux-Bartels G. F., “Linear and quadratic time-frequency signal representations,” IEEE Signal Process. Mag., vol. 9, no. 2, pp. 21–67, Apr. 1992. [Google Scholar]
- [16].Shin H. S., Lee C., and Lee M., “Adaptive threshold method for the peak detection of photoplethysmographic waveform,” Comput. Biol. Med., vol. 39, no. 12, pp. 1145–1152, Dec. 2009. [DOI] [PubMed] [Google Scholar]
- [17].Bland J. M. and Altman D. G., “Statistical methods for assessing agreement between two methods of clinical measurement,” Lancet, vol. 327, no. 8476, pp. 307–310, Feb. 1986. [PubMed] [Google Scholar]
- [18].Medical Electrical Equipment—Part 2-61: Particular Requirements for Basic Safety and Essential Performance of Pulse Oximeter Equipment, document ISO 80601-2-61, Geneva, Switzerland, 2011. [Google Scholar]
- [19].Webster J., Design of Pulse Oximeters. New York, NY, USA: Taylor & Francis, 1997. [Google Scholar]
- [20].Elgendi M., “On the analysis of fingertip photoplethysmogram signals,” Current Cardiol. Rev., vol. 8, no. 1, pp. 14–25, Feb. 2012. [DOI] [PMC free article] [PubMed] [Google Scholar]
- [21].Prahl S., “Tabulated molar extinction coefficient for hemoglobin in water,” Oregon Med. Laser Center, Portland, OR, USA, Tech. Rep., 1998. [Google Scholar]
- [22].Verkruysse W., Svaasand L. O., and Nelson J. S., “Remote plethysmographic imaging using ambient light,” Opt. Exp., vol. 16, no. 26, pp. 21434–21445, 2008. [DOI] [PMC free article] [PubMed] [Google Scholar]
- [23].Teng X. F. and Zhang Y. T., “The effect of contacting force on photoplethysmographic signals,” Physiol. Meas., vol. 25, no. 5, pp. 1323–1358, Oct. 2004. [DOI] [PubMed] [Google Scholar]


