Abstract
Noncontact detection characteristic of Doppler radar provides an unobtrusive means of respiration detection and monitoring. This avoids additional preparations, such as physical sensor attachment or special clothing, which can be useful for certain healthcare applications. Furthermore, robustness of Doppler radar against environmental factors, such as light, ambient temperature, interference from other signals occupying the same bandwidth, fading effects, reduce environmental constraints and strengthens the possibility of employing Doppler radar in long-term respiration detection, and monitoring applications such as sleep studies. This paper presents an evaluation in the of use of microwave Doppler radar for capturing different dynamics of breathing patterns in addition to the respiration rate. Although finding the respiration rate is essential, identifying abnormal breathing patterns in real-time could be used to gain further insights into respiratory disorders and refine diagnostic procedures. Several known breathing disorders were professionally role played and captured in a real-time laboratory environment using a noncontact Doppler radar to evaluate the feasibility of this noncontact form of measurement in capturing breathing patterns under different conditions associated with certain breathing disorders. In addition to that, inhalation and exhalation flow patterns under different breathing scenarios were investigated to further support the feasibility of Doppler radar to accurately estimate the tidal volume. The results obtained for both experiments were compared with the gold standard measurement schemes, such as respiration belt and spirometry readings, yielding significant correlations with the Doppler radar-based information. In summary, Doppler radar is highlighted as an alternative approach not only for determining respiration rates, but also for identifying breathing patterns and tidal volumes as a preferred nonwearable alternative to the conventional contact sensing methods.
Keywords: Breathing patterns, Doppler radar, respiration rate, tidal volume
Non-contact detection characteristic of Doppler radar provides an unobtrusive means of respiration detection and monitoring. This paper presents an evaluation of the of use of microwave Doppler radar for real-time capture of different dynamics of breathing patterns, which could be used to gain further insights into respiratory disorders and refine diagnostic procedures. Several known breathing disorders were professionally role played and captured in a real-time laboratory environment using a non-contact Doppler radar to evaluate its feasibility. In addition, inhalation and exhalation flow patterns under different breathing scenarios were investigated to further support the feasibility of Doppler radar to accurately estimate the tidal volume. The results obtained for both experiments were compared with the gold standard measurement schemes such as respiration belt and spirometry readings, yielding significant correlations with the Doppler radar based information. Doppler radar is highlighted as an alternative approach not only for determining respiration rates but also for identifying breathing patterns and tidal volumes as a preferred non-wearable alternative to the conventional contact-sensing methods.
I. Introduction
Non-contact detection of basic human functions such as respiration using Doppler radar is particularly useful in comparison to respiration belts which are simply inconvenient or even impractical; for instance, in long term sleep monitoring and respiration monitoring of burn patients or patients with dermatological conditions. As the belt is strapped to the chest, the natural breathing process is somewhat interfered with and therefore the measurements are likely to be affected. A non-contact form of measurement penetrating clothing would facilitate the gathering of breathing data that has not been available in the past. This provides the additional information of providing greater insights into conditions such as sleep apnoea with enhanced patient comfort. Furthermore, as Doppler radar is relatively robust against environmental factors such as ambient temperature, light interference, and other electromagnetic signals such as WiFi, it offers less practical limitations for long term monitoring and detection compared to, for example, computer vision-based systems or chest straps.
Typically, recording and monitoring of vital signs such as blood pressure, temperature, pulse rate and respiration rate are considered as standard hospital procedures. Often, these are recorded only when patients experience respiratory problems or they are in certain critical conditions where abnormal respiratory rates are one of the key predictors of such events [1], [2]. Normal breathing rates for resting adults varies from 12–20 breaths/min [3] and some studies suggest having a rate of over 20 breaths/min is abnormal and critical if it is over 24 breaths/min [1]. As we gain more insight into the respiratory function in its natural form, one interest among breathing and sleep researchers is, can long term respiratory signatures potentially be used in the diagnosis of respiratory disorders? In particular, can the identification of different respiratory patterns lead to detecting specific respiratory conditions? George et al., [3] have already discussed the importance of respiratory rate as well as associating certain types of breathing patterns to certain respiratory disorders. Therefore, a non-contact mechanism which accurately captures respiratory function under various breathing conditions is destined to support research leading to new clinical practices in many areas relevant to respiratory physiology.
Doppler radar systems for monitoring vital physiological signs have been reported in a number of papers (see [4]–[10]) all demonstrating its feasibility in obtaining respiration rates (frequency) using fast Fourier transform (FFT) [11], wavelet analysis [12] or time-frequency analysis [8]. However, to the best of our knowledge its ability to capture different types of breathing patterns is still an unresolved issue. Further to this, although respiratory tidal volume has been deducted using Doppler radar [13] for normal breathing conditions using the known relationship between chest wall movement and tidal volume, this has not been investigated for other forms of respiratory conditions. In this paper we look at obtaining the tidal volume under different breathing scenarios.
Continuous and simultaneous measurement of the breathing patterns and tidal volume longer term is useful and could potentially be used to assess certain breathing disorders especially if it can be performed via non-contact techniques. As mentioned in [14], variation in breath by breath volume and temporal pattern distribution changes are dependent on the clinical condition and the pathophysiology which in turn can be related to either restrictive or obstructive lung diseases. This signifies the importance of having tidal volume measurements in addition to the breathing patterns.
In this paper, we demonstrate the feasibility of using Doppler radar in capturing different types of breathing patterns. Breathing types were professionally role played as per the widely accepted descriptions given in [3] and [15]. In addition, we show that the relationship between the inspiration and expiration tidal volumes obtained from Doppler radar correlates with the measurements obtained from the clinically used spirometer readings for various breathing conditions. The remainder of this paper is organised as follows: Section II provides the theoretical background of Doppler radar in measuring the respiration function, Section III describes the signal processing algorithms used in dealing with the Doppler radar and reference signals and Section IV describes the experimental setup for data collection. Sections V & VI discuss the parameters measured and concluding remarks are given in Section VII.
II. Respiration Monitoring Via Microwave Doppler Radar
A. Doppler Radar Theory
The Doppler Effect [16] occurs when there is change in frequency in the radiated or reflected radio wave due to the movement of the object. When a continuous wave is transmitted towards an object, the reflected signal is either frequency modulated or phase modulated due to the movement of the object. By comparing the two, the change in frequency and phase can be derived from the received signal. In a continuous wave Doppler radar, transmitted signal is represented by
 |
where  is the transmitted signal and
  is the arbitrary phase shift or the phase noise of the signal source. The reflected signal (
 ) influenced by the movement of the abdomen during respiration, at a nominal distance
  , can be represented in the form of a time varying displacement
  as follows,
 |
In a direct conversion architecture, the baseband output is derived from the mixing of the received signal with the local oscillator and can be represented by
 |
where  is the constant phase shift dependent on the nominal distance to the target and
  is the residual phase noise. To overcome the sensitivity of the target distance [13] as well as the null problem [17], quadrature receiver architecture can be used. Then, equation (3) can be modified to
 |
III. Signal Processing
A. The Savitzky-Golay (SG Filter) Method
The Savitzky-Golay filter is a least square polynomial filter [18]. Savitzky and Golay demonstrated the use of this filter in removing the noisy data obtained from the chemical spectrum while preserving the shape and height of waveform peaks. Referring to [18], a least square polynomial  of order
  is fitted to the signals with a moving window of size
  centred at
  . This can be explicitly stated as,
 |
where  is the
  -th coefficient of the polynomial function. The mean squared approximation error (
 ) for the underlying group of data point samples centred at
  can be represented as,
 |
Thus, the output value is smoothed and derived from the central point of  of the moving window and the whole procedure is repeated over the stream of data by convolution [18].
 |
In this paper, SG filter was used to smooth the raw data from Doppler Radar while preserving the shape and reducing the noise. The results are shown in Section V.
B. Respiration Rate Extraction
Fourier and wavelet transform approaches were used in extracting the respiration rate in each particular breathing cycle.
1). Fast Fourier Transform: FFT
Fourier transform is used for characterizing linear systems as well as to identify the frequency components that make up a continuous waveform [19]. FFT is an efficient and fast approach in computing the Discrete Fourier transform (DFT). In this paper, the FFT (using the Cooley-Tukey DFT algorithm) [19] was used to determine the related frequency component of breathing and the resultant spectra are shown in Section V via spectral peak extraction.
The extracted peak frequency can be used to approximate the breathing rates especially under a normal breathing condition. As for abnormal breathing patterns, it is found that FFT is no longer suitable for capturing the respiration rate as it does not give the information on the time instance at which the frequency occurs. This is due to the non-periodic characteristic in an abnormal breathing cycle and led us to explore using continuous wavelet transform which is described in Section III-B.2.
2). Continuous Wavelet Transform (CWT)
Computation of FFT over the complete time period of the signal only returns the corresponding frequency components of the signal but not the information on the time instance at which a particular frequency occurs. However, the Short Time Fourier Transform (STFT) using a sliding window provides information on both time and frequency with limited resolution on both dimensions simultaneously [20]. The wavelet transform is destined to address this issue. In the continuous wavelet transform (CWT), the mother wavelet is dilated in such a way to cater for temporal changes of different frequencies [21]. A mother wavelet function is defined as a function of  with a zero mean and localized in both frequency and time. Properties of the wavelet can be summarised as follows:
 |
Through dilation and translation of a mother wavelet  , a family of wavelets is produced. We can denote this as,
 |
where  ,
,  is the translating parameter specifying region of interest and
  is the dilation parameter that is greater than zero. Continuous wavelet transform is the coefficient of the basis
  [20] which is the inner product of the family of the wavelet
  with the signal
  denoted as,
 |
where  is the complex conjugate of
  and
and  is the time scale map. Using equation 14, one dimensional signal of
  can be mapped into a two dimensional coefficient of
  and time frequency analysis can be performed where we could locate a particular frequency (
 ) at that particular time instance
  .
.
If  is a
is a  function, inverse transform of the wavelet can be denoted as,
 |
where  is,
is,
 |
and  is the Fourier transform of the mother wavelet
  . In this paper, we used CWT to map the signals into time-frequency representation as a comparison to FFT. The results are shown in section V.
C. Correlation of Radar Signal With Respiration Belt
Analysis of the breathing pattern, independent of the respiration rate measurements, can often provide clues for the existence of specific respiratory conditions [3]. For example, abnormal breathing, as in Cheyne-Stokes breathing, can be seen in normal people, altitude-related respiratory defects, or in patients with severe neurological or cardiac diseases [22]. Therefore, relying on the respiration rate alone will not provide sufficient information on the breathing pattern. In this paper, different types of breathing patterns were professionally role played in real time based on the description of the patterns reported in the literature [3], [15] including:
-
1)
Normal Breathing
-
2)
Kussmaul’s Breathing
-
3)
Cheyne-Stokes Respiration
-
4)
Ataxic Breathing & Biot’s Breathing
-
5)
Cheyne-Stokes variant
-
6)
Central Sleep Apnoea
-
7)
Dysrhythmic Breathing (Non-rhythmic breathing).
Our intention of creating these scenarios is to establish that the measurements made using microwave Doppler radar correlates quite closely to the measurements made by clinically established techniques. Indeed, to use Doppler radar as a clinical tool, clinical trials with a sufficient number of subjects suffering from these conditions are required for an extensive analysis. This preliminary work lays a strong foundation and enforces the need for such extensive clinical trials.
D. Correlation of Radar Signal With Spirometer
By definition, tidal volume (TV) is the amount of air inspired or expired during regular breathing. It is a measurement of the amount of air flowing in and out of the lungs [23]. The linear relationship between lung and air flow during regular breathing has been previously documented (see [13], [24]) and since the output of the Doppler radar is proportional to the abdomen/chest wall movement, the amount of air flow either in or out can be derived in a similar way. Firstly, calibration was performed in order to obtain the most reliable chest displacement measurements as follows:
-
1)
Compute FFT for radar and spirometer signals
-
2)
Determine the maximum amplitude for both signals
-
3)
Compute the ratio from (2)
-
4)
Reconstruct new signal for radar from the calculated ratio by multiplying the ratio with the radar signal.
This will provide us with a functional relationship between the displacement of the chest wall (signals from Doppler radar) and the tidal volume to estimate the inhalation and exhalation flow rates.
IV. Experiment Setup
The measurement of humans respiration was approved by the Faculty of Science and Technology Ethics Sub-Committee HEAG (Faculty Human Ethics Advisory Groups), Deakin University and all participants provide their written informed consent to participate in this study.
A 2.4 GHz Doppler radar module [25] was used in this experiment. The system transmits a 2.4 GHz continuous wave at 0 dBm (1mW) and was attached to a two panel antenna (transmitter and receiver) having a data acquisition module (DAQ: NI-USB6009). The received signals were then sent to DAQ (sampled at 1000 Hz) for further processing using MATLAB. For this experiment, the subject was positioned 0.8m away from the panel antenna where the antenna was aligned to focus on the abdomen (belly) rather than the chest to capture a more reliable Doppler signal. This setup varies for different subjects depending on belly breathing or chest breathing. Data is collected from the subject with normal clothing and was instructed to follow specific breathing patterns as discussed in Section III-C. For each experiment, an external respiration belt (MLT1132 Piezo Respiratory Belt Transducer - sampled at 1000 Hz) attached to PowerLab (ADInstruments) was used as a reference signal to evaluate the performance of the Doppler radar.
For each breathing pattern experiment, 3 data sets were collected (only one set of observations for each breathing pattern is shown in this paper) from subject 1 where all the data sets show a good correlation with the reference respiration belt signal. This is to ensure a higher level of accuracy for Doppler radar in capturing the movements of the abdomen during breathing activity in this non-contact approach. Additionally, ten data sets of random breathing activities were collected from five additional participants ( = 25 ± 5; male and female) and the performance evaluation of the results are shown in Table I.
TABLE 1. Evaluation of Doppler radar measurements with respiration belt for 6 subjects.
| Dataset 1 | Dataset 2 | |||||||
|---|---|---|---|---|---|---|---|---|
| Subject | Gender | Mode | MSE | Error(%) | Correlation | MSE | Error(%) | Correlation |
| 1 | male | abdomen | 0.0236 | 1.18 | 0.9355 | 0.0764 | 3.82 | 0.9006 |
| 2 | male | abdomen | 0.0394 | 1.97 | 0.9610 | 0.0358 | 1.79 | 0.9065 |
| 3 | male | abdomen | 0.0102 | 0.51 | 0.9468 | 0.0172 | 0.86 | 0.9430 |
| 4 | female | chest | 0.0248 | 1.24 | 0.9718 | 0.0163 | 0.82 | 0.9668 |
| 5 | male | chest | 0.0544 | 2.72 | 0.8378 | 0.0140 | 0.70 | 0.9079 |
| 6 | female | abdomen | 0.0270 | 1.35 | 0.9601 | 0.0116 | 0.58 | 0.9505 |
Another set of experiments were performed to evaluate the air flow in and out during inhalation and exhalation using a Doppler radar system and a spirometer (MLT1000L respiratory flow-head attached to the Powerlab, sampled at 1000 Hz) as a reference. All the experiments were performed with the subject in a seated position (unless stated in a supine position) with a straight back and minimum movement from the body. With a seated position, the support from the back rest of the chair will minimize the movement of the body compared to a standing position and therefore, further improvements could be expected with a subject in a supine position.
V. Result
The dynamics and shape of the breathing patterns are shown in the following sections. For each condition, the human subject was instructed to follow a certain breathing pattern to investigate the feasibility of using Doppler radar in capturing such conditions. Without concentrating on the duration of each breathing pattern, the subject was briefed on the characteristics of each type of breathing pattern before each experiment commenced. Each Doppler record was compared with the standard respiration belt measurement as a reference. To this end, both the results from Doppler radar and respiration belt were normalized (to have a range of [−1 1]) to find the correlation of the breathing patterns obtained. The data is normalized to the range of [a, b] using:
 |
where  and
and  .
.
Further, the respiration rate analysis was approximated from the FFT and a time frequency analysis was obtained from the Continuous Wavelet Transform by computing the spectral density and the time-frequency distribution respectively. We proposed the use of CWT instead of purely relying on the spectral analysis as more information can be obtained from the time-frequency analysis to further understand how the breathing activity had taken place. The wavelet coefficients from the CWT can be used to extract features (i.e energy, entropy, frequency distribution, power etc.) along with patterns recognition techniques to characterise breathing disorders as well as filter-out the motion artefacts. We further discuss this in section V-H and also in the future work to potentially use this technique as a diagnostic tool for which strong and convincing evidence of reliability of Doppler radar in a range of breathing conditions is paramount of importance.
Table 2 shows the overall validation of the normalized Doppler Radar measurements in comparison to the normalised respiration belt signals using mean square error (MSE) and correlation coefficient (Corr_Coeff) as the average of three data sets.
TABLE 2. Evaluation of Doppler radar measurements compared to respiration belts (section V-A–section V-G).
| Types of Breathing | MSE | Corr_Coeff |
|---|---|---|
| Ataxic | 0.0038 | 0.9465 |
| Biot | 0.0063 | 0.9762 |
| Central Sleep Apnoea | 0.0121 | 0.9427 |
| Cheyne-Stokes | 0.0094 | 0.9376 |
| Cheyne-Stokes variant | 0.0089 | 0.9650 |
| Dysrhythmic Breathing | 0.0236 | 0.9355 |
| Normal Breathing | 0.0461 | 0.9198 |
| Kussmauls Breathing | 0.0764 | 0.9006 |
A. Normal Breathing
The normal breathing rate for an adult ranges from 12-20 breaths/min [3]. In this particular trial, the subject was asked to breathe normally and at ease, again, sitting on a chair, up right and facing the antenna. Figure 1 shows a normal rate of 12 breaths/min. From Figure 2, the breathing rate estimated using spectral density is 14.6 breaths/min (0.2441 Hz) which agrees with the CWT where a dominant frequency is present at 0.2441 Hz band.
FIGURE 1.
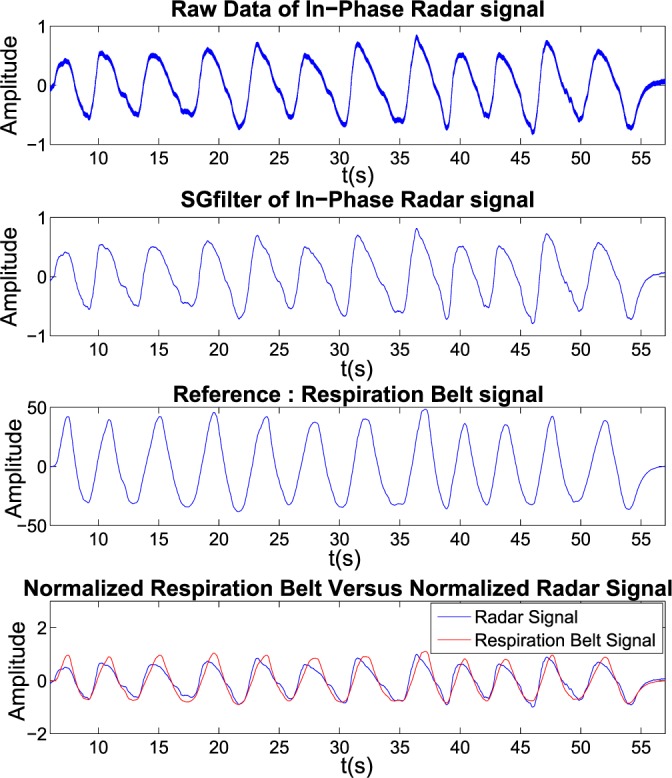
Normal Breathing signal: (from top to bottom: Raw radar Signal; Filtered Signal; Reference respiration belt signal; and Normalized respiration belt signal versus normalized filtered radar signal).
FIGURE 2.
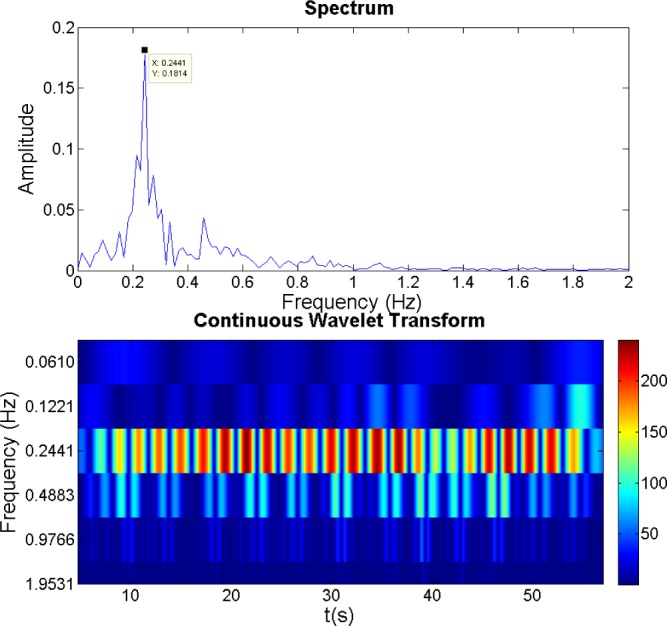
Spectral Density (FFT) and Continuous Wavelet Transform for normal Breathing from Doppler Radar.
B. Central Sleep Apnoea
For this experiment, data was collected with the subject in the supine position (sleeping on a bed) to emulate the typical environment of sleep. Central sleep apnoea is one type of sleep related disorders. Typically, sleep apnoea occurs at least 5 times per hour of sleep and each apnoeic lasts for at least 10 seconds. During central apnoea, there is a cessation of airflow with no diaphragmatic and intercostal muscle activity. This means that there is no air exchange either through the nose or the mouth. From Figure 5a, there are approximately 8 breaths/min but from the spectral analysis in Figure 6a, it is approximated 15.11 breaths/min corresponding to 0.2518 Hz. This is not accurate as spectral density approximation is not an appropriate approach to find the respiration rate for abnormal breathing patterns. From Figure 6a, using the distribution of frequency versus time, we can clearly see that there is no sign of breathing activities (apnoea) for the first 8 seconds, 45-60 seconds and 90-110 seconds. This ability of Doppler radar in detecting the apnoea state is beneficial for sleep monitoring which includes sleep apnoea conditions and also for more critical sudden infant death syndrome (SIDS).
FIGURE 5.
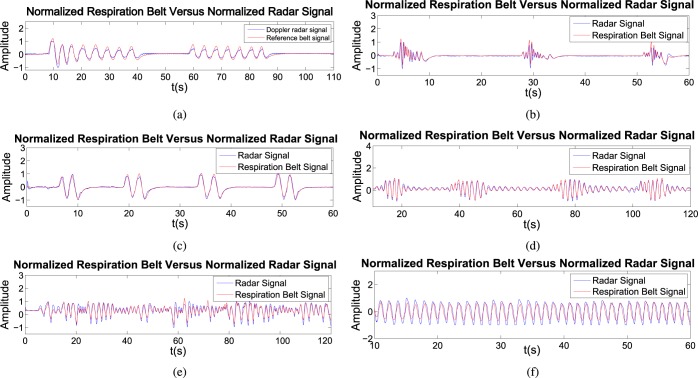
Normalized respiration belt signal versus normalized filtered radar signal. (a) Central Apnea Breathing signal. (b) Ataxic Breathing signal. (c) Biot’s Breathing signal. (d) Cheyne-Stokes Variant Breathing signal. (e) Dysrhythmic Breathing signal. (f) Kussmaul’s Breathing signal.
FIGURE 6.
Spectral Density (FFT) and Continuous Wavelet Transform (CWT) plot. (a) Central Apnea Breathing. (b) Ataxic Breathing. (c) Biot’s Breathing. (d) Cheyne-Stokes Variant Breathing. (e) Dysrhythmic Breathing. (f) Kussmaul’s Breathing.
C. Ataxic Breathing and BIOT’S Breathing
Ataxic breathing is often characterised by irregular cyclic breathing periods (irregular frequency and interspersed tidal volume) followed by unpredictable periods of apnoea or pauses in breathing. Biot’s breathing is another special type of breathing abnormality with nearly regular cyclic breathing followed by an apnoea segment. These forms of breathing are some times associated to brain-stem stokes, narcotic medications and patients with medullary lesions [3], [15]. For ataxic types of breathing, from Figure 5b, it is difficult to approximate the breathing rate from the patterns but the most frequent form is that of irregular cyclic breathing followed by a pause. Spectral density cannot be considered to provide a good approximation (see Figure 6b) as there is no dominant peak found while from CWT, we can clearly see the distribution of signals from time versus frequency analysis. For instance, from the first breathing segments, the subject breathes with a lower frequency of 0.1221 Hz followed by a period of rapid breathing at a frequency of 0.4883 Hz and eventually slowing down to 0.1221 Hz. This type of information is not available from spectral analysis and can further be improved with higher frequency resolution.
As for Biot’s breathing, from Figure 5c, there were 8 breaths/min consisting of a long apnoea period in between regular breathing patterns. From the spectral analysis shown in Figure 6c, it was approximated by 23.802 breaths/min which is not consistent with the patterns as shown in Figure 5c due to the combination of both regular and irregular breathing patterns. In the CWT analysis, however, both are separated and therefore the results tends to be more accurate as the dominant frequency was clearly seen at 0.4883 Hz which corresponds to 29.3 breaths/min occurring at relative time stamps corresponding to the breathing patterns shown in Figure 5c.
D. Cheyne Stokes Respiration
In Cheyne-Stokes breathing, there is a cyclic change in breathing with a crescendo-decrescendo type of sequence followed by pauses or central apnoea. In certain neurologic disorders, this type of breathing is often encountered, i.e bilateral cerebral hemispheric lesions [15], patients with stroke, brain tumour, traumatic brain injury. Carbon monoxide poisoning, metabolic encephalopathy, altitude sickness, and non-rapid eye movement of patients with congestive heart failure [3] can also exhibit this type of respiratory patterns.
From Figure 3, it can be clearly seen that the pattern changes with a crescendo-decrescendo sequence followed by an apnoea state. This further proves that Doppler radar is capable of capturing the changes of breathing in a non-contact method with good correlation to the one captured using the respiration belt. For respiration rate analysis, from Figure 4, it is difficult to approximate the rate from the peak itself using FFT method and it is prominent in CWT. From the CWT, we can see the sequence of crescendo-decrescendo from the energy level with the time versus frequency distribution. This could possibly be used as one of the features in classifying types of breathing disorders which will be our focus in the future.
FIGURE 3.
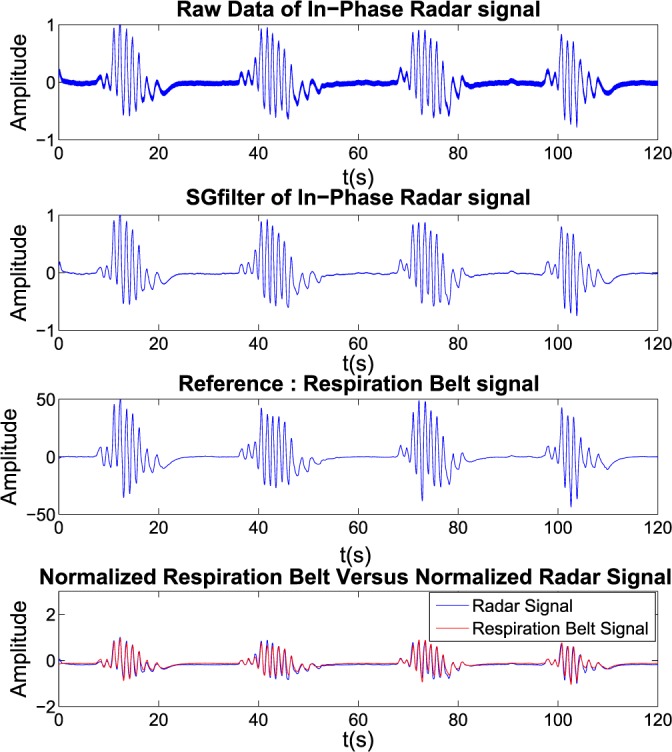
Cheyne Stokes Breathing signal: (from top to bottom: Raw radar signal; Filtered signal; Reference respiration belt signal; and Normalized respiration belt signal versus normalized filtered radar signal).
FIGURE 4.
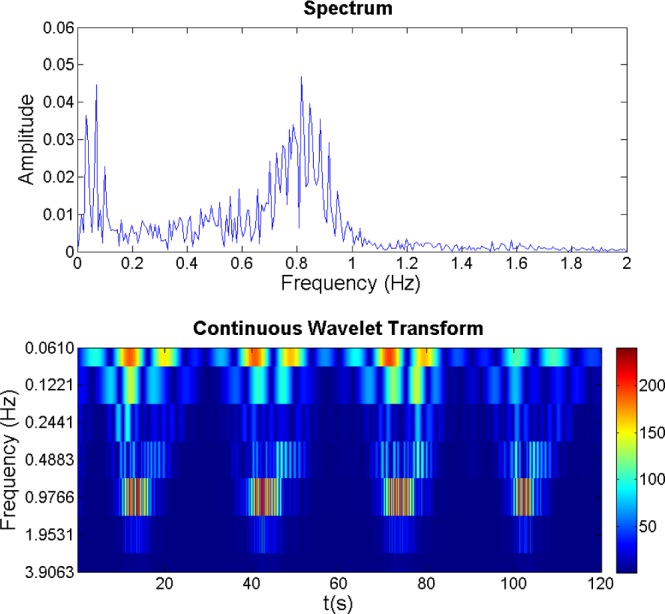
Spectral Density (FFT) and Continuous Wavelet Transform for Cheyne Stokes Breathing from Doppler Radar.
E. Cheyne-Stokes Variant
Cheyne-Stokes variant breathing is similar to Cheyne-Stokes respiration but the central apnoea stage is substituted by hypo-apnoea. This type of breathing is found in brain stem lesions as well as in bilateral cerebral hemispheric disease [15]. From Figure 5d, the pattern is similar to Cheyne-Stokes breathing pattern but followed by a hypo-apnoea scenario where there is a small variation in breathing instead of a flat signal. Spectral analysis (see Figure 6d) shows few peaks and without the timing information and it is difficult to interpret frequency information. CWT, on the other hand, provides adequate spectral-temporal information and results show two dominant frequency bands at 0.4883 Hz and 0.9766 Hz and hypo-apnoea state lies in the 0.4883 Hz band at the time approximately between (20-40)s, (50-75)s and (85-100)s.
F. Dysrhythmic Breathing
This type of breathing is characterised as non-rhythmic breathing with an irregular rhythm, rate and amplitude. It could be caused by an abnormality in the respiratory patterns generator invoked in the brain stem. The results of the pattern can be seen in Figure 5e where the pattern is non-rhythmic variation in rate and amplitude. In this case the Doppler radar was still able to capture the changes yielding consistent correlations with the respiration belt readings. Again, it is difficult to approximate the breathing rate from the spectral representation but with CWT, it is possible to represent the breathing frequency corresponding to the occurrences in time as shown in Figure 6e. From the results, the dominant frequency is approximated in the range of 0.4883 Hz.
G. Kussmaul’s Breathing
This type of breathing is characterised by a regular increased rate and corresponds to tidal volume patterns consistent with “gasping for air” associated with a severe metabolic acidosis [3]. Since this type of breathing is considered as almost periodic, the spectral density shown in Figure 6f can be used to represent the breathing rate approximated at 0.7477 Hz corresponding to 44.9 breaths/min which is quite accurate from the number of breath count approximated in the Figure 5f. CWT shows that the dominant frequency band is located at the 0.4883 Hz - 0.9766 Hz band but the results could further be improved with a higher frequency resolution.
H. Motion Signature From Doppler Radar
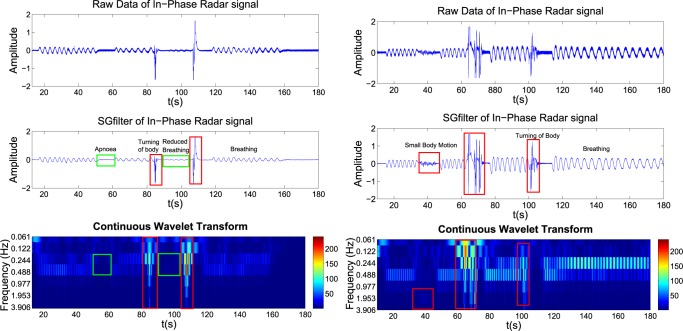
To further demonstrate the potential use of CWT, two experiments were performed where we capture the measurement of breathing signal under the influence of motions related to turning of the body and small body movements when in supine position to reflect to any possible events during sleep. The results of the experiments are shown in figure 7. From the time series representation, it is possible to identify the breathing, apnoea, turning of the body and body movement events with naked eye but with CWT, this process can be automated in a long term monitoring analysis especially in sleep studies which involved a large amount of data. Additionally, using Doppler radar, body movement such as turning of the body could be identified from the signature pattern of the signals as shown in the results whereas this information is not easily available from the respiration belt. This study will be extended to more subjects in a longer duration data collection exercise in the future for further evaluation and analysis especially for sleep studies. Moreover, type of features that can be extracted from CWT will be investigated to assist in signal analysis and diagnostics.
FIGURE 7.
Mixture of signal characteristic from Doppler radar measurement in supine position.
VI. Measurement of Volume in (Inhalation) and Volume Out (Exhalation)
An experiment was conducted to investigate the correlation between the Doppler radar and spirometer in capturing the respiratory function. For this purpose, few different experimental conditions were designed to investigate the feasibility and consistency of Doppler radar in obtaining the flow in and out corresponding to the spirometric measurements. In this experiment, the subject was asked to:
-
1)
Breathe deeply, pause, and continue to breathe deeply
-
2)
Breathe normally followed by deep breaths
-
3)
Breathe deeply followed by normal breathing.
The results are shown in Figure 8, 9 and 10 respectively for each instance. From the results, the shape of the Doppler radar signal is similar to the spirometer readings but with an amplitude difference due to non-calibration. After calibration, the Doppler radar signals are almost identical to the spirometer readings. Assuming that the shifting of Doppler Radar is caused by the movement of the chest/belly during respiration, a linear relationship between the change of flow has been derived based on the Doppler signal. We also see that the Doppler signal was sensitive enough to detect the differences in the breathing patterns. However, a calibration period of approximately 30 seconds is required and this can be automated.
FIGURE 8.
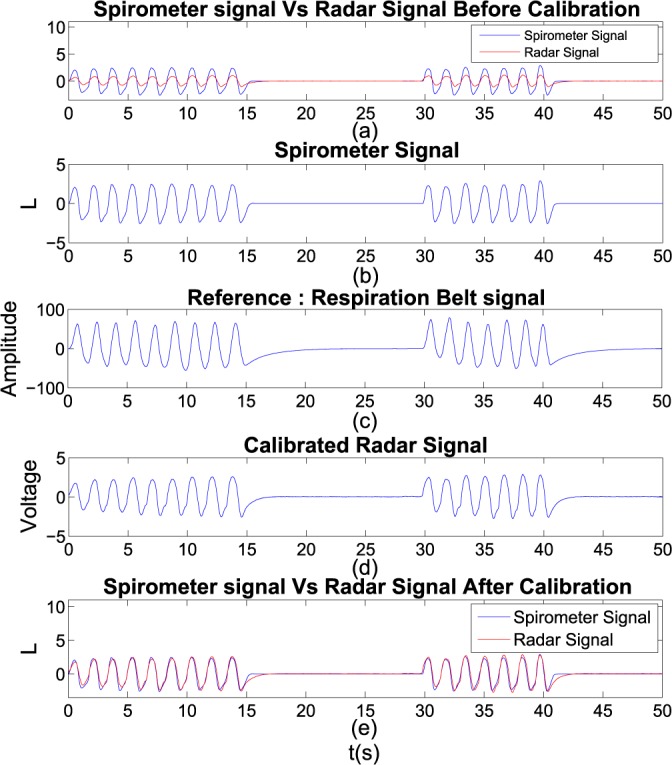
Experiment 1: Deep Breaths followed by apnoea: (a) Filtered radar signal versus spirometer reading; (b) Spirometer reading; (c) Reference respiration belt signal; (d) Calibrated radar signal; and (e) Spirometer reading versus calibrated radar signal.
FIGURE 9.
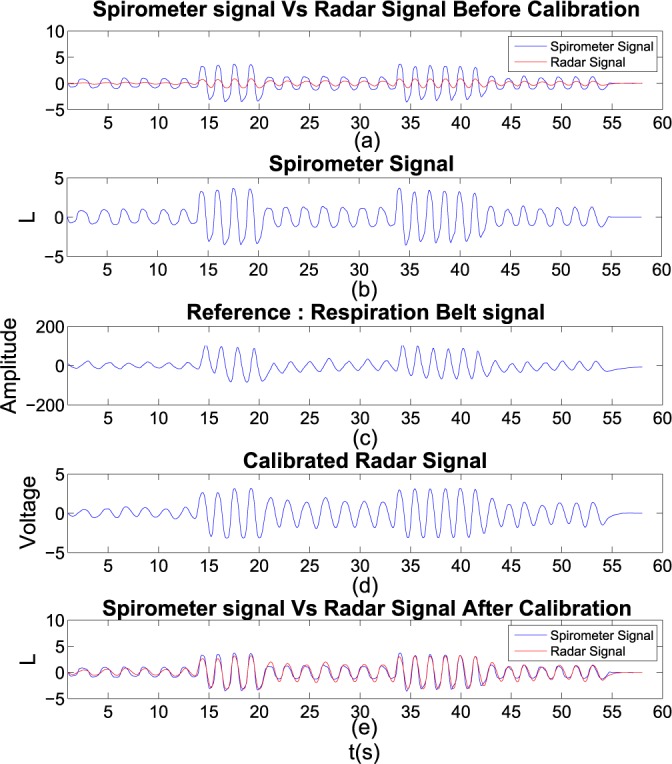
Experiment 2: Normal Breaths followed by Deep Breaths: (a) Filtered radar signal versus spirometer reading; (b) Spirometer reading; (c) Reference respiration belt signal; (d) Calibrated radar signal; and (e) Spirometer reading versus calibrated radar signal.
FIGURE 10.
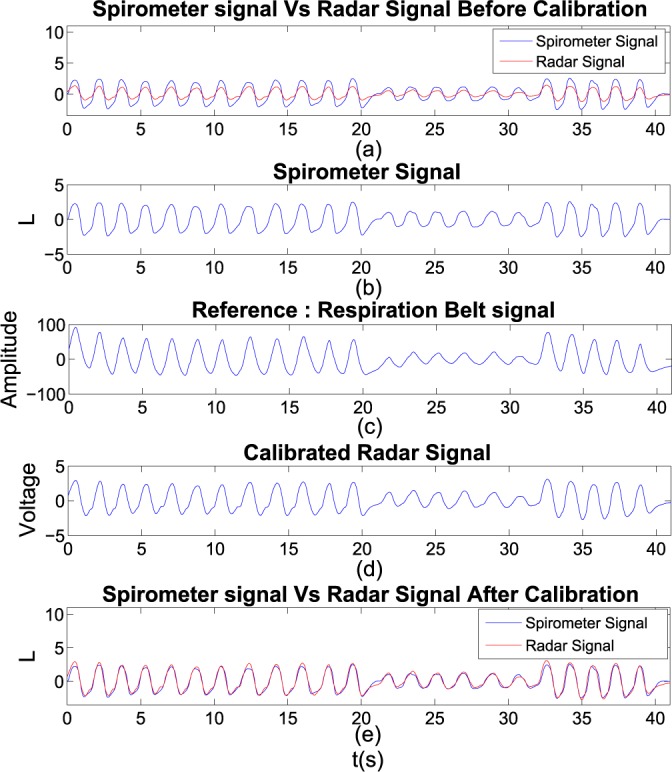
Experiment 3: Deep Breaths followed by Normal Breaths: (a) Filtered radar signal versus spirometer reading; (b) Spirometer reading; (c) Reference respiration belt signal; (d) Calibrated radar signal; and (e) Spirometer reading versus calibrated radar signal.
In all experiments, computation of mean square error (MSE) and correlation coefficients was performed between Doppler Radar signals and spirometer readings. Results show consistently high correlations between the Doppler radar and spirometer as shown in the Table 3. The MSE provides a measure of the exact fit between the Doppler radar signal to the reference model (spirometer data) where Pearson’s correlation coefficient shows how well the curves are related to each other which is shown in Figure 11. If the correlation coefficient is one, the Doppler radar tidal volume would be equal to the spirometer reading and always lie on the red line.
TABLE 3. Coefficient comparison on Doppler radar signal with spirometer.
| Comparison | MSE | Correlation Coefficient | |
|---|---|---|---|
| Experiment 1 | Non- Calibrate Radar Signal with Spirometer | 0.5867 | 0.9664 |
| Calibrated Radar Signal with Spirometer | 0.1064 | 0.9664 | |
| Experiment 2 | Non- Calibrate Radar Signal with Spirometer | 1.2306 | 0.9551 |
| Calibrated Radar Signal with Spirometer | 0.1939 | 0.9551 | |
| Experiment 3 | Non- Calibrate Radar Signal with Spirometer | 0.5023 | 0.9799 |
| Calibrated Radar Signal with Spirometer | 0.0739 | 0.9799 |
FIGURE 11.
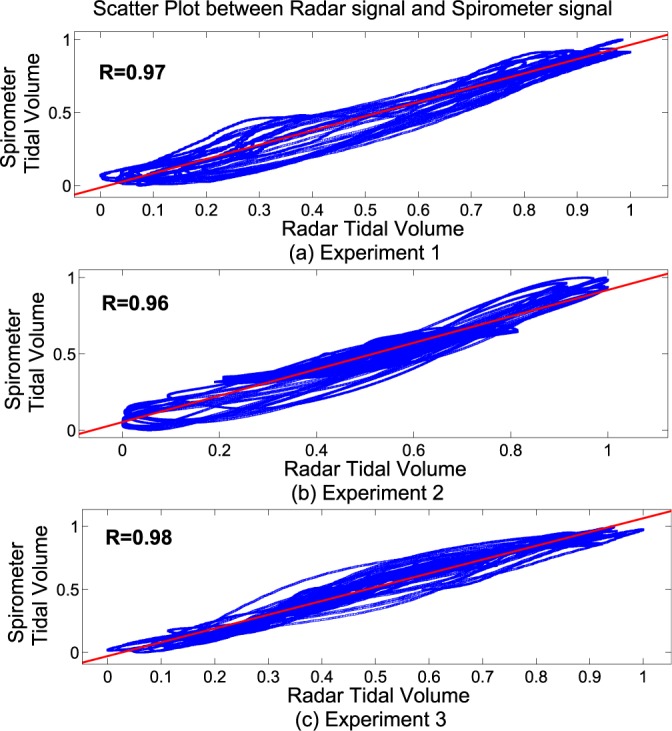
Scatter Plot between Radar signal and Spirometer reading: (from top to bottom: Experiment 1; Experiment 2; Experiment 3).
VII. Conclusion
The use of Doppler radar as a sensing mechanism for respiration detection and monitoring is particularly useful owing to its non-contact form of use. This eliminates the need to have any physical attachment or special clothing to the subject especially in long term sleep monitoring/studies - either in a sleep clinic or in home based healthcare applications (i.e, infant monitoring). Traditional and Widespread contact form of measurements such as chest straps and spirometers inevitably affect the natural breathing process of the subject as well as causing discomfort specially in longer term monitoring. Therefore, an effective non-contact form of measurement such as doppler radar is destined to impact the clinical approaches in respiratory monitoring.
In this paper, we have demonstrated the feasibility of Doppler radar in capturing different types of breathing patterns associated with different breathing disorders. Indeed the experiments were performed by professional role playing of known breathing patterns and not with real patients, yet the results are encouraging as an alternative to the standard respiratory belt measuring the same breathing patterns and the results also show that breathing is not always periodic and therefore purely spectral methods are not adequate. Frequency as a function of time is not the only important metric that can be extracted from the radar signal, for example; more detailed information can be obtained through the decomposition of breathing cycles into inhalation and exhalation components and respiration energy effort deduced from the received Doppler radar energy. Instead, the CWT is more suited for detailed analysis of breathing patterns.
We have also investigated the relationship between Doppler radar signal and air flow in and out due to inhalation and exhalation. In this work, we demonstrated the consistency of Doppler radar signal in capturing the change of flows caused by the inhalation and exhalation process under different conditions such as deep breathing, normal breathing and apnoea states as long as calibration is performed accurately. Also in sleep studies, different type of respiratory motion will have different impact on Doppler radar measurement where studies on such patterns could effectively be used to analyse other forms of physical movements during sleep.
Future work would be extended to involve real patient experiments as well as algorithms to classify corresponding disorders to its appropriate classes. Furthermore, from observations, the measurements based on reparation straps are affected by the belt interaction with the chest and questions the validity of the clinically used technique as a ground truth. Particularly when investigating how the expansion of chest can be modelled with the change of air flow in and out during the breathing activity would be better served with a non-contact form of respiratory function measurement. Therefore, any work on modelling the change in air flow in and out causing the expansion of chest/abdomen will more likely to be based on Doppler radar measurements in the future. Apart from that, isolation of motion artefacts is essential in order to increase the detection and measurement accuracy. Further, the placement of the sensor or multi sensor fusion are directly relevant research that could be aimed at increasing the detection and measurement accuracy in the face of noise and other form of uncertainty.
Acknowledgment
The authors would like to thank the editor and anonymous reviewers for their constructive comments.
Biographies

Yee Siong Lee received the B.E. and M.E. degrees in communication and computer engineering from the National Institute of Malaysia, Malaysia, in 2009 and 2010, respectively. He is currently pursuing the Ph.D. degree with Deakin University, VIC, Australia. His research interests include biomedical applications and signals processing, sensors networks, and radar signal processing.

Pubudu N. Pathirana (SM’08) was born in Matara, Sri Lanka, in 1970, and was educated at Royal College at Colombo, Colombo, Sri Lanka. He received the B.E. (Hons.) degree in electrical engineering and the B.Sc. degree in mathematics, and the Ph.D. degree in electrical engineering from the University of Western Australia, Crawley, WA, Australia, in 1996 and 2000, all sponsored by the government of Australia on EMSS and IPRS scholarships, respectively. He was a Post-Doctoral Research Fellow with Oxford University, Oxford, U.K., Research Fellow with the School of Electrical Engineering and Telecommunications, University of New South Wales, Sydney, NSW, Australia, and Consultant with the Defence Science and Technology Organization, Australia, in 2002. He was a Visiting Associate Professor with Yale University, New Haven, CT, USA, in 2009. He is currently an Associate Professor with the School of Engineering, Deakin University, VIC, Australia. His current research interests include mobile/wireless networks, rehabilitation robotics, and radar array signal processing.
Christopher Louis Steinfort is currently a Respiratory and Sleep Physician with University Hospital Geelong, Geelong, VIC, Australia. He received the M.B.B.S. degree from the University of Melbourne, Melbourne, VIC, in 1978. He is a fellow of the College Physicians, Australia, the Royal Australasian College of Physicians, Australia, and the American College of Chest Physicians. He is also the Director of the Geelong respiratory function and Sleep Medicine Laboratory while he has been a member of numerous societies, including the British, American, Australian, and New Zealand Thoracic Societies.

Terry Caelli (F’02) is currently a Senior Principal Researcher with National ICT Australia, Deakin University, VIC, Australia, and part of the Control and Signal Processing Research Group. He received the degree (Hons.) in mathematics and psychology and the Ph.D. degree in human and machine vision from the University of Newcastle, Callaghan, NSW, Australia. His expertise lies in human and machine signal processing, computer vision, and pattern recognition. He is a fellow of the International Association for Pattern Recognition. He has spent 15 years in North American universities and research institutes.
Funding Statement
This work was supported by the Australian Government through the ICT Centre of Excellence Program, National ICT Australia.
References
- [1].Cretikos M. A., Bellomo R., Hillman K., Chen J., Finfer S., and Flabouris A., “Respiratory rate: The neglected vital sign,” Med. J. Austral., vol. 188, no. , pp. 657–659, 2008. [DOI] [PubMed] [Google Scholar]
- [2].Cooper D. J. and Buist M. D., “Vitalness of vital signs, and medical emergency teams,” Med. J. Austral., vol. 188, no. 11, pp. 630–631, 2008. [DOI] [PubMed] [Google Scholar]
- [3].Yuan G., Drost N. A., and McIvor R. A., “Respiratory rate and breathing pattern,” McMaster Univ. Med. J., vol. 10, no. 1, pp. 23–28, 2013. [Google Scholar]
- [4].Oum J.-H., Kim D.-W., and Hong S., “Two frequency radar sensor for non-contact vital signal monitor,” in IEEE MTT-S Int. Microw. Symp. Dig., Jun. 2008, pp. 919–922. [Google Scholar]
- [5].Yan Y., Li C., Yu X., Weiss M. D., and Lin J., “Verification of a non-contact vital sign monitoring system using an infant simulator,” in Proc. Annu. Int. Conf. IEEE Eng. Med. Biol. Soc. (EMBC), Sep. 2009, pp. 4836–4839. [DOI] [PubMed] [Google Scholar]
- [6].Obeid D., Sadek S., Zaharia G., and El Zein G., “Touch-less heartbeat detection and cardiopulmonary modeling,” in Proc. 2nd Int. Symp. Appl. Sci. Biomed. Commun. Technol. (ISABEL), Nov. 2009, pp. 1–5. [Google Scholar]
- [7].Xu W., Gu C., Li C., and Sarrafzadeh M., “Robust Doppler radar demodulation via compressed sensing,” Electron. Lett., vol. 48, no. 22, pp. 1428–1430, Oct. 2012. [Online]. Available: http://link.aip.org/link/?ELL/48/1428/1 [Google Scholar]
- [8].Birsan N., Munteanu D., Iubu G., and Niculescu T., “Time-frequency analysis in Doppler radar for noncontact cardiopulmonary monitoring,” in Proc. E-Health Bioeng. Conf. (EHB), Nov. 2011, pp. 1–4. [Google Scholar]
- [9].Droitcour A. D., Boric-Lubecke O., and Kovacs G. T. A., “Signal-to-noise ratio in Doppler radar system for heart and respiratory rate measurements,” IEEE Trans. Microw. Theory Techn., vol. 57, no. 10, pp. 2498–2507, Oct. 2009. [Google Scholar]
- [10].Droitcour A. D., “Non-contact measurement of heart and respiration rates with a single-chip microwave Doppler radar,” Ph.D. dissertation, Dept. Elect. Eng, Stanford Univ, Stanford, CA, USA, 2006. [Google Scholar]
- [11].Gu C., et al. , “An instruments-built Doppler radar for sensing vital signs,” in Proc. 8th Int. Symp. Antennas, Propag. EM Theory (ISAPE), Nov. 2008, pp. 1398–1401. [Google Scholar]
- [12].Tariq A. and Ghafouri-Shiraz H., “Vital signs detection using Doppler radar and continuous wavelet transform,” in Proc. 5th Eur. Conf. Antennas Propag. (EUCAP), Apr. 2011, pp. 285–288. [Google Scholar]
- [13].Massagram W., Hafner N., Lubecke V., and Boric-Lubecke O., “Tidal volume measurement through non-contact Doppler radar with DC reconstruction,” IEEE Sensors J., vol. 13, no. 9, pp. 3397–3404, Sep. 2013. [Google Scholar]
- [14].Kuratomi Y., Okazaki N., Ishihara T., Arai T., and Kira S., “Variability of breath-by-breath tidal volume and its characteristics in normal and diseased subjects. Ventilatory monitoring with electrical impedance pneumography,” Jpn. J. Med., vol. 24, no. 2, pp. 141–149, 1985. [DOI] [PubMed] [Google Scholar]
- [15].Chokroverty S., Sleep Disorders Medicine. Amsterdam, The Netherlands: Elsevier, 2009. [Google Scholar]
- [16].Pathirana P. N., Herath S. C. K., and Savkin A. V., “Multitarget tracking via space transformations using a single frequency continuous wave radar,” IEEE Trans. Signal Process., vol. 60, no. 10, pp. 5217–5229, Oct. 2012. [Google Scholar]
- [17].Girbau D., Roldan A. M., Ramos A., and Villarino R., “Remote sensing of vital signs using a Doppler radar and diversity to overcome null detection,” IEEE Sensors J., vol. 12, no. 3, pp. 512–518, Mar. 2012. [Google Scholar]
- [18].Schafer R. W., “What is a Savitzky–Golay filter? [Lecture Notes],” IEEE Signal Process. Mag., vol. 28, no. 4, pp. 111–117, Jul. 2011. [Google Scholar]
- [19].Bergland G. D., “A guided tour of the fast Fourier transform,” IEEE Spectr., vol. 6, no. 7, pp. 41–52, Jul. 1969. [Google Scholar]
- [20].Chun-Lin L., A Tutorial of theWavelet Transform. Department of Electrical Engineering, National Taiwan University, Taipei, Taiwan: 2010. [Google Scholar]
- [21].Sinha S., Routh P. S., Anno P. D., and Castagna J. P., “Spectral decomposition of seismic data with continuous-wavelet transform,” Geophysics, vol. 70, no. 6, pp. P19–P25, 2005. [Google Scholar]
- [22].Walker H. K., Hall W. D., and Hurst J. W., Clinical Methods. Atlanta, GA, USA: Emory Univ. School Med, 1990. [Google Scholar]
- [23].Mosby, Mosby’s Medical Dictionary. Amsterdam, The Netherlands: Elsevier, 2009. [Google Scholar]
- [24].Kondo T., Uhlig T., Pemberton P., and Sly P. D., “Laser monitoring of chest wall displacement,” Eur. Respirat. J., vol. 10, no. 8, pp. 1865–1869, 1997. [DOI] [PubMed] [Google Scholar]
- [25].Gu C. 2.4 GHz Multifunctional Software-Defined Radar Sensor System. [Online]. Available: http://www.webpages.ttu.edu/chgu/resource.html, accessed Oct. 2012.


