Abstract
Melanoma spreads through metastasis, and therefore, it has been proved to be very fatal. Statistical evidence has revealed that the majority of deaths resulting from skin cancer are as a result of melanoma. Further investigations have shown that the survival rates in patients depend on the stage of the cancer; early detection and intervention of melanoma implicate higher chances of cure. Clinical diagnosis and prognosis of melanoma are challenging, since the processes are prone to misdiagnosis and inaccuracies due to doctors’ subjectivity. Malignant melanomas are asymmetrical, have irregular borders, notched edges, and color variations, so analyzing the shape, color, and texture of the skin lesion is important for the early detection and prevention of melanoma. This paper proposes the two major components of a noninvasive real-time automated skin lesion analysis system for the early detection and prevention of melanoma. The first component is a real-time alert to help users prevent skinburn caused by sunlight; a novel equation to compute the time for skin to burn is thereby introduced. The second component is an automated image analysis module, which contains image acquisition, hair detection and exclusion, lesion segmentation, feature extraction, and classification. The proposed system uses PH2 Dermoscopy image database from Pedro Hispano Hospital for the development and testing purposes. The image database contains a total of 200 dermoscopy images of lesions, including benign, atypical, and melanoma cases. The experimental results show that the proposed system is efficient, achieving classification of the benign, atypical, and melanoma images with accuracy of 96.3%, 95.7%, and 97.5%, respectively.
Keywords: Image segmentation, skin cancer, melanoma
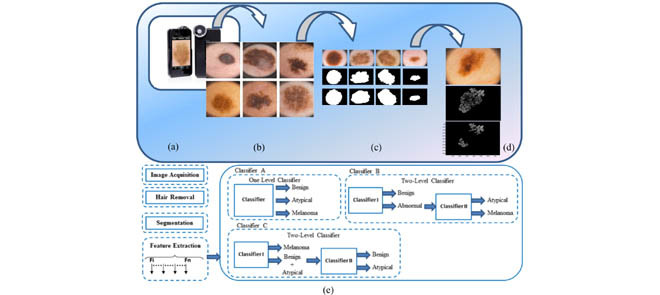
Figure 1. shows a few steps of the proposed dermoscopy image analysis system (a) iPhone dermotoscope, up to 20x magnification. (b) Sample of skin lesion, including normal lesion (first column), melanoma lesion (second column) and atypical lesion (third column). (c) Lesion segmentation results, original lesion (first row), lesion segmented by our algorithm (second row) and lesion segmented by dermatologists (third row). (d) Pigment network detection. (e) Proposed framework for dermoscopy image classification.
I. Introduction
A. Background and Motivation
Today, skin cancer has been increasingly identified as one of the major causes of deaths. Research has shown that there are numerous types of skin cancers. Recent studies have shown that there are approximately three commonly known types of skin cancers. These include melanoma, basal cell carcinoma (BCC), and squamous cell carcinomas (SCC). However, melanoma has been considered as one of the most hazardous types in the sense that it is deadly, and its prevalence has slowly increased with time. Melanoma is a condition or a disorder that affects the melanocyte cells thereby impeding the synthesis of melanin [1]. A skin that has inadequate melanin is exposed to the risk of sunburns as well as harmful ultra-violet rays from the sun [2]. Researchers claim that the disease requires early intervention in order to be able to identify exact symptoms that will make it easy for the clinicians and dermatologists to prevent it. This disorder has been proven to be unpredictable. It is characterized by development of lesions in the skin that vary in shape, size, color and texture.
Though most people diagnosed with skin cancer have higher chances to be cured, melanoma survival rates are lower than that of non-melanoma skin cancer [3]. As more new cases of skin cancer are being diagnosed in the U.S. each year, an automated system to aid in the prevention and early detection is highly in-demand [4]. Following are the estimations of the American Cancer Society for melanoma in the United States for the year 2014 [5]:
-
•
Approximately 76,100 new melanomas are to be diagnosed (about 43,890 in men and 32,210 in women).
-
•
Approximately 9,710 fatalities are expected as a result of melanoma (about 6,470 men and 3,240 women).
For 30 years, more or less, melanoma rates have been increasing steadily. It is 20 times more common for white people to have melanoma than in African-Americans. Overall, during the lifetime, the risk of developing melanoma is approximately 2% (1 in 50) for whites, 0.1% (1 in 1,000) for blacks, and 0.5% (1 in 200) for Hispanics.
Researchers have suggested that the use of non-invasive methods in diagnosing melanoma requires extensive training unlike the use of naked eye. In other words, for a clinician to be able to analyze and interpret features and patterns derived from dermoscopic images, they must undergo through extensive training [6]. This explains why there is a wide gap between trained and untrained clinicians. Clinicians are often discouraged to use the naked eye as it has previously led to wrong diagnoses of melanoma. In fact, scholars encourage them to embrace routinely the use of portable automated real time systems since they are deemed to be very effective in prevention and early detection of melanoma.
B. Contribution
This paper proposes the components of a novel portable (smart phone-based) noninvasive, real-time system to assist in the skin cancer prevention and early detection. A system to prevent this type of skin cancer is being awaited and is highly in-demand, as more new cases of melanoma are being diagnosed in the U.S. each year. The proposed system has two major components. The first component is a real-time alert to help users to prevent skin burn caused by sunlight; a novel equation to compute the time for skin to burn is thereby introduced. The second component is an automated image analysis which contains image acquisition, hair detection and exclusion, lesion segmentation, feature extraction, and classification, where the user will be able to capture the images of skin moles and our image processing module will classify under which category the moles fall into; benign, atypical, or melanoma. An alert will be provided to the user to seek medical help if the mole belongs to the atypical or melanoma category.
C. Paper Organization
The rest of this paper is organized as follows: Section II describes related work on skin cancer image recognition. Section III explains the components of the proposed system to assist in the skin cancer prevention and detection. Section IV presents the dermoscopy images analysis in detail. In Section V, we report the performance results. In Section VI, we conclude the paper with future work.
II. Related Work
Skin image recognition on smart phones has become one of the attractive and demanding research areas in the past few years. Karargyris et al. have worked on an advanced image-processing mobile application for monitoring skin cancer [7]. The authors presented an application for skin prevention using a mobile device. An inexpensive accessory was used for improving the quality of the images. Additionally, an advanced software framework for image processing backs the system to analyze the input images. Their image database was small, and consisted of only 6 images of benign cases and 6 images of suspicious case.
Doukas et al. developed a system consisting of a mobile application that could obtain and recognize moles in skin images and categorize them according to their brutality into melanoma, nevus, and benign lesions. As indicated by the conducted tests, Support Vector Machine (SVM) resulted in only 77.06% classification accuracy [8].
Massone et al. introduced mobile teledermoscopy: melanoma diagnosis by one click. The system provided a service designed toward management of patients with growing skin disease or for follow-up with patients requiring systemic treatment. Teledermoscopy enabled transmission of dermoscopic images through e-mail or particular web-application. This system lacked an automated image processing module and was totally dependable on the availability of dermatologist to diagnose and classify the dermoscopic images. Hence, it is not considered a real-time system [9].
Wadhawan et al. proposed a portable library for melanoma detection on handheld devices based on the well-known bag-of-features framework [10]. They showed that the most computational intensive and time consuming algorithms of the library, namely image segmentation and image classification, can achieve accuracy and speed of execution comparable to a desktop computer. These findings demonstrated that it is possible to run sophisticated biomedical imaging applications on smart phones and other handheld devices, which have the advantage of portability and low cost, and therefore, can make a significant impact on health care delivery as assistive devices in underserved and remote areas. However, their system didn’t allow the user to capture images using the smart phone.
Ramlakhan and Shang [11] introduced a mobile automated skin lesion classification system. Their system consisted of three major components: image segmentation, feature calculation, and classification. Experimental results showed that the system was not highly efficient, achieving an average accuracy of 66.7%, with average malignant class recall/sensitivity of 60.7% and specificity of 80.5%.
Upon a careful review of literature, it is clearly observed that regular users, patients, and dermatologist can benefit from a portable system for skin cancer prevention and early detection. Needless to say, one should note that at the moment, the work presented in this paper is the only proposed portable smart phone-based system that can accurately detect melanoma. Moreover, the proposed system can also detect atypical moles. Most of the prior work do not achieve high accuracy, or are not implemented on a portable smart phone device, and mainly do not have any prevention feature. This is where the need for a system including such features is seen.
III. Proposed System
In our proposed system, the following components are proposed, ( ) a real time alert based on a novel equation model to calculate the time for skin to burn to alert the user to avoid the sunlight and seek shade to prevent skin burn, (
 ) a real-time dermoscopy image analysis module to detect melanoma and atypical lesions. The image analysis module is explained in detail in the next Section.
A. Real Time Alert
Sunburn is a form of radiation burn that affects skin which results from an overexposure to ultraviolet (UV) radiation from the sun [12]. Normal symptoms in humans include red, painful skin that feels hot to the touch. Intense, repeated sun exposure that results in sunburn increases the risk of other skin damage and certain diseases. These include dry or wrinkled skin, dark spots, rough spots, and skin cancers, such as melanoma. It is important to note that unprotected exposure to UV radiation is the most threatening risk factor for skin cancer [13]. To help the users avoid skin burn caused by sun exposure, and hence, to prevent skin cancer, our system would calculate the time for skin to burn and the system will deliver a real time alert to the user to avoid the sunlight and seek shade to prevent developing skin cancer.
We created a model by deriving an equation to calculate the time for skin to burn namely, “Time to Skin Burn” (TTSB). This model is derived based on the information of burn frequency level and UV index level [14].
 |
 is the time-to-skin-burn based on skin type where UV index equals to 1. Table 1 shows time-to-skin-burn at UV index of 1for all skin types [15]. In Equation 1,
  is the ultraviolent index level ranging from 1 to 10, AL is the altitude in feet,
  represents snowy environment (Boolean value 0 or 1),
  represents cloudy weather (Boolean),
  represents sandy environment (Boolean),
  represents wet sand environment (Boolean),
  represents grass environment (Boolean),
  represents wet grass environment (Boolean),
  represents building environment (Boolean),
  represent shady environment (Boolean),
  represents water environment (Boolean) and
  is the sun protection factor weight. Table 3 shows SPFW for various sun protection factor (SPF) levels [16].
TABLE 1. Time to Skin Burn at UV Index of 1 for all Skin Types.
| Skin Type | Time to skin Burn at UV Index=l (minutes) |
|---|---|
| 1 | 67 |
| 2 | 100 |
| 3 | 200 |
| 4 | 300 |
| 5 | 400 |
| 6 | 500 |
TABLE 3. SPFW for Various (SPF) Levels.
| SPF Level | SPFW |
|---|---|
| 0 | 1 |
| 5 | 1.3 |
| 10 | 2.4 |
| 15 | 3.7 |
| 20 | 4.5 |
| 25 | 4.8 |
| 30 | 7.5 |
| 35 | 8.2 |
| 40 | 9.5 |
| 45 | 11.3 |
| 50 | 12.4 |
| 50+ | 13.7 |
The Boolean values are chosen based on the existence (1) or non-existence (0) of a certain weather condition or environment. The environmental factors indicate the amount of UV radiation that a particular weather condition or environment reflects [17], [18].
The environmental factors such as UV and AL, will be automatically inserted into the model by detecting the user location using the smart phone GPS. Other factors such as skin type, SPF levels, etc. can be manually selected by the user.
B. Validation of Time-to-Skin-Burn Model
The proposed TTSB model can be validated by cross checking the calculated TTSB values in Table 2 with the information provided by the National Weather Service Forecast [14]. Table 1 shows a sample of 10 cases, where the TTSB values are calculated using our model based on the UV index, skin type, environment variable and SPF level. As shown in Table 2, the calculated TTSB fall in the range of the data provided by the National Weather Service. To the best of our knowledge, this is the first model proposed that calculates the time-to-skin-burn based on the given UV index, skin type, environmental parameters and SPF, unlike [16]–[18] that only take into account only UV index and skin type.
TABLE 2. Calculated TTSB Values and Data Provided by the National Weather Service.
| UV index | Skin Type | Environment | SPF Level | TTSB (minutes) | National weather service (minutes) | |
|---|---|---|---|---|---|---|
| Case 1 | 3 | Light Skin | Snow | 10 | 39 | 35–45 |
| Case 2 | 9 | Medium Light Skin | Cloud | None | 22 | 18–28 |
| Case 3 | 5 | Fair light Skin | Water (sailing) | 30 | 58 | 50–60 |
| Case 4 | 2 | Medium Dark Skin | Sand | None | 104 | 100–110 |
| Case 5 | 8 | Dark skin | Grass (park) | 15 | 128 | 125–135 |
| Case 6 | 7 | Light Skin | Building (city) | 20 | 46 | 40–50 |
| Case 7 | 6 | Deep Dark skin | Sand | 5 | 75 | 70–80 |
| Case 8 | 1 | Fair light Skin | Snow | 40 | 303 | 300–310 |
| Case 9 | 4 | Dark skin | Cloud | None | 95 | 90–100 |
| Case 10 | 10 | Light Skin | Building (city) | 25 | 35 | 30–40 |
IV. Dermoscopy Images Analysis
Early detection of melanoma is one of the major factors to increase the chance of the cure significantly. Malignant melanomas lesions are asymmetrical and have irregular borders with notched edges. A considerable amount of research has been done in dermoscopy image analysis as we explained in the related work, however, the work presented in this paper is the only proposed system that can classify the dermoscopy images into three classes (i.e. benign, atypical and melanoma) using a two-level classifier, along with a TTSB module, all integrated in a portable system. In the dermoscopy image analysis component of the system, a complete system module from image acquisition to classification is proposed. The users will be able to use the system on their own smart phones by attaching a dermoscope to the phone’s camera. The users will capture images of their skin lesions using the smart phone camera. The system will analyze the image and inform the user if it is a benign lesion, atypical or melanoma. The image processing and classifications are done at the server side. The sever is located at the University of Bridgeport (UB), D-BEST lab, and thus the proposed system App does not require much processing power on the portable device side; only internet connection is needed to send the image to the server and receive the classification results. The system is important in the sense that it allows the users to detect melanoma at early stages which in turn increases the chance of cure significantly. Figure 1 shows the flow chart of the proposed dermoscopy image analysis system.
FIGURE 1.
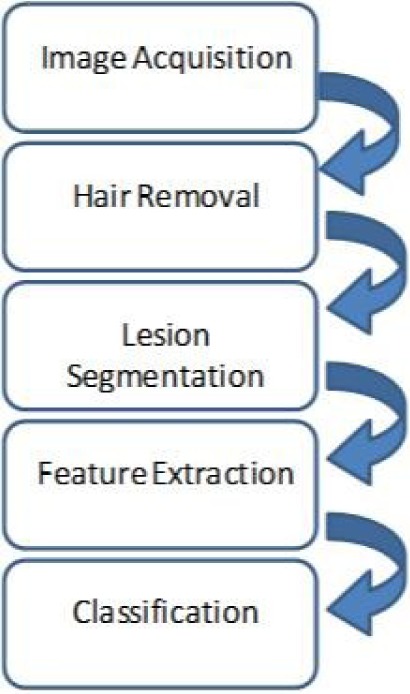
Flowchart for the proposed dermoscopy image analysis system.
A. Image Acquisition
The first stage of our automated skin lesion analysis system is image acquisition. This stage is essential for the rest of the system; hence, if the image is not acquired satisfactorily, then the remaining components of the system (i.e. hair detection and exclusion, lesion segmentation, feature extraction and classification) may not be achievable, or the results will not be reasonable, even with the aid of some form of image enhancement.
In order to capture high quality images, the iPhone 5S camera is used, equipped with 8 megapixels and  pixels. Using the iPhone camera solitary has some disadvantages since first, the size of the captured lesions will vary based on the distance between the camera and the skin, second, capturing the images in different light environments will be another challenge, and third, the details of the lesion will not be clearly visible. To overcome these challenges, a dermoscope is attached to the iPhone camera. Figure 2 shows the dermoscope device attached to the iPhone. The dermoscope provides the highest quality views of skin lesions. It has a precision engineered optical system with several lenses. This provides the right standardized zoom with auto-focus and optical magnification of up to
  directly to the camera of the iPhone device. Its shape ensures sharp imaging with a fixed distance to the skin and consistent picture quality. Also, it has a unique twin light system with six polarized and six white LEDs. This dermoscope combines the advantages of cross-polarized and immersion fluid dermoscopy. Figure 2 shows samples of images captured using the dermoscope attached to iPhone camera.
FIGURE 2.
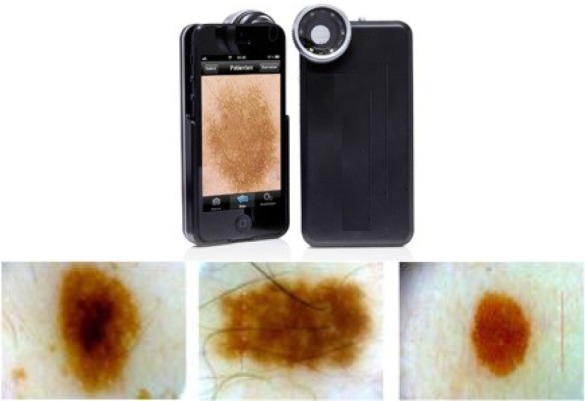
The dermoscope device attached to the iPhone and sample of images captured using the device.
B. Hair Detection and Exclusion
In dermoscopy images, if hair exists on the skin, it will appear clearly in the dermoscopy images. Consequently, lesions can be partially covered by body hair. Thus, hair can obstruct reliable lesion detection and feature extraction, resulting in unsatisfactory classification results. This section introduces an image processing technique to detect and exclude hair from the dermoscopy images as an essential step also seen in [19]–[33]. The result is a clean hair mask which can be used to segment and remove the hair in the image, preparing it for further segmentation and analysis.
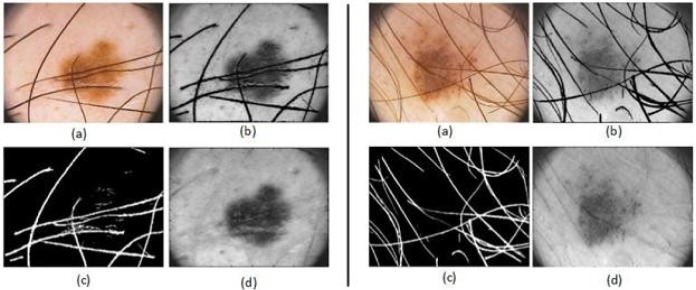
To detect and exclude the hair from the lesion, first, the hair is segmented form the lesion. To accomplish this task, a set of 84 directional filters are used. These filters are constructed by subtracting a directional Gaussian filter (in one axis sigma of Gaussian is high and in other axis sigma is low) from an isotropic filter (sigma is higher in both axes). Later, these filters are applied to the dermoscopy images. After segmenting the hair mask, the image is reconstructed to fill the hair gap with actual pixels. To reconstruct the image, the system scans for the nearest edge pixels in 8 directions, considering the current pixel is inside the region to fill. These 8 edge pixels of hair region are found and the mean value of these 8 pixels is stored as pixel value of hair pixel [34]. Figure 3 illustrates the process of hair segmentation and exclusion.
FIGURE 3.
Illustration of two samples for hair detection, exclusion and reconstruction, (a) the original image, (b) the gray image before hair detection and exclusion, (c) the hair mask (d) the gray image after hair detection, exclusion and reconstruction applied.
C. Image Segmentation
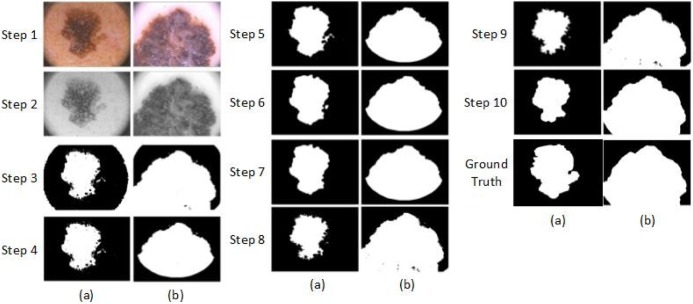
Pigmented skin lesion segmentation to separate the lesion from the background is an essential process before starting with the feature extraction in order to classify the three different types of lesion (i.e. benign, atypical and melanoma) as seen in [35]–[41]. The segmentation step follow as: First, RGB dermoscopy image is read (See Figure 4, Step 1) and converted to a gray scale image. It is done by forming a weighted sum of the R, G, and B components as  . Then, a two dimensional Gaussian low-pass filter is generated by Equations 2 and 3
[42].
 |
where  is a 2-D filter of size
  ,
,  , and sigma is 0.5. The filtered image is given in Figure 4, Step 2. After the Gaussian filter is applied, a global threshold is computed by Otsu’s method [43] to be used to convert an intensity image to a binary image. Otsu’s method chooses the threshold to minimize the intra-class variance of the background and foreground pixels. This directly deals with the problem of evaluating the goodness of thresholds. An optimal threshold is selected by the discriminant criterion. The resulting image is given in Figure 4, Step 3.
FIGURE 4.
Steps of the proposed dermoscopy image segmentation algorithm applied to two images (a) and (b).
Step 4 removes the white corners in the dermoscopy image. In order to do this, the resulting image in the previous step is masked by Mask1 that is defined in Figure 5. All white pixels in the corners are replaced with black pixels.
FIGURE 5.
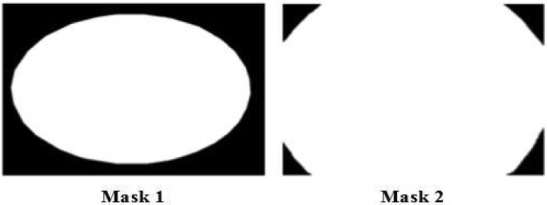
Mask 1 and Mask 2, used in the segmentation algorithm to prepare the image for the initial state of the active contour and to remove the corners.
After applying the threshold, the edges of the output image become irregular. To smoothen the edges, morphological operation is used. A disk-shaped structure element is created by using a technique called radial decomposition using periodic lines [44], [45]. The disk structure element is created to preserve the circular nature of the lesion. The radius is specified as 11 pixels so that the large gaps can be filled. Then, the disk structure element is used to perform a morphological closing operation on the image. Step 5 in Figure 4 shows the resulting image.
Next, the morphological open operation is applied to the binary image. The morphological open operation is erosion followed by dilation; the same disk structure element that was created in the previous step is used for both operations. See Figure 4, step 6.
In the next step, an algorithm is used to fill the holes in the binary image. A hole is a set of background pixels that cannot be reached by filling in the background from the edge of the image. Figure 4, step 7 shows the outcome image.
In the next step, an algorithm is applied based on active contour [25] to segment the gray scale image, which is shown in Figure 4, step 4. The active contour algorithm segments the 2-D gray scale image into foreground (lesion) and background regions using active contour based segmentation. The active contour function uses the image shown in Figure 4, step 7 as a mask to specify the initial location of the active contour. This algorithm uses the Sparse-Field level-set method [46] for implementing active contour evolution. It also stops the evolution of the active contour if the contour position in the current iteration is the same as one of the contour positions from the most recent five iterations, or if the maximum number of iterations (i.e. 400) has been reached. The output image is a binary image where the foreground is white and the background is black, shown in Figure 4, step8.
The next step is to remove the small objects. To do that, first, the connected components are determined. Second, the area of each component is computed. Third, all small objects that have fewer than 50 pixels are removed. This operation is known as area opening. Figure 4, step 9 shows the outcome image. Finally the disk structure element that was created in the previous step is used to perform a morphological close and open operation. After that, the resulting image is masked with Mask2 to preserve the corners (Figure 5, Mask2). Figure 4, step 10 shows the final binary mask that used to mask the images.
D. Feature Extraction
Feature extraction is the process of calculating parameters that represent the characteristics of the input image, whose output will have a direct and strong influence on the performance of the classification systems as seen in [32] and [47]–[49]. In this study, five different feature sets are calculated. These are 2-D Fast Fourier Transform (4 parameters), 2-D Discrete Cosine Transform (4 parameters), Complexity Feature Set (3 parameters), Color Feature Set (64 parameters) and Pigment Network Feature Set (5 parameters). In addition to the five feature sets, the following four features are also calculated: Lesion Shape Feature, Lesion Orientation Feature, Lesion Margin Feature and Lesion Intensity Pattern Feature.
1). 2-D Fast Fourier Transform
The 2-D Fast Fourier Transform (FFT) [50] feature set is calculated. The 2-D FFT feature set includes the first coefficient of FFT2, the first coefficient of the cross-correlation [51] of the first 20 rows and columns of FFT2, the mean of the first 20 rows and columns of FFT2, and the standard deviation of the first 20 rows and columns of FFT2.
2). 2-D Discrete Cosine Transform
A 2-D Discrete Cosine Transform (DCT) [52] expresses a finite sequence of data points in terms of a sum of cosine functions oscillating at different frequencies. The 2-D DCT feature set includes the first coefficient of DCT2, the first coefficient of the cross-correlation of the first 20 rows and columns of DCT2, the mean of the first 20 rows and columns of DCT2 and the standard deviation of the first 20 rows and columns of DCT2.
3). Complexity Feature Set
The complexity feature set includes the mean (Equation 4), standard deviation (Equation 5), and mode based on the intensity value of the Region of Interest (ROI).
 |
where  is the mean,
  is the standard deviation,
  is the intensity value of pixel
  and
and  is the pixels count.
4). Color Feature Set
Color features in dermoscopy are important. Typical images consist of three-color channels that are red blue and green. Use of color is another method to assess melanoma risks. Usually, melanoma lesions have the tendency to change color intensely making the affected region to be irregular. For the color feature set the 3-D histogram of the components of the LAB color model is calculated. In order to get the 2-D color histogram from the 3-D color histogram, all values in the illumination axis are accumulated. As a result,  color bins are generated, each considered as one feature.
5). Pigment Network Feature Set
Pigment network is produced by melanin or melanocytes in basal keratinocytes. The pigment network is the most important structure in dermoscopy. It appears as a network of thin brown lines over a diffuse light brown background. Dense pigment rings (the network) are due to projections of rete pegs or ridges. The holes are due to projections of dermal papillae. The pigment network is found in some atypical and melanoma lesions. In some sites the network is widened. It does not have to occupy the whole lesion [53].
To extract the pigment network feature, first, the network is segmented from the lesion, to accomplish this task; a set of 12 directional filters is designed. These filters are constructed by subtracting a directional Gaussian filter (in one axis sigma of Gaussian is high and in other axis sigma is low) from an isotropic filter (sigma is higher in both axes). Later, these filters are applied to the dermoscopy images [34].
Figure 6 shows an example of pigment network detection process for an atypical lesion. The feature set includes five parameters that are calculated from the detected pigment network as follows:
FIGURE 6.
Example of a pigment network detection process, (a) the original image, (b) the result image after applying the directional filter, (c) the result image after removing the small objects.
a: Pigment Network Area VS. Lesion Area Ratio ( )
)
This feature compares the ratio between the pigment network area and the lesion area where  is the area of the detected pigment network, and
  is the area of the segmented lesion.
 |
b: Pigment Network Area VS. Filled Network Area Ratio ( )
)
This feature compares the ratio between the pigment network area and the filled network area (Equation 7).
c: Total Number of Holes in the Pigment Network ( )
)
This feature computes the total number of holes in the pigment network (Equation 8):
 |
where  represents the hole in the pigment network.
d: Total Number of Holes in the Pigment Network VS. Lesion Area Ratio ( )
)
This feature compares the ratio between the total number of holes in the pigment network and the lesion area (Equation 9).
e: Total Number of Holes in the Pigment Network VS. Filled Network Area Ratio ( )
)
This feature compares the ratio between total number of holes in the pigment network and the filled network area (Equation 10):
 |
6). Lesion Shape Feature
The best-fit ellipse is used to approximately portray the lesion shape and is considered as the baseline for calculating the degree of irregularity as shown in Figure 7. For any pixel  on the lesion boundary, a crossing pixel
  on the best-fit ellipse is found by a beam that starts at the center of best-fit ellipse. The variation between
  and
and  is then calculated by their distance:
 |
FIGURE 7.
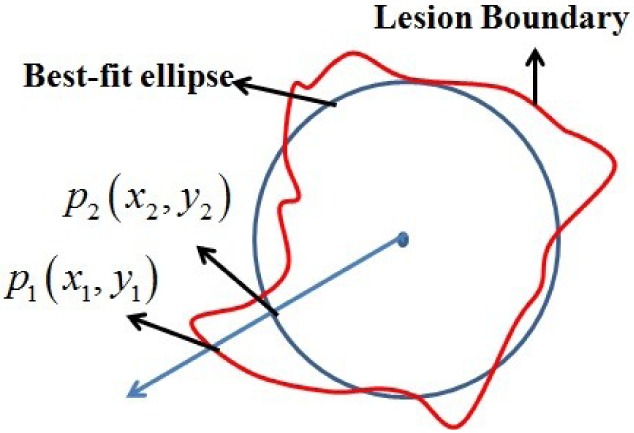
The irregularity of the lesion shape is estimated by the variation between the lesion boundary and corresponding best-fit ellipse.
Then, the lesion shape feature is calculated by the variation between the lesion shape and the best-fit ellipse as the following:
 |
where  is any pixel on the lesion boundary and
  represents the total number of pixels on the lesion boundary.
7). Lesion Orientation Feature
The orientation of the lesion is measured by the angle of the main axis of the above best-fit ellipse as shown in Figure 8. The range of lesion orientation is defined between 0 and  as the following:
 |
FIGURE 8.
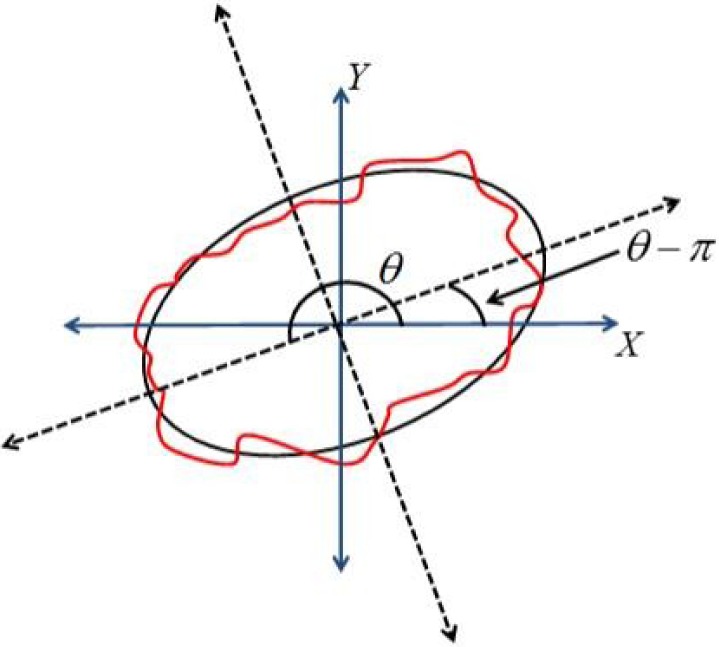
The orientation of the lesion measured by the angle of major axis of best-fit ellipse.
8). Lesion Margin Feature
The distance map is used to capture the undulation and the angular characteristics of the lesion margin. For any pixel  in the ROI, its eight neighbors are defined as the following.
 |
The distance from  to the lesion boundary is recursively defined as the following,
 |
where  denotes the minimum of known distance in
  ’
’ eight neighbors.
9). Lesion Intensity Pattern Feature
The average gray intensity of the lesion is used to represent the intensity pattern feature. The average gray intensity pattern  is defined as:
 |
where  is the gray intensity of lesion pixel
  and
and  represents the number of lesion pixels.
10). Lesion Variation Pattern Feature
The variation on pixel  is estimated by the gradient magnitude. According to the definition of neighbors in Equation 8, the Sobel gradients [54] on
  -direction and
  -direction of pixel
  are respectively defined as:
 |
And
 |
Then, the gradient magnitude on  is defined as:
 |
Finally, the average variation pattern is calculated as:
 |
E. Classification
Lesion classification is the final step. There are several existing systems that apply various classification methods as seen in [47], [55], and [56]. A framework of the proposed work is illustrated in Figure 9. In this framework, three types of classifiers are proposed, i.e. one level classifier (classifier A) and two-level classifiers (classifier B and C). The first stage of this framework is to perform image processing to detect and exclude the hair, after that the ROI of the skin lesion is segmented. Then, the image features are extracted. Next, the extracted features are fed to the classifiers.
FIGURE 9.
Proposed framework for dermoscopy image classification.
1). Classifier A
This classifier is a one level classifier; one classifier is proposed to classify the image into three categories, benign, atypical or melanoma. All extracted features are fed into this classifier in order to classify the input image.
2). Classifier B
This classifier is a two level classifier, two classifiers are proposed, i.e. classifier I and classifier II. Classifier I classifies the image into benign or abnormal, and classifier II classifies the abnormal image into atypical or melanoma.
3). Classifier C
This classifier is a two level classifier, two classifiers are proposed, i.e. classifier I and classifier II. Classifier I detects melanoma and classifies the image into melanoma or (benign and atypical), and classifier II classifies the images into benign or atypical.
The two-level classifiers approach gives better results compared to the one level classifier, as explained in the experimental results section. Support Vector Machines (SVM) classifier is used in all classifiers. The SVM was developed by Vapnik [57] and has become a popular classifier algorithm recently because of its promising performance on different type of studies. The SVM is based on structural risk minimization where the aim is to find a classifier that minimizes the boundary of the expected error [58]. In other words, it seeks a maximum margin separating the hyperplane and the closest point of the training set between two classes of data [59]. In the experiments the publicly available implementation LibSVM [60] is used with radial basis function (RBF) kernel since it yielded higher accuracies in the cross-validation compared to other kernels. The grid search procedure is used to determine the value of C and gamma for the SVM kernel.
V. Experimental Results
In the proposed system, the PH2 dermoscopic image database from Pedro Hispano hospital is used for the system development and for testing purposes [61]. The dermoscopic images were obtained under the same conditions using a magnification of  . This image database contains of a total of 200 dermoscopic images of lesions, including 80 benign moles, 80 atypical and 40 melanomas. They are 8-bit RGB color images with a resolution of
  pixels. Because the database is anonymous and is used for training purposes, no IRB approval was required for this study. The images in this database are similar to the images captured by the proposed system. We decided to use this database for implementation and test plan since it is verified and established by a group of dermatologists. Figure 10 shows an example of images from the PH2 database and images captured by the proposed system. In the experiments, 75% of the database images are used for training and 25% are used for testing.
FIGURE 10.
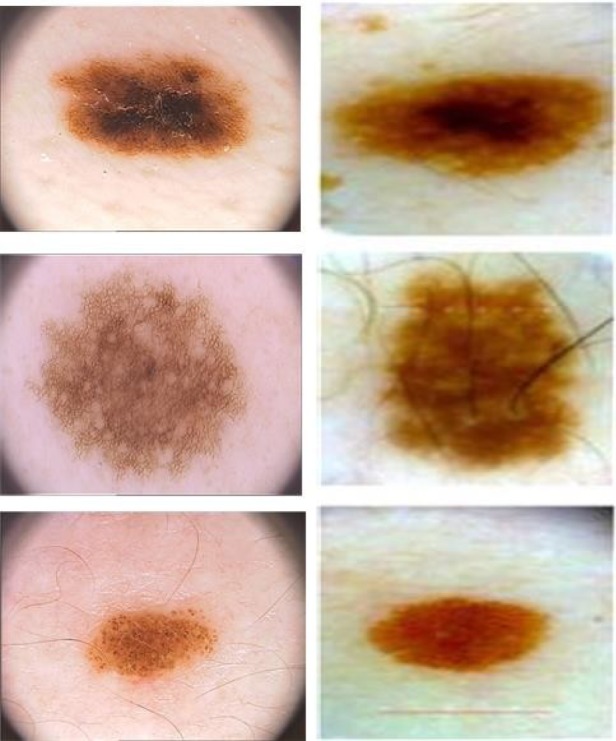
Sample of images from PH2 database (first column), and images captured by the proposed device (second column).
The proposed framework compared three types of classifiers. Consequently, Classifier B outperform classifiers A and C. Classifier A was able to classify the benign, atypical and melanoma images with accuracy of 93.5%, 90.4% and 94.3% respectively. On the other hand, the two-level Classifier B was able to classify the dermoscopy images with accuracy of 96.3%, 95.7% and 97.5% respectively. This is while the two-level Classifier C was able to classify the dermoscopy images with accuracy of 88.6%, 83.1% and 100% respectively. Table 4 shows the confusion matrix results for Classifier A. Table 5 shows the confusion matrix for Classifier B (classifier I and classifier II). Table 6 shows the confusion matrix results for Classifier C (classifier I and classifier II).
TABLE 4. Confusion Matrix for Classifier A.
| Predicted class (%) | ||||
|---|---|---|---|---|
| Benign | Atypical | Melanoma | ||
| Actual Class | Benign | 93.5 | 6.5 | 0 |
| Atypical | 9.6 | 90.4 | 0 | |
| Melanoma | 0 | 5.7 | 94.3 | |
TABLE 5. Confusion Matrix for Classifier B (Classifier I and Classifier II).
| Classifier I (%) | Classifier II (%) | ||||
| B | Ab | ||||
| Benign (B) | 96.3 | 3.7 | |||
| Abnormal (Ab) | 2.5 | 97.5 | At | M | |
| Atypical (At) | 95.7 | 4.3 | |||
| Melanoma (M) | 2.5 | 97.5 | |||
TABLE 6. Confusion Matrix for Classifier C (Classifier I and Classifier II).
| Classifier I (%) | Classifier II (%) | ||||
| M | B+At | ||||
| Melanoma (M) | 100 | 0 | |||
| Benign + Atypical (B+At) | 8.5 | 91.5 | B | At | |
| Benign (B) | 88.6 | 11.4 | |||
| Atypical (At) | 16.9 | 83.1 | |||
The smart-phone application for the proposed model has been developed and is fully functional. In addition, a pilot study on 100 subjects has been conducted to capture lesions that appear on the subjects’ skin. This study contains of a total of 160 dermoscopic images of lesions, including 140 benign moles, 15 atypical and 5 melanomas. They are 8-bit RGB color images with a resolution of  pixels. Because the database is anonymous and is used for training purposes, no IRB approval was required for this study. The results have been validated by a physician from the health sciences department at the University of Bridgeport, adding to the effectiveness and feasibility of the proposed integrated system. In this experiment we were able to classify the benign, atypical and melanoma images with accuracy of 96.3%, 95.7% and 97.5% respectively. The experimental results show that the proposed system is efficient, achieving very high classification accuracies. A video for the developed smart-phone application can be found at http://youtu.be/ahIY3G_ToFY.
VI. Conclusion and Future Work
The incidence of skin cancers has reached a large number of individuals within a given population, especially among whites, and the trend is still rising. Early detection is vital, especially concerning melanoma, because surgical excision currently is the only life-saving method for skin cancer.
This paper presented the components of a system to aid in the malignant melanoma prevention and early detection. The proposed system has two components. The first component is a real-time alert to help the users to prevent skin burn caused by sunlight. In this part, a novel equation to compute the time-to-skin-burn was introduced. The second component is an automated image analysis module where the user will be able to capture the images of skin moles and this image processing module classifies under which category the moles fall into; benign, atypical, or melanoma. An alert will be provided to the user to seek medical help if the mole belongs to the atypical or melanoma category. The proposed automated image analysis process included image acquisition, hair detection and exclusion, lesion segmentation, feature extraction, and classification.
The state of the art is used in the proposed system for the dermoscopy image acquisition, which ensures capturing sharp dermoscopy images with a fixed distance to the skin and consistent picture quality. The image processing technique is introduced to detect and exclude the hair from the dermoscopy images, preparing it for further segmentation and analysis, resulting in satisfactory classification results. In addition, this work proposes an automated segmentation algorithm and novel features.
This novel framework is able to classify the dermoscopy images into benign, atypical and melanoma with high accuracy. In particular, the framework compares the performance of three proposed classifiers and concludes that the two-level classifier outperforms the one level classifier.
Future work would focus on clinical trials of the proposed system with several subjects over a long period of time to overcome the possible glitches and further optimize the performance. Another interesting research direction is to investigate the correlation between skin burn caused by sunlight and neural activity in the brain.
Biographies

Omar Abuzaghleh (S’12) received the M.S. degree in computer science from the School of Engineering, University of Bridgeport, CT, in 2007. He earned his Ph.D. degree in computer science and engineering from the University of Bridgeport, CT in March 2015. He is currently an Adjunct Faculty with the Computer Science and Engineering Department, University of Bridgeport. His research interests include image processing, virtual reality, human–computer interaction, cloud computing, and distributed database management. He is a member of several professional organizations and specialty labs, including ACM, IEEE, the International Honor Society for the Computing and Information Disciplines, and the Digital/Biomedical Embedded Systems and Technology Laboratory.

Buket D. Barkana (M’09) received the B.S. degree in electrical engineering from Anadolu University, Turkey, and the M.Sc. and Ph.D. degrees in electrical engineering from Eskisehir Osmangazi University, Turkey. She is currently an Associate Professor with the Electrical Engineering Department, University of Bridgeport, CT. She is also the Director of the Signal Processing Research Group Laboratory with the Electrical Engineering Program, University of Bridgeport. Her research areas span all aspects of speech, audio, biosignal processing, image processing, and coding.

Miad Faezipour (S’06–M’10) received the B.Sc. degree from the University of Tehran, Tehran, Iran, and the M.Sc. and Ph.D. degrees from the University of Texas at Dallas, all in electrical engineering. She has been a Post-Doctoral Research Associate, where she was collaborating with the University of Texas at Dallas, where she was collaborating with the Center for Integrated Circuits and Systems and Quality of Life Technology Laboratories. She is an Assistant Professor with the Computer Science and Engineering Department and the Biomedical Engineering Department, University of Bridgeport, CT, and has also been the Director of the Digital/Biomedical Embedded Systems and Technology Laboratory since 2011. Her research interests lie in the broad area of biomedical signal processing and behavior analysis techniques, high-speed packet processing architectures, and digital/embedded systems. She is a member of the Engineering in Medicine and Biology Society and the IEEE Women in Engineering.
References
- [1].Suer S., Kockara S., and Mete M., “An improved border detection in dermoscopy images for density based clustering,” BMC Bioinformat., vol. 12, no. , p. S12, 2011. [DOI] [PMC free article] [PubMed] [Google Scholar]
- [2].Rademaker M. and Oakley A., “Digital monitoring by whole body photography and sequential digital dermoscopy detects thinner melanomas,” J. Primary Health Care, vol. 2, no. 4, pp. 268–272, 2010. [PubMed] [Google Scholar]
- [3].Abuzaghleh O., Barkana B. D., and Faezipour M., “SKINcure: A real time image analysis system to aid in the malignant melanoma prevention and early detection,” in Proc. IEEE Southwest Symp. Image Anal. Interpretation (SSIAI), Apr. 2014, pp. 85–88. [Google Scholar]
- [4].Abuzaghleh O., Barkana B. D., and Faezipour M., “Automated skin lesion analysis based on color and shape geometry feature set for melanoma early detection and prevention,” in Proc. IEEE Long Island Syst., Appl. Technol. Conf. (LISAT), May 2014, pp. 1–6. [Google Scholar]
- [5].(Mar. 27, 2014). American Cancer Society, Cancer Facts & Figures. [Online]. Available: http://www.cancer.org/research/cancerfactsstatistics/cancerfactsfigures2014/index
- [6].Braun R. P., Rabinovitz H., Tzu J. E., and Marghoob A. A., “Dermoscopy research—An update,” Seminars Cutaneous Med. Surgery, vol. 28, no. 3, pp. 165–171, 2009. [DOI] [PubMed] [Google Scholar]
- [7].Karargyris A., Karargyris O., and Pantelopoulos A., “DERMA/Care: An advanced image-processing mobile application for monitoring skin cancer,” in Proc. IEEE 24th Int. Conf. Tools Artif. Intell. (ICTAI), Nov. 2012, pp. 1–7. [Google Scholar]
- [8].Doukas C., Stagkopoulos P., Kiranoudis C. T., and Maglogiannis I., “Automated skin lesion assessment using mobile technologies and cloud platforms,” in Proc. Annu. Int. Conf. IEEE Eng. Med. Biol. Soc. (EMBC), Aug./Sep. 2012, pp. 2444–2447. [DOI] [PubMed] [Google Scholar]
- [9].Massone C., Brunasso A. M., Campbell T. M., and Soyer H. P., “Mobile teledermoscopy—Melanoma diagnosis by one click?” Seminars Cutaneous Med. Surgery, vol. 28, no. 3, pp. 203–205, 2009. [DOI] [PubMed] [Google Scholar]
- [10].Wadhawan T., Situ N., Lancaster K., Yuan X., and Zouridakis G., “SkinScan: A portable library for melanoma detection on handheld devices,” in Proc. IEEE Int. Symp. Biomed. Imag., Nano Macro, Mar./Apr. 2011, pp. 133–136. [DOI] [PMC free article] [PubMed] [Google Scholar]
- [11].Ramlakhan K. and Shang Y., “A mobile automated skin lesion classification system,” in Proc. 23rd IEEE Int. Conf. Tools Artif. Intell. (ICTAI), Nov. 2011, pp. 138–141. [Google Scholar]
- [12].Whiteman D. and Green A., “Melanoma and sunburn,” Cancer Causes Control, vol. 5, no. 6, pp. 564–572, 1994. [DOI] [PubMed] [Google Scholar]
- [13].Poulsen M., et al. , “High-risk Merkel cell carcinoma of the skin treated with synchronous carboplatin/etoposide and radiation: A Trans-Tasman Radiation Oncology Group study—TROG 96:07,” J. Clin. Oncol., vol. 21, no. 23, pp. 4371–4376, 2003. [DOI] [PubMed] [Google Scholar]
- [14].(Dec. 12, 2012). National Weather Service Forecast. [Online]. Available: http://www.erh.noaa.gov/ilm/beach/uv/mintoburn.shtml
- [15].(May 14, 2014). HIMAYA Sport Sunscreens USA. [Online]. Available: http://www.himaya.com/solar/uvindex.html
- [16].Dutra E. A., da Costa e Oliveira D. A. G., Kedor-Hackmann E. R. M., and Santoro M. I. R. M., “Determination of sun protection factor (SPF) of sunscreens by ultraviolet spectrophotometry,” Revista Brasileira Ciências Farmacêuticas, vol. 40, no. 3, pp. 381–385, 2004. [Google Scholar]
- [17].Madronich S., “The atmosphere and UV-B radiation at ground level,” in Environmental UV Photobiology. New York, NY, USA: Springer-Verlag, 1993, pp. 1–39. [Google Scholar]
- [18].Herman J. R., Bhartia P. K., Torres O., Hsu C., Seftor C., and Celarier E., “Global distribution of UV-absorbing aerosols from Nimbus 7/TOMS data,” J. Geophys. Res., Atmos., vol. 102, pp. 16911–16922, Jul. 1997. [Google Scholar]
- [19].Barcelos C. A. Z. and Pires V. B., “An automatic based nonlinear diffusion equations scheme for skin lesion segmentation,” Appl. Math. Comput., vol. 215, no. 1, pp. 251–261, 2009. [Google Scholar]
- [20].Debeir O., Decaestecker C., Pasteels J. L., Salmon I., Kiss R., and Van Ham P., “Computer-assisted analysis of epiluminescence microscopy images of pigmented skin lesions,” Cytometry, vol. 37, no. 4, pp. 255–266, 1999. [PubMed] [Google Scholar]
- [21].Wighton P., Lee T. K., and Atkins M. S., “Dermascopic hair disocclusion using inpainting,” Proc. SPIE, vol. 6914, pp. 691427V-1–691427V-8, Mar. 2008. [Google Scholar]
- [22].Lee T., Ng V., Gallagher R., Coldman A., and McLean D., “DullRazor: A software approach to hair removal from images,” Comput. Biol. Med., vol. 27, no. 6, pp. 533–543, 1997. [DOI] [PubMed] [Google Scholar]
- [23].Kiani K. and Sharafat A. R., “E-shaver: An improved DullRazor for digitally removing dark and light-colored hairs in dermoscopic images,” Comput. Biol. Med., vol. 41, no. 3, pp. 139–145, 2011. [DOI] [PubMed] [Google Scholar]
- [24].Zhou H., et al. , “Feature-preserving artifact removal from dermoscopy images,” Proc. SPIE, vol. 6914, p. 69141B, Mar. 2008. [Google Scholar]
- [25].Abbas Q., Garcia I. F., Celebi M. E., and Ahmad W., “A feature-preserving hair removal algorithm for dermoscopy images,” Skin Res. Technol., vol. 19, no. 1, pp. e27–e36, 2013. [DOI] [PubMed] [Google Scholar]
- [26].Wighton P., Lee T. K., Lui H., McLean D. I., and Atkins M. S., “Generalizing common tasks in automated skin lesion diagnosis,” IEEE Trans. Inf. Technol. Biomed., vol. 15, no. 4, pp. 622–629, Jul. 2011. [DOI] [PubMed] [Google Scholar]
- [27].Abbas Q., Celebi M. E., and García I. F., “Hair removal methods: A comparative study for dermoscopy images,” Biomed. Signal Process. Control, vol. 6, no. 4, pp. 395–404, 2011. [Google Scholar]
- [28].Xie F.-Y., Qin S.-Y., Jiang Z.-G., and Meng R.-S., “PDE-based unsupervised repair of hair-occluded information in dermoscopy images of melanoma,” Comput. Med. Imag. Graph., vol. 33, no. 4, pp. 275–282, 2009. [DOI] [PubMed] [Google Scholar]
- [29].Nguyen N. H., Lee T. K., and Atkins M. S., “Segmentation of light and dark hair in dermoscopic images: A hybrid approach using a universal kernel,” Proc. SPIE, vol. 7623, p. 76234N, Mar. 2010. [Google Scholar]
- [30].Fleming M. G., et al. , “Techniques for a structural analysis of dermatoscopic imagery,” Comput. Med. Imag. Graph., vol. 22, no. 5, pp. 375–389, 1998. [DOI] [PubMed] [Google Scholar]
- [31].Schmid-Saugeon P., Guillod J., and Thiran J.-P., “Towards a computer-aided diagnosis system for pigmented skin lesions,” Comput. Med. Imag. Graph., vol. 27, no. 1, pp. 65–78, 2003. [DOI] [PubMed] [Google Scholar]
- [32].Møllersen K., Kirchesch H. M., Schopf T. G., and Godtliebsen F., “Unsupervised segmentation for digital dermoscopic images,” Skin Res. Technol., vol. 16, no. 4, pp. 401–407, 2010. [DOI] [PubMed] [Google Scholar]
- [33].Abbas Q., Fondon I., and Rashid M., “Unsupervised skin lesions border detection via two-dimensional image analysis,” Comput. Methods Programs Biomed., vol. 104, no. 3, pp. e1–e15, 2011. [DOI] [PubMed] [Google Scholar]
- [34].Barata C., Marques J. S., and Rozeira J., “A system for the detection of pigment network in dermoscopy images using directional filters,” IEEE Trans. Biomed. Eng., vol. 59, no. 10, pp. 2744–2754, Oct. 2012. [DOI] [PubMed] [Google Scholar]
- [35].Erkol B., Moss R. H., Stanley R. J., Stoecker W. V., and Hvatum E., “Automatic lesion boundary detection in dermoscopy images using gradient vector flow snakes,” Skin Res. Technol., vol. 11, no. 1, pp. 17–26, 2005. [DOI] [PMC free article] [PubMed] [Google Scholar]
- [36].Celebi M. E., et al. , “Border detection in dermoscopy images using statistical region merging,” Skin Res. Technol., vol. 14, no. 3, pp. 347–353, 2008. [DOI] [PMC free article] [PubMed] [Google Scholar]
- [37].Silveira M., et al. , “Comparison of segmentation methods for melanoma diagnosis in dermoscopy images,” IEEE J. Sel. Topics Signal Process., vol. 3, no. 1, pp. 35–45, Feb. 2009. [Google Scholar]
- [38].Celebi M. E., et al. , “Fast and accurate border detection in dermoscopy images using statistical region merging,” Proc. SPIE, vol. 6512, pp. 65123V-1–65123V-10, Mar. 2007. [DOI] [PMC free article] [PubMed] [Google Scholar]
- [39].Zhou H., et al. , “Spatially constrained segmentation of dermoscopy images,” in Proc. 5th IEEE Int. Symp. Biomed. Imag., Nano Macro (ISBI), May 2008, pp. 800–803. [Google Scholar]
- [40].Celebi M. E., Aslandogan Y. A., Stoecker W. V., Iyatomi H., Oka H., and Chen X., “Unsupervised border detection in dermoscopy images,” Skin Res. Technol., vol. 13, no. 4, pp. 454–462, 2007. [DOI] [PMC free article] [PubMed] [Google Scholar]
- [41].Garnavi R., Aldeen M., and Celebi M. E., “Weighted performance index for objective evaluation of border detection methods in dermoscopy images,” Skin Res. Technol., vol. 17, no. 1, pp. 35–44, 2011. [DOI] [PubMed] [Google Scholar]
- [42].Ito K. and Xiong K., “Gaussian filters for nonlinear filtering problems,” IEEE Trans. Autom. Control, vol. 45, no. 5, pp. 910–927, May 2000. [Google Scholar]
- [43].Otsu N., “A threshold selection method from gray-level histograms,” Automatica, vol. 11, nos. 285–296, pp. 23–27, 1975. [Google Scholar]
- [44].Jones R. and Soille P., “Periodic lines: Definition, cascades, and application to granulometries,” Pattern Recognit. Lett., vol. 17, no. 10, pp. 1057–1063, 1996. [Google Scholar]
- [45].Adams R., “Radial decomposition of disks and spheres,” CVGIP, Graph. Models Image Process., vol. 55, no. 5, pp. 325–332, 1993. [Google Scholar]
- [46].Whitaker R. T., “A level-set approach to 3D reconstruction from range data,” Int. J. Comput. Vis., vol. 29, no. 3, pp. 203–231, 1998. [Google Scholar]
- [47].Abbas Q., Celebi M. E., and Fondón I., “Computer-aided pattern classification system for dermoscopy images,” Skin Res. Technol., vol. 18, no. 3, pp. 278–289, 2012. [DOI] [PubMed] [Google Scholar]
- [48].Celebi M. E. and Aslandogan Y. A., “Content-based image retrieval incorporating models of human perception,” in Proc. Int. Conf. Inf. Technol., Coding Comput. (ITCC), Apr. 2004, pp. 241–245. [Google Scholar]
- [49].Celebi M. E., et al. , “A methodological approach to the classification of dermoscopy images,” Comput. Med. Imag. Graph., vol. 31, no. 6, pp. 362–373, 2007. [DOI] [PMC free article] [PubMed] [Google Scholar]
- [50].Walker J. S., Fast Fourier Transforms, vol. 24 Boca Raton, FL, USA: CRC Press, 1996. [Google Scholar]
- [51].Keane R. D. and Adrian R. J., “Theory of cross-correlation analysis of PIV images,” Appl. Sci. Res., vol. 49, no. 3, pp. 191–215, 1992. [Google Scholar]
- [52].Strang G., “The discrete cosine transform,” SIAM Rev., vol. 41, no. 1, pp. 135–147, 1999. [Google Scholar]
- [53].Pellacani G., Cesinaro A. M., Longo C., Grana C., and Seidenari S., “Microscopic in vivo description of cellular architecture of dermoscopic pigment network in nevi and melanomas,” Arch. Dermatol., vol. 141, no. 2, pp. 147–154, 2005. [DOI] [PubMed] [Google Scholar]
- [54].Jain A. K., Fundamentals of Digital Image Processing. Englewood Cliffs, NJ, USA: Prentice-Hall, 1989. [Google Scholar]
- [55].Dreiseitl S., Ohno-Machado L., Kittler H., Vinterbo S., Billhardt H., and Binder M., “A comparison of machine learning methods for the diagnosis of pigmented skin lesions,” J. Biomed. Informat., vol. 34, no. 1, pp. 28–36, 2001. [DOI] [PubMed] [Google Scholar]
- [56].Torre E. L., Caputo B., and Tommasi T., “Learning methods for melanoma recognition,” Int. J. Imag. Syst. Technol., vol. 20, no. 4, pp. 316–322, 2010. [Google Scholar]
- [57].Cortes C. and Vapnik V., “Support-vector networks,” Mach. Learn., vol. 20, no. 3, pp. 273–297, 1995. [Google Scholar]
- [58].Muller K., Mika S., Ratsch G., Tsuda K., and Scholkopf B., “An introduction to kernel-based learning algorithms,” IEEE Trans. Neural Netw., vol. 12, no. 2, pp. 181–201, Mar. 2001. [DOI] [PubMed] [Google Scholar]
- [59].Burges C. J. C., “A tutorial on support vector machines for pattern recognition,” Data Mining Knowl. Discovery, vol. 2, no. 2, pp. 121–167, 1998. [Google Scholar]
- [60].Chang C.-C. and Lin C.-J., “LIBSVM: A library for support vector machines,” ACM Trans. Intell. Syst. Technol., vol. 2, no. 3, 2011, Art. ID 27. [Google Scholar]
-
[61].Mendonca T., Ferreira P. M., Marques J. S., Marcal A. R. S., and Rozeira J., “PH
 —A dermoscopic image database for research and benchmarking,” in Proc. 35th Annu. Int. Conf. IEEE Eng. Med. Biol. Soc. (EMBC), Jul. 2013, pp. 5437–5440. [DOI] [PubMed] [Google Scholar]


