

Abstract
Robotic rehabilitation systems have been developed to treat musculoskeletal conditions, but limited availability prevents most patients from using them. The objective of this paper was to create a home-use robotic rehabilitation system. Data were obtained in real time from a Microsoft  and a wireless surface electromyograph system. Results from the
  sensor were compared to a standard motion capture system. A subject completed visual follow exercise tasks in a 3-D visual environment. Data from two training exercises were used to generate a neural network, which was then used to simulate the subject's individual performance. The subjects completed both the exercise task output from the neural network (custom), and the unmodified task (standard). In addition, a wearable arm robot prototype was built. Basic system identification was completed, and a control algorithm for the robot based on pressure control was designed and tested. The subjects had greater root-mean-square error for position and velocity variables during the custom exercise tasks. These results suggest that the custom task was difficult to complete, possibly because the neural network was unconstrained. Finally, the robot prototype was able to mimic changes in a subject's elbow angle in real time, demonstrating the feasibility of the robotic rehabilitation system.
Keywords: Adaptive systems, artificial neural networks, electromyography, kinematics, pneumatic actuators, pressure control, patient rehabilitation, rehabilitation robotics
The objective of this research was to create a home-use robotic rehabilitation system. Data was obtained in real-time from a Microsoft KinectTM and a wireless surface EMG system. The subjects completed visual follow exercise tasks in a 3D visual environment. Data from two training exercises were used to generate a neural network, which was then used to simulate the subject�s individual performance. Additionally, a wearable arm robot prototype was built that was able to mimic changes in a subject�s elbow angle in real-time.
I. Introduction
Musculoskeletal conditions, or disorders of the muscles and bones, are the most common causes of chronic disability in the world. In the US alone, disease of the musculoskeletal system was the primary diagnosis during 83,228,000 office visits in 2009 (8.0% of total visits) [1]. A stroke can also cause many of the same physical deficiencies seen in musculoskeletal conditions. Approximately 2.6% of all Americans over the age of 20 have had a stroke, and each year 795,000 more people suffer a stroke (1 every 40 seconds) [2]. The most common non-medication treatment for musculoskeletal conditions and stroke is rehabilitation. For patients, rehabilitation is a tedious chore that involves many months of treatment, resulting in low compliance. Rehabilitation regimens combine home-based exercises with therapist-monitored sessions; during the latter, the therapist assesses the patient's capabilities and adjusts the exercise tasks accordingly.
Previous research on upper body rehabilitation has shown that positive functional outcomes are achieved from programs that emphasize task-oriented, repetitive training exercises combined with biofeedback [3], [4]. Thus, virtual reality (VR) rehabilitation systems have been developed that can repetitively simulate these task-oriented training exercises [5], [6]. VR rehabilitation has been shown to be successful for improving upper body function in stroke patients, most likely because the interesting and engaging virtual tasks encourage increased repetition [6]. Furthermore, biofeedback has been shown to improve the learning rate during rehabilitation [3]. Some VR rehabilitation programs have also been designed to be used without the supervision of a physiotherapist [3]. However, VR rehabilitation must be able to adapt to the patients' changing capabilities. A previous study demonstrated that subjects trained with an adaptive VR rehabilitation system had improved upper body functionality when compared to subjects trained with conventional rehabilitation [7].
Robotic rehabilitation systems, designed to address the limitations of traditional physiotherapy, have been developed primarily for upper extremity rehabilitation of stroke patients. These robots generally consist of an arm attachment with multiple actuated degrees of freedom that is affixed to the patient and guides them through different exercise tasks through the use of an immersive visual environment [8]. Studies have shown that patients achieved significant motor recovery and improved upper extremity functionality after participating in robotic rehabilitation [8]. Some shortcomings of the current rehabilitation robots are their limited availability and portability, and their high cost ($50,000 USD) [8]; as a result, few patients can benefit from robotic rehabilitation.
Pneumatic actuators have previously been used in upper body robotic rehabilitation systems because they are lightweight, strong, and mechanically compliant to human anatomy [9]. In terms of control strategies, impedance control and admittance control have been used to ensure the safety of the subjects while they interact with the robot [9]. In these control laws, the controller uses both the position of the robot's joints and the force produced by the actuators in order to limit the amount of force applied to the subject. In terms of efficacy, previous research has suggested that pneumatically actuated rehabilitation robots can be used by patients with movement disabilities or stroke to improve their motor function [9]. The primary drawbacks of pneumatic actuators are that they are difficult to control due to non-linear behavior during actuation, and that they require an external supply of compressed air [9].
The overall objective of this research was to create an adaptive home-use robotic rehabilitation system for the upper body. The specific goals for the system were to collect data from the subject in real-time using simple and portable sensors, to create a customized exercise task for the subject by adapting a standard exercise task, and to build a simple and non-rigid wearable robot that will provide subject-specific resistance training. This paper presents results from comparison testing between the customized exercise tasks and the standard exercise tasks, as well as preliminary testing of a pneumatically actuated prototype for the wearable robot.
II. Methods
A. Description of the Rehabilitation System
1). Subject Data Collection and Visual Environment
A Microsoft  sensor and an electromyograph (EMG) system were combined with custom software written in C++ in order to collect data from the subject in real time. Data was obtained from the Microsoft
  using official Microsoft software (
 SDK version 1.6, Microsoft, Redmond, WA, USA). The 3D joint position data (mediolateral, anteroposterior, and vertical axes) for 20 joints per subject was acquired at the
  native sampling frequency of 30 Hz. The data was subsequently smoothed using the
  smoothing algorithm and adjusted based on the height and angle of the
  sensor. Simultaneously, a wireless surface EMG system (Cometa, Milan, Italy) was used to collect electrical signals at 1000 Hz from two electrodes, one on the subject's biceps muscle and one on the lateral head of the subject's triceps muscle. The EMG signals' linear envelopes were processed in real-time using a previously described method
  [10]. The EMG data were normalized to the subject's maximum voluntary contraction (% MVC).
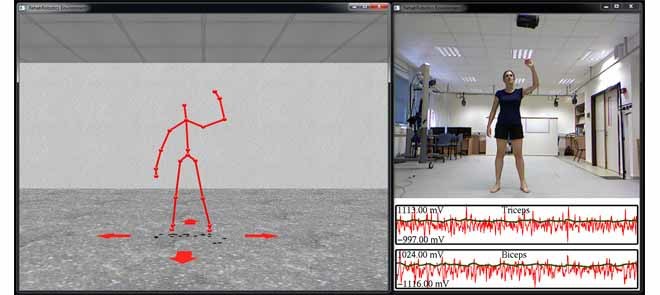
A 3D visual environment (VE) previously created using custom software in C++ and OpenGL [11] was modified to display the data from the sensors as well as the exercise task (see Section III). The VE consisted of a virtual room (Fig. 1, part A) where the joint center data collected from the subject by the  was displayed as a skeleton figure. The subject navigated the VE by using leg gestures to indicate directional arrows that rotated and translated the environment. Separate from the VE, an additional window displayed the color video data from the
  as well as the real-time EMG data (Fig. 1, part B). This window was used to ensure that the subject remained positioned in front of the
  sensor and that the EMG sensors were functioning properly.
Fig. 1.

Visual environment: A) virtual room, B) video and EMG data.
2). Customized Exercise Task
All of the exercise tasks in this system were visual follow tasks. For these tasks, a moving sphere was displayed in the VE (Fig. 1) and the subject used his right hand to follow the sphere as closely as possible as it moved around the VE in a repeating cyclical 2D pattern. The 2D pattern was projected in the 3D visual environment as perpendicular to the subject. From the subject's view, the pattern was constrained to an orthogonal plane directly in front of his viewpoint. The distance to this plane was held constant. As the subject turned and moved within the environment, the pattern turned at the same rate and moved with the subject. In this way, the 2D pattern always appeared in front and perpendicular to the subject's viewpoint.
Biofeedback was used to aid the subject's accuracy; the sphere changed color and the volume of music playing in the background increased as the subject's hand approached the center of the sphere. For data, the 3D position of the sphere, the 3D position of the subject's hand, and the subject's biceps and triceps EMG signals were recorded simultaneously during the exercise tasks.
The protocol for creating the customized exercise tasks, described previously by Barzilay and Wolf [11], consisted of generating an inverse model of the subject, which was modeled by a neural network. The subject first completed 10 full cycles of a visual follow training exercise task, or approximately 3 minutes of training. The subject's performance during this training exercise (in terms of the 3D position of the hand, the 3D velocity of the hand, and the biceps and triceps EMG signals) for all 10 cycles was averaged together and smoothed to create one full cycle of the subject's performance for each of the 8 measured variables [11]. These averaged cycles were then used as inputs to train the neural network. The averaged 3D position and 3D velocity (6 variables) of the sphere during the training exercise task were used as targets to train the neural network [11]. After the neural network was trained, it was used to simulate the subject's individual performance during a standard exercise task. Averaged EMG data from 10 healthy subjects performing the standard exercise task were used as the additional inputs to the neural network [11].
3). Wearable Robot Prototype
The wearable robot prototype consisted of the test platform, the pneumatics assembly (and associated electronic components), and the control architecture.
4). Test Platform
A test platform was built to model the human arm and elbow joint; in this way, the basic prototype and the control algorithms for the wearable robot could be developed and validated in a safe environment without a risk of injury. The platform was designed to replicate the mass properties  , inertial properties
  , and dimensions of the human arm [12]. The test platform consisted of two
  aluminum cages (simulating the upper arm and forearm segments) connected together by two ball bearing assemblies to simulate an elbow joint (Fig. 2). The upper arm cage was bolted to a wooden base while the forearm cage was allowed to swing freely up to 45
 in either direction about the elbow joint. In future iterations, this entire structure will be replaced by a human subject's arm.
Fig. 2.

Wearable robot prototype.
5). Pneumatics Assembly
The pneumatics assembly actuated the wearable robot prototype. The primary requirements for the assembly were that the components be both non-rigid and highly compliant as the robot will eventually be worn on the subject's arm. As such, McKibben-type pneumatic artificial muscles (PAMs) were chosen as the actuation components; as an additional benefit, these actuators closely replicate the behavior of natural muscles. Two Festo DMSP-10-120 PAMs (Festo, Denkendorf, Germany) were attached to the upper arm cage of the test platform to replicate the biceps and triceps muscles (Fig. 2). The PAMs were 10 mm in diameter and 120 mm long. The muscles were rigidly anchored to the base of the upper arm cage and then connected to the forearm cage at the elbow joint with non-elastic metal wire (Fig. 2). In this way, actuation of the upper arm cage was accomplished by transforming the force from the antagonistic PAMs into torque about the joint, as in the human arm. Each PAM was independently controlled by using two 2/2 normally closed Festo MHJ-10 pneumatic valves (Festo, Denkendorf, Germany), one for inlet and one for outlet. Each PAM had three modes of operation: inflate, deflate, and sealed. Motorola MPX5700 pressure sensors (Motorola Solutions, Schaumburg, IL, USA) measured pressure in the PAMs and output an analog signal to the microcontroller.
Finally, an austriamicrosystems AS5145 magnetic encoder (ams AG, Unterpremstatten, Austria) was used to determine the position of the elbow joint, and an Arduino Uno board (SparkFun, Boulder, CA, USA) was used as the microcontroller for the entire prototype.
6). Control Architecture: System Identification
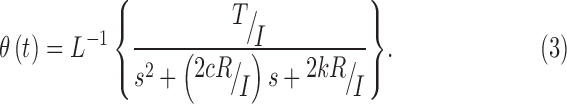
In order to identify the robot's passive dynamic properties, an impulse torque disturbance was applied to the joint and the angular position was recorded with respect to time. The system was modeled as a standard 2nd order linear system, with the following equation for the angular position:
 |
where  and
and  are the damping and spring coefficients of the moveable parts of the robot prototype and
  is the distance from the center of the joint to the attachments of the non-elastic metal wire (Fig. 2). The response in time to an impulse in the form of
 |
therefore leads to the following equation (in the time domain via the inverse Laplace transform):
 |
 ,
,  , and
, and  were defined as follows:
 |
As such, the resultant response was
 |
The damping coefficient  was assumed to be relatively small
  and therefore the difference between
  and
and  was neglected. The final approximated function was
 |
7). Control Architecture: Pressure Control
The control architecture for the robot was based on pressure control of the PAMs. The PAMs were controlled through pulse-width modulation (PWM) of the pressure valves. A simplified dynamic equation for the robot was used for analysis due to the complexity of modeling the highly non-linear behavior of the PAMs. The dynamic equation used for the control architecture was
 |
where  is the disturbance torque due to dampening, friction, gravity, spring constant, and so on, and
  is the control torque applied by the PAMs and controlled using the sensors, microprocessor, and valves.
The control torque applied by the PAMs was modeled as
 |
and a simple proportional loop was implemented (Fig. 3).
Fig. 3.

Control loop for robot prototype.
The PWM parameters that determined the duty cycle for the valves were chosen so as not to exceed the limits of the valves, which had a minimum switching time of 1 msec (1000 Hz). A 16 msec (60 Hz) PWM period (divided into 10% duty cycles) and a 600 Hz switching frequency were selected, which resulted in a minimum switching time of 1.6 msec for each 10% duty cycle.
In terms of the control rule for the PAMs, when the pressure error was positive  , the inlet valve duty cycle was determined as:
 |
and the outlet duty cycle remained closed (0%). When the pressure error was negative, the situation was reversed.
B. Assessment of the Rehabilitation System
1). Subject Data Collection and Visual Environment
Two different experiments were performed for the assessment of the subject data collection and visual environment. The first experiment focused on the accuracy of the  sensor, while the second experiment focused on a comparison of the customized exercise task.
2). Accuracy of Kinect Sensor
10 young, healthy subjects  with no history of upper body impairment volunteered to participate in this study. The subjects wore minimal clothing on their upper bodies to allow for placement of 25 reflective markers on their torsos and arms. Each subject completed three trials of two different upper body exercises: 1) a range-of-motion (ROM) exercise where the subject slowly raised both of his arms, elbow joints extended, from the sides of his torso to 45
 above the transverse plane and back down, three repetitions per trial, and 2) a visual follow task, where the subject used his right hand to follow a moving sphere flying in a 3D figure 8 pattern in the VE for a total of 45 seconds [9].
Data was collected during these exercise tasks using both the robotic rehabilitation system and a 10 camera opto-electronic Vicon MX Motion Capture System (Vicon, Oxford, UK) as a gold-standard for validation. For the robotic rehabilitation system, 3D joint center data was recorded for the wrist, elbow, and shoulder joints of the right arm using the  SDK version 1.5 and custom C++ software. Additionally, a synchronization signal was sent from the robotic rehabilitation system to indicate to the Vicon system when data were being collected. For the Vicon system, the reflective markers were placed on the subjects according to the Vicon Upper Body Model marker set. Vicon Nexus software (version 1.8.2) was used to record the position of the markers during the exercise tasks as well as the synchronization signal. The data was post-processing in Vicon Nexus to obtain the joint center locations of the right wrist, elbow, and gleno-humeral (shoulder) joint.
Analysis of the data was completed in MATLAB R2012a (Mathworks, Natick, MA, USA). A homogenous transformation was used to align the coordinate systems of the  and Vicon measurement systems. To find the best parameters for the homogenous transformation, a minimum cost maximal matching optimization was used (cost function: average distance between a small, randomized set of paired points from each system). The data was then resampled to a common frame rate of 120 Hz, and the synchronized subset of the data extracted. The Pearson's correlation (R) coefficient and the root-mean-square error (RMSE) were calculated between the resampled and synchronized Vicon and
  data for each trial.
3). Comparison of the Customized Exercise Task
Twelve young, healthy subjects  with no history of upper body impairment volunteered to participate in this study. The subjects wore close-fitting short sleeve shirts to allow for the placement of the two EMG electrodes on their biceps and triceps. Each subject was first asked to complete 10 full cycles of one of two different training exercise tasks, either a vertical double figure 8 pattern (Fig. 4, part A) [11] or a vertical half figure 8 pattern (Fig. 4, part B). After the neural network was trained, a related exercise task, consisting of either a full horizontal figure 8 pattern (Fig. 4, part A) [11] or half of a horizontal double figure 8 pattern (Fig. 4, part B), was given to the neural network as input data (combined with the healthy EMG data for that particular task), and a customized exercise task was output from the neural network. The subject then completed 10 full cycles of this customized output exercise task (custom), as well as 10 full cycles of the unmodified original task used as input to the neural network (standard) (Fig. 4). A full exercise set consisted of the three linked exercise tasks (training, custom, standard), and each subject completed 4 full sets (two of each type of set), for a total of 12 exercise tasks per subject.
Fig. 4.

Exercise patterns by set for training and related exercise tasks.
Analysis of the data was completed in MATLAB R2012a (Mathworks, Natick, MA, USA). For the custom and standard exercise tasks, the root-mean-square error (RMSE) was calculated between the subject's hand and the sphere for both position and velocity. For the EMG signals, the peak value and the area under the linear envelope were calculated. Finally, the data from the subjects were merged, and paired  -tests (two-tailed,
  ) were conducted between the standard exercise data and the corresponding custom exercise data in the set for the aforementioned variables.
4). Wearable Robot Prototype Testing
For the system identification, the final approximated function (6) was tested experimentally by applying an external impulse torque disturbance to the robot and then recording the measurements from the encoder in the elbow joint; this test measured the passive properties of the robot because the valves were sealed after the initial impulse. The experiment was conducted five separate times, and the approximations for  ,
,  , and
, and  were determined using the “nlinfit” function in MATLAB.
To test the pressure control algorithm, continuous sine wave pressure reference input signals were sent to the robot prototype at 60 Hz. Sine wave frequencies of 0.25 Hz, 0.5 Hz, 0.75 Hz, and 1 Hz were tested ( for all tests). During the tests, measurements were recorded from the pressure sensors and the encoder. After the trials, the RMSE and Pearson's correlation coefficient (R) were calculated between the reference pressure and the measured pressure.
As a comparison to the passive system identification testing, an external impulse torque disturbance was applied to the robot when the control algorithm was active, and the measurements from the encoder in the elbow joint were subsequently recorded. This test measured the closed-loop properties of the robot because control algorithm was active and the valves were open after the initial impulse. The experiment was conducted 15 separate times, and the approximations for  ,
,  , and
, and  were again determined using the “nlinfit” function in MATLAB.
5). Combined System
Preliminary evaluation tests were conducted on the entire combined system. In the visual environment, a subject moved his right arm from full extension to full flexion at different speeds. The angle of the subject's right elbow was continuously updated in real-time based on the 3D position of the subject's shoulder, elbow, and wrist joints. This angle was then converted into a voltage signal (between 0 and 5 volts) that corresponded to the relative angle of the elbow (between a minimum of 35 when the hand touched the shoulder, to a maximum of 175
 when the elbow was fully extended). Any angle measured beyond these limits was considered either 0 or 5 volts, depending on which limit was exceeded. A National Instruments USB-6218 (BNC) data acquisition device (National Instruments Corporation, Austin, TX, USA) was connected to the rehabilitation system, and the elbow angle voltage was sent as an output analog signal from this device. This signal was then connected to the analog input of the Arduino Uno to provide a real-time position reference signal for the robot prototype based on the subject's elbow angle. This position signal was then converted into two corresponding pressure reference input signals for the PAMs, where 0 volts corresponded to the minimum
  and 5 volts corresponded to the maximum
  allowable angle of the robot from the neutral position (0
 ). In this way, the subject could actuate the robot by changing the angle of his elbow.
Five 30-second duration tests were conducted. During the tests, the real-time angle of the subject's elbow (measured by the  ) and the real-time angle of the robotic elbow joint (measured by the encoder) were simultaneously recorded. After the tests, the angle data were resampled and independently normalized on a scale of 0 to 1. Finally, the RMSE and Pearson's correlation coefficient (R) were calculated between the normalized angle of the subject's elbow and the normalized angle of the robotic elbow joint.
III. Results
A. Subject Data Collection and Visual Environment
1). Accuracy of Kinect Sensor
The results from the validation testing between the  data and the Vicon data are presented for all trials of the 10 subjects for the right arm joints (wrist, elbow, and shoulder) by exercise task in Table I. For the ROM task, the largest RMSE was observed for the shoulder joint. For the visual follow task, the largest RMSE was observed for the elbow joint, then the wrist joint, and last the shoulder joint. Furthermore, the RMSE for the elbow and shoulder joints was greater during the visual follow task when compared to the ROM task, while the RMSE for the shoulder joint was greater during the ROM task.
TABLE I.

Vicon-Kinect Comparisons by Joint and Task
2). Comparison of the Customized Exercise Task
A comparison of the standard and custom exercise tasks by exercise set is presented in Table II. There were no significant differences in the EMG variables for either exercise set. The subjects had greater RMSE for the position and the velocity variables during the custom tasks (as compared to the standard tasks) for both sets.
TABLE II.

Kinematic and EMG Variables by Set
B. Wearable Robot Prototype Testing
The results from the external impulse response tests of the robot prototype are presented in Table III for  ,
,  , and
, and  , derived from the final approximated function (6). The joint angle measured by the encoder was then compared to the predicted joint angle, which was calculated by using function (6) and the experimentally-determined function parameters.
TABLE III.

Impulse Response
The average values for the five passive properties tests were  and
and  . Compared to the predicted joint angle, the average RMSE was 0.23
 with a high correlation
  . The average values for the fifteen active properties tests were
  and
and  . Compared to the predicted joint angle, the average RMSE was 0.90
 with a high correlation
  .
.
The results from the pressure control algorithm tests are presented in Table IV, Figs. 5 and 6.
TABLE IV.

Ref-Meas Comparisons by Frequency and PAM
Fig. 5.
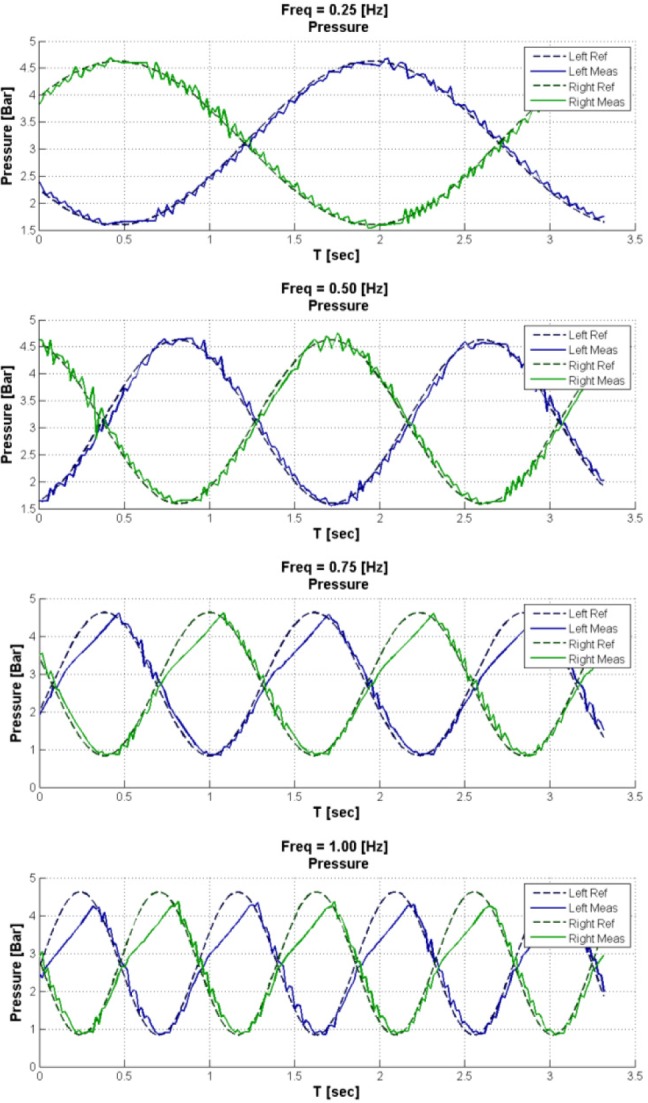
Reference vs. measured pressure in the PAMs by frequency for sine wave input signals.
Fig. 6.

Robot prototype joint angle by reference signal frequency.
The continuous joint angles during the pressure control algorithm tests are shown in Fig. 6.
For the 0.25 Hz and 0.5 Hz continuous sine wave pressure reference input signals, the measured pressure accurately followed the reference pressure for both PAMs  . However, for the 0.75 Hz and 1 Hz input signals, the measured pressure did not follow the reference pressure during pressurization when the reference pressure was greater than 2.5 Bars, indicating saturation of the PAMs. The range for the joint angles was 38.8
 at 0.25 Hz, 39.0
 at 0.5 Hz, 51.9
 at 0.75 Hz, and 53.6
 at 1 Hz.
C. Combined System
The wearable robot prototype was able to accurately mimic the angle of the subject's elbow in real-time. The RMSE between the normalized position of the subject's elbow and the normalized position of the robot elbow ranged from 0.073 to 0.103 (average 0.088), and the correlation ranged from 0.94 to 0.97 (average 0.96,  ). The results from one full test are presented in Fig. 7, and demonstrate the correlation between the two angle positions.
Fig. 7.
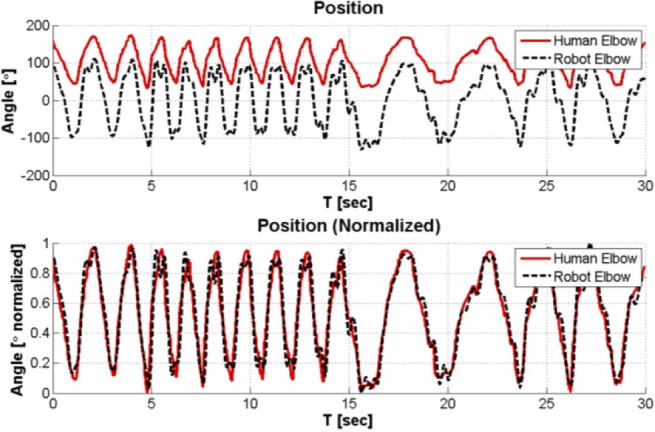
Human and robot elbow angles for one test of combination system.
IV. Discussion
The overall objective of this research was to create an adaptive home-use robotic rehabilitation system for the upper body. This paper presented results from comparison testing between different exercise tasks and from preliminary testing of a pneumatically actuated prototype for the wearable robot, all of which demonstrate that this robotic rehabilitation system achieved the stated objective.
A. Subject Data Collection and Visual Environment
1). Accuracy of Kinect Sensor
The first specific goal for this research was to collect data from a subject in real-time using simple and portable sensors. During the subject testing, the  sensor measured the 3D position and 3D velocity of the subject's hand at 30 Hz. Experimental testing was conducted to determine the accuracy of the joint center measurements from the
  as compared to the Vicon gold-standard measurements during two upper-body exercise tasks (Table I). The results presented in Table I show that the largest RMSE for any joint during either task was 35.8 mm, while the smallest was 25.5 mm. These results are similar to a previous study comparing the
  measurements to Vicon measurements for upper body exercise tasks. Clark et al. showed that between the two systems, there was approximately 42.9 mm difference during a lateral reaching task and 13.1 mm difference during a forward reaching task for hand measurements [13].
These results suggest that the  measurements are sufficiently accurate for clinical significance, and therefore the robotic rehabilitation system is sufficiently accurate for measurements of rehabilitation exercises. Since traditional physiotherapy regimens for the upper body are managed by physiotherapists, easily identified visual landmarks are used to quantify the success of the exercises. One study, focused on rehabilitation after a thrower's elbow injury, used visual quantification landmarks such as “extend elbow to full extension”, “raise arm to shoulder level” and “stand with shoulder abducted 90
 ” to describe the exercises [14]. The current standard is to evaluate the exercises based on visual observation (which can result in substantial errors when compared to a quantitative system like Vicon). As such, RMSE of 35 mm to 40 mm in joint center measurements can be considered insignificant for clinical purposes because visual observation error in a clinical setting has been shown to be approximately 10% and this RMSE is less than 10% of the movement range [15]. Therefore, the joint center measurements from the
  sensor are accurate enough to quantify rehabilitation exercises of the upper body, and are an improvement to the current standard of visual observation by a physiotherapist.
2). Comparison of the Customized Exercise Task
The second specific goal of the system was to create a customized exercise task for each subject. A neural network was created using the subject's training exercise data and was then used to modify a standard exercise task into a custom exercise task. For both sets of exercises, the subjects had greater RMSE for the position and the velocity variables during the custom tasks; in other words, during the custom task, their kinematic performance was worse in terms of accuracy to the instructed task.
These results show that the subjects were less able to replicate the custom task, suggesting that the custom task was more difficult to complete. This may be a result of the unconstrained nature of the neural network used to create the custom task. No output constraints were placed on the neural network, and the researchers did not manually alter the output. As a result, the path of the custom task was somewhat squiggly and loopy. In contrast, the standard task was always a simple and consistent path. Consequently, the subjects were continually reacting to the unpredictable trajectory of the moving sphere during the custom task but were able to anticipate the trajectory of the standard task, thereby making the standard task easier to complete.
Adding constraints to the neural network could reduce the variability of the custom exercise. Previous successful adaptive rehabilitation systems [7], [16] used trained physiotherapists to adapt the rehabilitation tasks to the subjects based on the quantitative data. Therefore, the therapist acted as a constraint on the output of the systems, and could modify the output exercise task to achieve the desired goal. Future iterations of the system will include constraints on the neural network and/or a trained physiotherapist who can modify the output task in order to ensure that the custom task is an anticipatory task, not a reactionary task.
Both the  sensor and the EMG system are easily transportable and simple to use after minimal training. Thus, it is feasible to use the entire rehabilitation system in a home setting, as the only additional requirements are a computer and a display device like a television.
B. Wearable Robot Prototype
The third specific goal for the system was to build a simple and non-rigid wearable robot that will provide subject-specific resistance training. The results for the wearable robot prototype demonstrate the feasibility of using PAMs for actuation. Table III shows that the exoskeleton can be modeled as a second order linear system described by (6). The measured damping coefficient  was low, suggesting that it might be difficult to control the robot. However, it is likely that a human elbow will have a higher damping coefficient than the test platform and therefore will be more controllable. Furthermore, the measured damping coefficient was higher during the closed-loop comparison testing of the robot
  , showing that the simple pressure control algorithm increased the damping of the robot. Overall, these results indicate that a robust controller can be built that will control the robot.
The first controller developed for the robot was based on pressure control of the PAMs. The results from the pressure control algorithm tests indicate that there was saturation of the PAMs at 0.75 Hz and 1 Hz during pressurization; the valves did not pressurize the PAMs fast enough to follow the reference signal. This saturation most likely occurred because the reference pressure input signals were both high amplitude and high frequency, and as such required a high change rate (7 Bar/second) of the pressure inside the PAMs (corresponding to an angle change of 100 ). As the pressure rose inside the valves, the pressure differential between the valves and the pressure source decreased, thereby decreasing the flow rate to the valves. Eventually, the decreased flow rate was insufficient to achieve the high change rate required by the reference pressure input signals, and saturation occurred. This trend was not observed during depressurization because it would only occur near 0 Bar, and the pressure reference input signals did not reach this level.
While the motion bandwidths of normal human arm movements are centered at approximately 2 Hz [17], most of these movements are relatively low amplitude and would not require high pressure change rates of the PAMs. Nevertheless, future versions of the wearable robot will use a higher pressure source to increase the pressure differential (and therefore the flow rate) of the PAMs so that the robot can follow reference pressure input signals of at least 5 Hz. Additionally, force sensors will be added to the robot so that advanced control algorithms can be implemented, such as impedance or admittance control [9], in order to more accurately control the pneumatically actuated robot.
The control performance of the wearable robot did not account for additional loading from the subject. In a wearable robot, the subject would also be exerting force on the robot (both assistive and resistive force). This force would need to be measured and compensated by the controller in order to accurately control the position of the robot. Future prototypes of the robot arm should include sensors to measure the force exerted on the robot by the subject.
C. Combined System
The results from the tests of the combined system indicate that the pressure loop can successfully follow low amplitude pressure reference input signals at frequencies greater than 1 Hz. During these tests, saturation was not observed when the subject actuated the robot with a low amplitude reference input signal greater than 1 Hz. Varying the rate of change of the elbow angle also did not affect the accuracy of the robot, as it was able to follow the subject's slow and fast movements. However, due to a slightly noisy input signal (caused by small inaccuracies in the measured elbow angle from the  ) and insufficient damping in the control algorithm, the robot sometimes oscillated about the desired angle.
Furthermore, this test demonstrates the feasibility of the entire robotic rehabilitation system because the subject was able to actuate the wearable robot using only the movement of his elbow. Future iterations of the entire system will implement real-time smoothing of the elbow angle reference signal in order to compensate for the small inaccuracies in the  measurements, and the damping terms in the control algorithm will be increased.
V. Conclusion
This study described a promising home-use robotic rehabilitation system comprised of low-cost components. Further research is necessary to create a commercial version of this system, specifically on the prototype of the wearable robot. However, the data collection component of the system could be used in the near future for large scale research studies. The immediate next steps are to create a GUI for the system to increase usability and to optimize the model generation code for speed and accuracy. Afterwards, this part of the rehabilitation system could be used by a variety of end-users for large scale research studies on rehabilitation exercises. Given the low cost and easy portability of the Microsoft  sensor, these studies should include home-based exercise components. Concurrently, the next prototype of the wearable robot should be developed with the goal of having a fully functioning wearable prototype within two years.
A limitation of this study is that the current system does not provide force feedback to the subjects. The wearable robot was designed to provide force feedback during the exercise tasks, but the current prototype was not tested on human subjects. Future iterations of the robot prototype should be designed for wearability and human safety so that it can be worn by the subjects in order to provide force feedback. The addition of force feedback to the system should significantly enhance the results as the subject will have additional biofeedback information to help them complete the rehabilitation exercises.
Biographies

Ariel V. Dowling (M'12) received the A.B. and B.E. degrees in mechanical engineering from Dartmouth College in 2005, and the M.S. and Ph.D. degrees in mechanical engineering from Stanford University in 2007 and 2011, respectively.
After receiving her Ph.D. degree, she joined the Faculty of Mechanical Engineering at the Biorobotics and Biomechanics Laboratory, Technion–Israel Institute of Technology, as a Post-Doctoral Research Fellow. Her research interests are medical robotics, specifically wearable robotics and robotic rehabilitation.

Ouriel Barzilay was born in Caen, France, in 1981. He received the B.Sc. (cum laude) and M.Sc. (cum laude) degrees in mechanical engineering from Technion–Israel Institute of Technology in 2007 and 2010, respectively, where he is currently pursuing the Ph.D. degree in mechanical engineering with the Biorobotics and Biomechanics Laboratory. His fields of interest include biorobotics, computer vision, computational geometry, and artificial intelligence.

Yuval Lombrozo received the B.Sc. degree in mechanical engineering from Technion–Israel Institute of Technology in 2012.

Alon Wolf (M'03) received the B.Sc., M.Sc., and Ph.D. degrees in mechanical engineering from Technion–Israel Institute of Technology in 1995, 1998, and 2002, respectively.
After receiving his Ph.D. degree, he joined the Mechanical Engineering Department, Carnegie Mellon University (CMU), as a Post-Doctoral Research Associate. One year later, he joined the Robotics Institute at CMU and the Institute for Computer-Assisted Orthopaedic Surgery as a Research Scientist. In 2006, he joined the Faculty of Mechanical Engineering at Technion, where he founded a new research laboratory, the Biorobotics and Biomechanics Laboratory (BRML). The objective of the research at BRML is to develop fundamental theories in biokinematics and biomechanics, and to apply these theories to applications in medical robotics and biorobotics. He is a Co-Inventor and Co-Founder of Medrobotics.
Funding Statement
This work was supported in part by the Whitaker Foundation and in part by the Technion—Israel Institute of Technology, Haifa, Israel.
References
- [1].Centers for Disease Control and Prevention, Atlanta, GA, USA: (2013), Jan.). National Ambulatory Medical Care Survey: 2009 Summary [Online]. Available: http://www.cdc.gov/nchs/data/ahcd/namcs&underscore;summary/2009&underscore;namcs&underscore;web&underscore;tables.pdf [Google Scholar]
- [2].Roger V. L. et al. , “Heart disease and stroke statistics—2012 update,” Circulation, vol. 125, pp. e2–e220, Jan. 2012. [DOI] [PMC free article] [PubMed] [Google Scholar]
- [3].Holden M. K., “Virtual environments for motor rehabilitation: Review,” Cyberpsychol. Behavior, vol. 8, no. , pp. 187–211, Jun. 2005. [DOI] [PubMed] [Google Scholar]
- [4].Oujamma L., Relave I., Froger J., Mottet D., and Pelissier J. Y., “Rehabilitation of arm function after stroke. Literature review,” Ann. Phys. Rehabil. Med., vol. 52, pp. 269–293, Apr. 2009. [DOI] [PubMed] [Google Scholar]
- [5].Brochard S., Robertson J., Médée B., and Rémy-Néris O., “What's new in new technologies for upper extremity rehabilitation?” Current Opinion Neurol., vol. 23, no. 6, pp. 683–687, Dec. 2010. [DOI] [PubMed] [Google Scholar]
- [6].Laver K., George S., Thomas S., Deutsch J. E., and Crotty M., “Cochrane review: Virtual reality for stroke rehabilitation,” Eur. J. Phys. Rehabil. Med., vol. 48, pp. 523–530, Sep. 2012. [PubMed] [Google Scholar]
- [7].Duff M. et al. , “Adaptive mixed reality rehabilitation improves quality of reaching movements more than traditional reaching therapy following stroke,” Neurorehabil. Neural. Repair, vol. 27, no. 4, pp. 306–315, May 2013. [DOI] [PubMed] [Google Scholar]
- [8].Brewer B. R., McDowell S. K., and Worthen-Chaudhari L. C., “Poststroke upper extremity rehabilitation: A review of robotic systems and clinical results,” Top Stroke Rehabil., vol. 14, no. 6, pp. 22–44, Dec. 2007. [DOI] [PubMed] [Google Scholar]
- [9].Morales R., Badesa F. J., García-Aracil N., Sabater J. M., and Pérez-Vidal C., “Pneumatic robotic systems for upper limb rehabilitation,” Med. Biol. Eng. Comput., vol. 49, no. 10, pp. 1145–1156, Oct. 2011. [DOI] [PubMed] [Google Scholar]
- [10].Barzilay O. and Wolf A., “A fast implementation for EMG signal linear envelope computation,” J. Electromyogr. Kinesiol., vol. 21, no. 4, pp. 678–682, Aug. 2011. [DOI] [PubMed] [Google Scholar]
- [11].Barzilay O. and Wolf A., “Adaptive rehabilitation games,” J. Electromyogr. Kinesiol., vol. 23, pp. 182–189, Feb. 2013. [DOI] [PubMed] [Google Scholar]
- [12].Drillis R. J., Contini R., and Bluestein M., “Body segment parameters; A survey of measurement techniques,” Artif. Limbs, vol. 8, no. 1, pp. 44–66, 1964. [PubMed] [Google Scholar]
- [13].Clark R. A. et al. , “Validation of the Microsoft Kinect for assessment of postural control,” Gait Posture, vol. 36, no. 3, pp. 372–377, 2012. [DOI] [PubMed] [Google Scholar]
- [14].Wilk K. E., Reinold M. M., and Andrews J. R., “Rehabilitation of the thrower's elbow,” Clin. Sports Med., vol. 23, pp. 765–801, Oct. 2004. [DOI] [PubMed] [Google Scholar]
- [15].Hurkmans H. L., Bussmann J. B., and Benda E., “Validity and interobserver reliability of visual observation to assess partial weight-bearing,” Archives Phys. Med. Rehabil., vol. 90, no. 2, pp. 309 213, Feb. 2009. [DOI] [PubMed] [Google Scholar]
- [16].Chen Y., Baran M., Sundaram H., and Rikakis T., “A low cost, adaptive mixed reality system for home-based stroke rehabilitation,” in Proc. IEEE Eng. Med. Biol. Soc. Conf., Sep. 2011, pp. 1827–1830. [DOI] [PubMed] [Google Scholar]
- [17].Neilson P. D., “Speed of response or bandwidth of voluntary system controlling elbow position in intact man,” Med. Biol. Eng., vol. 10, pp. 450–459, Jul. 1972. [DOI] [PubMed] [Google Scholar]