Abstract
We examine whether modeling of the causal dynamic relationships between frontal and occipital electroencephalogram (EEG) time-series recordings reveal reliable differentiating characteristics of Alzheimer’s patients versus control subjects in a manner that may assist clinical diagnosis of Alzheimer’s disease (AD). The proposed modeling approach utilizes the concept of principal dynamic modes (PDMs) and their associated nonlinear functions (ANF) and hypothesizes that the ANFs of some PDMs for the AD patients will be distinct from their counterparts in control subjects. To this purpose, global PDMs are extracted from 1-min EEG signals of 17 AD patients and 24 control subjects at rest using Volterra models estimated via Laguerre expansions, whereby the O1 or O2 recording is viewed as the input signal and the F3 or F4 recording as the output signal. Subsequent singular value decomposition of the estimated Volterra kernels yields the global PDMs that represent an efficient basis of functions for the representation of the EEG dynamics in all subjects. The respective ANFs are computed for each subject and characterize the specific dynamics of each subject. For comparison, signal features traditionally used in the analysis of EEG signals in AD are computed as benchmark. The results indicate that the ANFs of two specific PDMs, corresponding to the delta–theta and alpha bands, can delineate the two groups well.
Keywords: Alzheimer’s disease, assistive diagnosis, EEG signal processing, nonlinear modeling
Alzheimer's disease (AD) is currently the most common neurodegenerative disorder in the western world and in the future its incidence is expected to double every 20 years. Because a definitive diagnosis can be made only by autopsy and AD pathology can start years before the first symptoms, there is a need for objective, non-invasive and affordable means to support clinicians in the detection and monitoring of the disease. We present an approach for assisting the diagnosis of Alzheimer's disease via modeling the causal dynamic relationships between frontal and occipital lectroencephalogram (EEG) time-series recordings. In a controlled clinical trial of 41 subjects, the proposed input-output modeling methodology was able to differentiate consistently between AD patients and controls.
I. Introduction
Alzheimer’s disease (AD) is the most common neurodegenerative disorder in the western world and the number of patients is expected to double approximately every 20 years because of the aging population [6]. AD is characterized by the accumulation of amyloid plaques and neurofibrillary tangles in the patient’s brain and loss of cortical neurons and synapses [7]. These pathological changes cause memory loss and other cognitive and behavioral impairments that progressively affect the patient’s ability to live independently [7].
The guidelines for clinical diagnosis of AD [8] are based on the exclusion of other causes for the symptoms. However, a definite diagnosis of AD can only be made by necropsy [7] and AD pathology is hypothesized to start years before the first symptoms appear. The patient’s quality of life already affected by the time clinical diagnosis is made [7]. Thus, there is a need for objective, non-invasive and affordable means to support clinicians in the detection and monitoring of AD. One of such potential means is the analysis of electroencephalogram (EEG) recordings [9].
The analysis of EEG time series has been explored previously for its diagnostic potential in AD, based on the notion that the EEG signals represent fluctuations of aggregate brain activity in the respective brain regions and, therefore, may be able to reveal differences in brain function under different clinical conditions [10], [11]. Many previous studies have explored this question through the computation of diverse signal features from EEG recordings [10], [11]. Spectral features, including both spectral indices such as median frequency and relative power values, have revealed a spectral slowdown of the brain activity in AD [9]–[12]. Nonlinear features provide additional points of view in the inspection of the EEG signals. Features such as Sample Entropy have been applied to the EEG recordings of patients [11]. The results indicate that AD affects the nonlinear characteristics of the EEG signals, making them more regular and predictable [10], [11].
AD is hypothesized to be a disconnection syndrome [10], [13]. Therefore, there is increasing interest in the inspection of the connectivity of EEG recordings [10], [13], [14], [16], [17]. This is often evaluated by measuring the (linear or nonlinear) dependencies between two signals in different spectral bands [10], [14], [17]. This is particularly important in AD as the disease may cause opposing changes in different frequency ranges [10], [13], [16].
Traditional approaches to measure the connectivity between EEG signals are limited by a number of factors. To start with, spurious results could appear due to the volume conduction effects [13], [16], [17], because nearby channels are likely to record activity from identical sources. Ideally, the connectivity evaluation should also inform about the causality of the interactions between signals [17]. While some techniques have been recently developed to address these issues (e.g., phase lag index in [13]), their use is limited perhaps due to a less straightforward interpretation than other techniques.
As an alternative, the present study focuses on the modeling and analysis of the possible causal relationship between occipital recordings (viewed as the “input” signal) and frontal recordings (viewed as the “output” signal) in order to generate model-based indices to characterize the EEGs of AD patients. To this purpose, we apply the Volterra modeling approach using Laguerre expansions of the kernels and employ the concept of Principal Dynamic Modes (PDM), which our group has pioneered [4]. This reduces significantly the required number of free parameters in the model and enables estimation of reliable linear or nonlinear dynamic models under conditions of low SNR. This modeling methodology has been recently applied to many different physiological domains, including the cerebral hemodynamics in AD patients [5]. The results to date corroborate the potential and efficacy of this modeling approach. The proposed diagnostic indices in this study are generated through the use of the Associated Nonlinear Functions (ANFs) that correspond to each PDM of each subject.
Our aim is to examine whether the estimated PDMs exhibit spectral characteristics in line with the neural rhythms naturally occurring in the brain (delta, theta, alpha, beta, and gamma) and whether the ANFs obtained for each subject can be used as descriptors of disease. It is posited that these ANFs may constitute useful “features” for the classification and differentiation of overall cognitive function in AD patients versus controls.
II. Methods
A. Data Collection and Pre-Processing
This study involves 24 control subjects (42% male; average age: 69.4±11.5years, mean±standard deviation, SD) and 17 AD patients (53% male; average age: 77.6±10.0 years) who voluntarily participated and signed the Informed Consent Form according to institutional guidelines.
The EEG recordings were obtained for patients at rest and with their eyes closed using the traditional 10–20 system in a Common Reference montage using a sampling rate of 256 Hz. The signals were downsampled to 128Hz offline.
The data were obtained under a strict protocol from Derriford Hospital, Plymouth, UK, and had been collected using normal hospital practices. The patients were referred to the hospital EEG department from a specialist memory clinic where all patients undergo a battery of psychometric tests before referral. The results from the psychometric tests were scored and interpreted by a specialist psychologist. Each patient was given a diagnosis at the memory clinic on the basis of the clinical and psychometric findings and discussions held by a multidisciplinary team. Each patient was then referred to the hospital for EEG assessment. All age-matched controls were healthy volunteers and had normal EEGs (confirmed by a Consultant Clinical Neurophysiologist).
For each subject, continuous epochs of 60 seconds were simultaneously extracted from the left frontal (F3), right frontal (F4), left occipital (O1) and right occipital (O2) channels. The selection of these electrodes is supported by the fact that AD is hypothesized to affect long-range connectivity as a result of the loss of long cortico-cortical association fibers, which may play an important role in functional interactions [10]. Moreover, selecting nearby channels would probably result in all of them picking up identical sources, which may lead to spurious connectivity levels reflecting simple volume conduction rather than true functional connectivity [13]. The positions of the selected electrodes minimize possible effects of ocular activity.
The epochs of 60s were selected for having a small presence of artifacts. They were then band-pass filtered in the range of 1 to 40 Hz with a band-pass Hamming window FIR filter with order 200. The data were then demeaned and scaled by a factor of 1/100 for computational/numerical convenience. Fig. 1 shows illustrative pre-processed time-series data over 3 sec and the respective spectrogram for the O1 EEG signal of an AD patient. The spectral properties of this data segment seem stationary.
Figure 1.
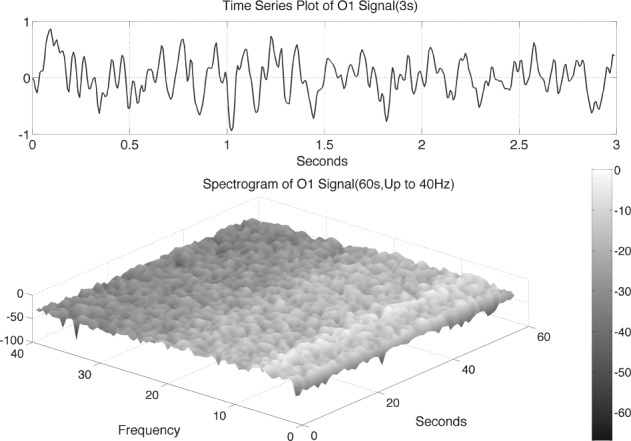
Top panel: illustrative time-series data over 3 sec from the O1 EEG signal of AD patient #1. Bottom panel: the spectrogram over 60 sec of the time-series data up to 40Hz for this patient.
B. Modeling Methodology
The proposed modeling approach utilizes the concept of Principal Dynamic Modes (PDM) that has been pioneered by our group and applied successfully over the last 10 years to various physiological systems [4]. In this approach, we seek to determine from input-output data a set of basis functions (the PDMs) that represent an efficient “coordinate system” for the representation of the Volterra kernels of a given class of systems. Static nonlinear functions associated with each PDM (termed ANF: Associated Nonlinear Functions) describe the (possible) nonlinearities of the system. The PDM modeling approach relies on an efficient methodology for the estimation of Volterra kernels using Laguerre expansions [4]. To reduce the complexity of the obtained PDM-based models and facilitate comparisons between different cohorts, we seek to determine the “global” PDMs of a given system from the estimated kernels of a cohort. This is accomplished through singular value decomposition (SVD) of a rectangular matrix containing all estimated Volterra kernels in the cohort. We note that the computation of the global PDMs must be based on all subjects because they represent a common frame of reference for all subjects who are subsequently classified according to their respective ANFs. The global PDMs correspond to the selected “significant” singular vectors by applying a selection criterion on the respective singular values.
In this study, we analyze the causal relationship between two EEG signals, in which the frontal signal is taken as the “output” and the occipital signal is taken as the “input”. Using the Laguerre expansion technique, we start with linear modeling (1st order Volterra kernel only) and proceed with nonlinear modeling estimating the 2nd-order Volterra kernels as well. These kernel estimates are used to compute the global PDMs of these cohorts via SVD of a rectangular matrix that contains either all the 1st order kernels (Method 1) or the 1st and 2nd order kernels (Method 2) for all subjects (patients and controls). The resulting PDMs are used to obtain nonlinear models of 5th order. The key to the model estimation problem is the use of the Laguerre expansion technique that keeps the number of free parameters manageable for all models. A detailed description of this methodology is given in the monograph [4]. We summarize below the methodology of PDM-based modeling. The 1st order (linear) Volterra model is:
 |
where
-
•
 is the input (occipital) signal
 -
•
 is the output (frontal) signal
 -
•
{
 } are the zeroth order kernel (constant) and the first order kernel respectively
 -
•
M is the system memory (
 here)
here)
To limit the number of free parameters that must be estimated, the kernels are expanded onto a basis of orthonormal discrete Laguerre functions  . In this study, 7 discrete Laguerre functions with Laguerre parameter 0.6 (
 are found to be adequate to represent the input-output dynamic relations. The optimal value of the Laguerre parameter
  and L is determined through a global search procedure that minimizes the normalized mean square error (NMSE) of the model prediction for all subjects. The selected values of alpha and L determine the system memory (
 in this case). After Laguerre expansion, the linear model is given by the expression:
 |
where
 |
The 8 expansion coefficients ( are estimated by the ordinary least-squares method and the 1st order kernel estimate is given by the expression:
 |
This model has 8 free parameters, as compared to 71 free parameters for the original linear Volterra model.
The second-order Volterra model is given by:
 |
where  denotes the 2nd order kernel. Following the Laguerre expansion technique (
 ), we have:
 |
The number of free parameters in this model is 36, as compared to 2556 free parameter for the original 2nd order Volterra model. The 2nd order Volterra kernel is expressed in terms of the expansion coefficients as:
 |
The PDM-based modeling approach seeks to find the “minimum set” of basis functions (the “global” PDMs) that are able to represent the input-output dynamics adequately for each particular system. This is achieved via SVD of a rectangular matrix composed of the estimated Volterra kernels of the respective cohort using either of two methods:
Method 1: The kernel-based matrix is composed of the 1st order kernel estimates for all subjects;
Method 2: The kernel-based matrix is composed of the 1st and 2nd order kernel estimates for all subjects.
In both methods, the global PDMs are determined as the significant singular vectors of the kernel-based matrix that correspond to singular values satisfying a specified selection criterion (e.g. at least 10% of the maximum singular value). In this study, 5 to 6 global PDMs were selected. The physiological characteristics of these global PDMs will be discussed in the following section. The global PDMs are used to describe the dynamics of this system (via expansions of the system kernels) for all subjects. The possible nonlinearities of the system are described by the respective ANFs, which are subject-specific and can be used for diagnostic purposes. The case of linear models is included in this representation, when the ANFs are linear functions. The output equation for the PDM-based model is:
 |
where
-
•
 is the
  global PDM
 -
•
 is the number of global PDMs
 -
•
 is the ANF of the
  PDM
PDM
In general, the ANFs are taken to be polynomials (typically of 3rd degree):
 |
The polynomial ANF can be replaced by its best linear fit (in a least-squares sense) if reduction of model complexity is desirable. In that case, the linear coefficient is an “effective gain constant” for the respective PDM and can be used as an index for delineating AD patients from control subjects.
Fig. 2 shows a schematic block-diagram of the PDM-based model.
Figure 2.
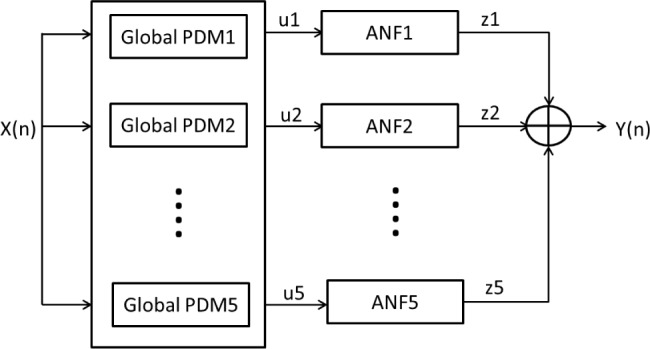
Block-diagram of the PDM-based model of the O1-F3 system with 5 global PDMs. The output  of the jth PDM
  is the convolution of the PDM with the input signal. In this study, the ANFs are taken to be the 5th degree polynomials:
  based on a search procedure that yields the best classification results for the smallest number of free parameters.
C. Spectral and Nonlinear Signal Features
As benchmark, we also compute a number of features that have been reported to characterize the EEG signals in AD [9]–[11]. For each EEG electrode, we compute its: relative power (RP) in  (1Hz–4Hz; RP
 ,
,  (4Hz–8Hz; RP
 ,
,  (8Hz–13Hz; RP
 ),
),  (13Hz–30Hz; RP
 and
and  (30Hz–40Hz; RP
 ) bands; median frequency (MF); and Sample Entropy (SE). The RP features provide a holistic view of the frequency spectrum of the signals [10], whereas MF and SE are two indices that summarize the spectral and nonlinear changes introduced in the brain activity by AD [11], [15]. Finally, we also compute a classical metric of connectivity between frontal and occipital channels: spectral coherence:
  [10], [17].
1). Relative Power (RP)
The assessment of spectral characteristics of the EEG activity is based on the power spectral density (PSD) of each EEG epoch, which is computed as the Fourier transform of its autocorrelation function [11]. The PSDs obtained from segments of 10s of each channel and subject are averaged to compute the mean PSD corresponding to that channel and subject. Then, the PSD is normalized by the total power in the considered broadband (1Hz to 40Hz) to obtain a normalized PSD ( [15]:
[15]:
 |
so that:
 |
If  and
and  are the low and high cut-off frequencies of each band (e.g.,
  Hz and
  Hz for
  , the RP is calculated from the PSDn using [15]:
 |
2). Median Frequency (MF)
MF is a simple index that quantifies the relative strength of low- and high-frequency oscillations. It is defined as the frequency value that separated the frequency range of the PSDn in two bands so that each of them contained half the PSDn power [15]:
 |
3). Sample Entropy (SE)
Approximate entropy is a commonly used metric to quantify irregularity in biomedical recordings. It evaluates the appearance of repetitive patterns in the data [9]. However, this statistic is biased as it counts each sequence as matching itself to avoid the occurrence of log(0) in the computations. To reduce this bias, SE was introduced as a modification of approximate entropy [11].
SE is an irregularity metric that assigns higher values to more irregular signals. SE has two input parameters: a run length  and a tolerance window
  . The time series are split into segments of 10s and the SE is estimated with
  and
and  times the SD of the signal. Then, the SE is averaged across all segments from the same electrode and subject [11]. A detailed description of the algorithm and additional details are available elsewhere [11].
4). Spectral Coherence
Additionally,  is used as a benchmark to measure connectivity between pairs of EEG channels.
  is a function of frequency accounting for linear synchronization between two signals and it is bounded between 0 and 1 [10], [14], [17]. However, it does not discriminate the directionality of the coupling [14], [17]. Decreased coherence indicates reduced functional connections between EEG electrodes or reduced common modulation of the two areas by a third one [10].
Two EEG epochs of equal length— and
and  —are divided into
  equal blocks of 1s each with 50% overlap on the basis of previous analyses [14], [16].
  is computed as [14], [16]:
 |
where  and
and  are the Fourier transforms of
  and
and  , respectively.
  ,
,  , and
, and  denote complex conjugate, magnitude and average over the
  blocks, respectively [14], [16].
5). Phase Slope Index: (PSI)
The concept of phase synchrony may also be used to measure dependencies between EEG signals by examining the interdependence between the corresponding phases, which may be strongly synchronized even if the amplitudes of the signals are statistically independent [14]. A causal relationship between two signals at a certain time lag appears as a constant proportionality between cross-spectral phase and frequency. We will use the PSI to estimate such direction of information flow robustly even in the presence of independent background activity [19].
III. Results
A. Modeling
The predictive capability of the obtained PDM-based model is assessed by the Normalized Mean Square Error (NMSE) of the respective model prediction. The minimum NMSE among the four combinations of occipital-to-frontal input-output systems was obtained for the nonlinear model of the O1-to-F3 system (NMSE=89.7%), only slightly better than its linear counterpart (NMSE=91.2%). It is evident that the model prediction only accounts for a small portion of the output signal, but this should be expected in a system of such low signal-to-noise ratio.
5 PDMs for the O1-to-F3 model were obtained using Method 2. For the sake of clarity, only 4 PDMs are shown in Fig. 3 and Fig. 4 for the frequency-domain and time-domain respectively. In the frequency domain (Fig. 3), the global PDMs exhibit spectral characteristics that correspond to the following neural rhythm bands:
-
•
1st PDM (solid): beta band (
 Hz)
Hz) -
•
2nd PDM (dashed): alpha band (
 Hz)
Hz) -
•
3rd PDM (dash-dot): low delta band (
 Hz);
Hz); -
•
4th PDM (dotted): combination of theta (
 Hz) with delta band (
 Hz);
Hz); -
•
5th PDM: high delta (
 Hz).
Hz).
The 2nd and 4th PDMs were found to be the most differentiating between AD patients and control subjects (see below).
Figure 3.
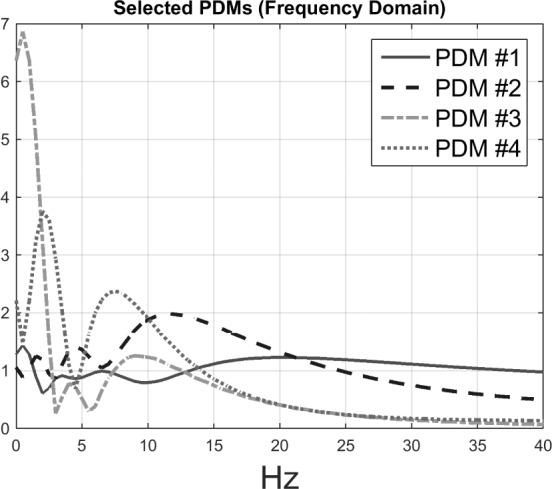
Frequency-domain representations of the global PDMs of the input-output model for the O1-to-F3 system (four out of five PDMs are plotted for the sake of clarity, see text).
Figure 4.
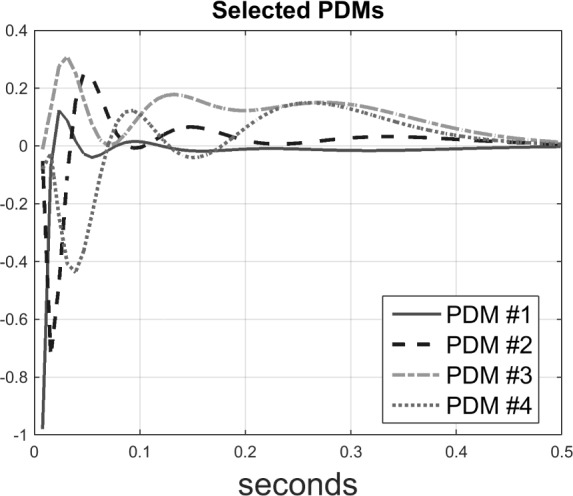
Time-domain representations of the global PDMs of the input-output model for the O1-to-F3 system (four out of five PDMs are plotted for the sake of clarity, see text).
The average Associated Nonlinear Functions (ANFs) for the nonlinear models of the O1-to-F3 system (defined as 5th degree polynomials in this application) are shown in Fig. 5 with dark line for the 17 AD patients (bottom row) and the 24 control subjects (top row), along with the best (in mean-square sense) linear fits shown in gray. It is evident in Fig. 5 that the slope of the 4th ANF changes sign for the patients (i.e. becomes positive for the AD patients from negative for the controls), and the negative slopes of the 3rd and 5th ANFs decrease (in absolute value) for the patients. This suggests that these three PDMs are more likely to provide the means for differentiation between patients and controls. However, the difference between the average values of ANF slopes may not portray correctly the separation between the two groups which relies on the distribution of the individual values.
Figure 5.
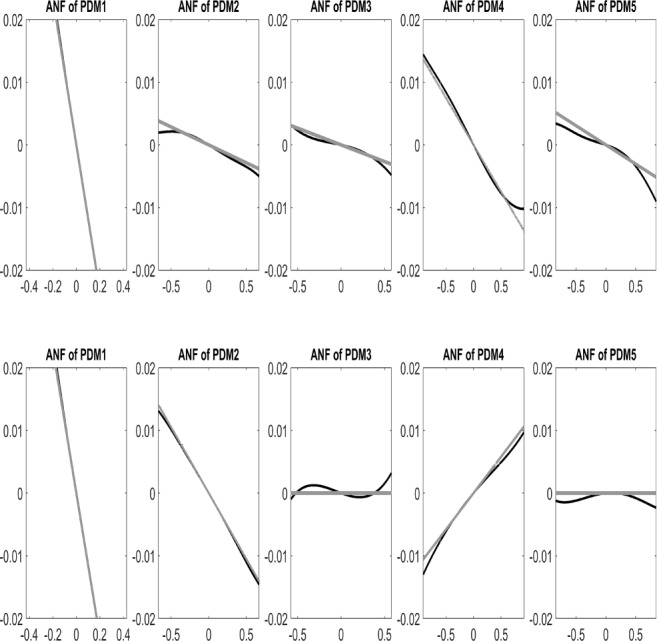
Average ANFs (dark line) for the 5 PDMs of the 17 AD patients (bottom row) and 24 control subjects (top row), along with the best linear fits (gray line) for the O1-to-F3 system.
After examining the differentiating capability of all pair combinations of PDMs/ANFs, it was found that the 2nd and 4th PDMs (Fig. 8, and their respective linear trends) are the most differentiating between patients and controls for O2-F3 system, as shown in the scatter-plot of Fig. 6. They result in one false-positive (#40) and two false-negatives (#3 and #17). The sensitivity of 88.2% and specificity of 95.8% are marked on the corresponding ROC curve shown in Fig. 7.
Figure 8.
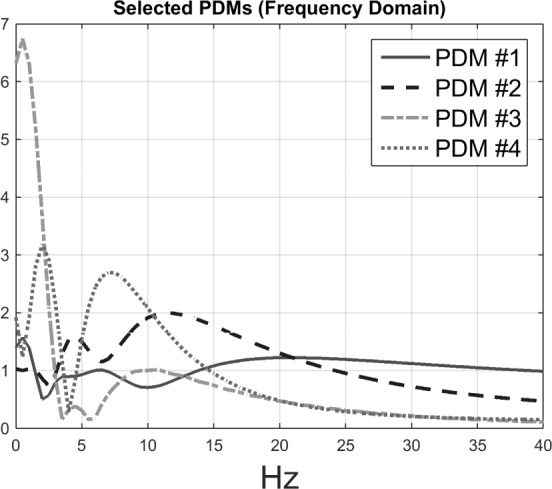
Frequency-domain representations of global PDMs of the input-output model for the O2-to-F3 system (four out of six PDMs are plotted for the sake of clarity, see text).
Figure 6.
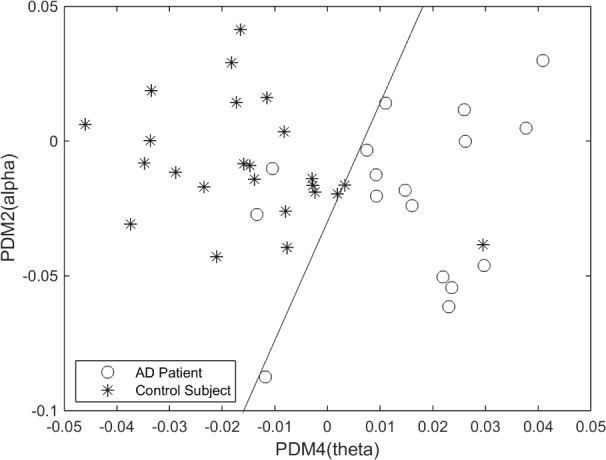
Scatter-plot of computed ANF linear trends (slopes) for 2nd and 4th PDMs of the O2-to-F3 system, corresponding to the alpha-delta and theta-delta bands. One false-positive and two false-negatives are shown. The classification line has been obtained by nonlinear regression algorithm (with 150 000 iterations).
Figure 7.
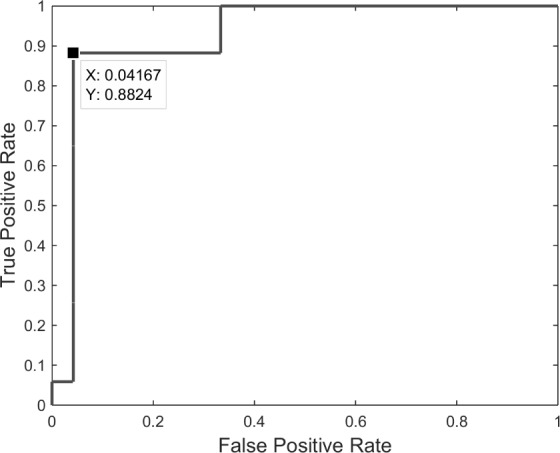
ROC curve for the scatter-plot of Fig. 6 (2nd versus 4th ANF/PDMs) of the O2-to-F3 system.
We note that satisfactory delineation between the two groups is also achieved in the O1-F3 system (see scatter-plot in Fig. 9) using the pair of 2nd and 4th PDMs/ANFs that correspond to the alpha-delta and theta-delta bands respectively, as shown in Fig. 3. Two false-negatives (#13, #17. Sensitivity of 88.2%) and two false-positives (#29, #40. Specificity of 91.7%) result in this case. This suggests that the use of more than two PDMs/ANFs ought to be explored for differentiation of patients from controls.
Figure 9.
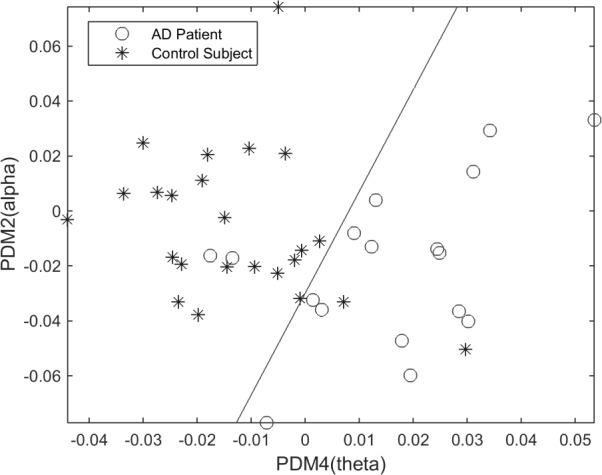
Scatter-plot of computed ANF linear trends (slopes) for 2nd and 4th PDMs of the O1-to-F3 system, corresponding to the alpha-delta and theta-delta bands. Two false-negatives and two false-positives are shown.
B. Benchmark Features
A number of features were computed from the same EEG signals, including the RPs in five spectral bands, MF and SE. These features were calculated from single channels in contrast with the PDM modeling. However, they have been reported to discriminate between the electromagnetic brain activity of AD and control subjects [9]–[11]. Hence, they are used here as benchmark for comparison purposes. Fig. 10 shows the boxplots of the RPs for each EEG electrode for AD patients and controls subjects. The bottom and top of the boxplot show the first and third quartiles respectively, with the middle band representing the median (second quartile). Outliers are shown as crosses, with the maximum and minimum values of the data after exclusion of outliers shown as black bars above and below the boxplot. Similarly, Fig. 11 and Fig. 12 depict the boxplots for MF and SE, respectively.
Figure 10.
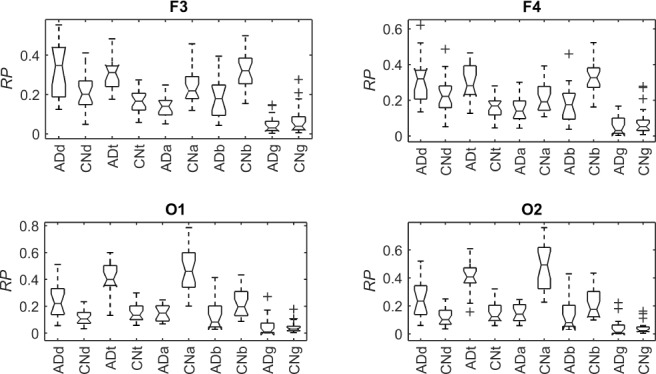
Boxplots with the distributions of RP in  (“d”),
  (“t”),
  (“a”),
  (“b”), and
  (“g”) bands for AD patients and control subjects (“CN”) at F3, F4, O1, and O2.
Figure 11.
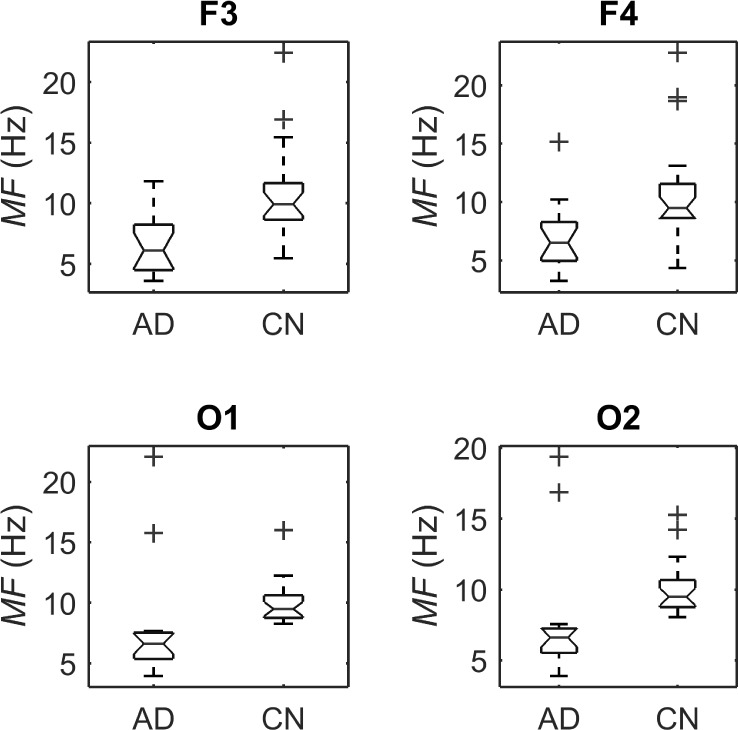
Boxplots with the distributions of MF for AD patients and control subjects (“CN”) at F3, F4, O1, and O2.
Figure 12.
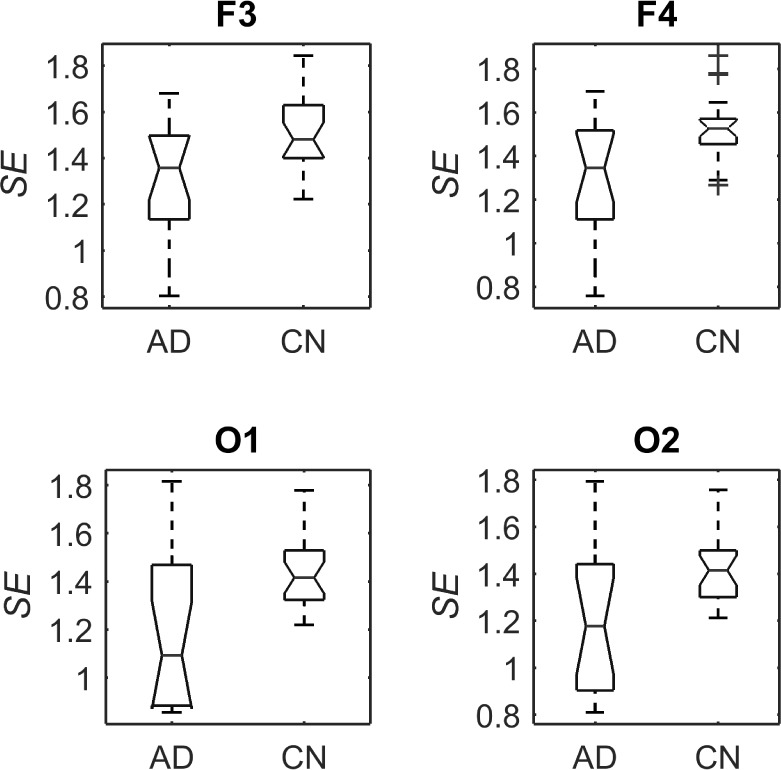
Boxplots with the distributions of SE for AD patients and control subjects (“CN”) at F3, F4, O1, and O2.
Student’s t-tests indicated that there were significant differences ( -value<0.01) between AD patients and control subjects at electrodes F3 for MF, SE, RP
 , RP
, RP , RP
, RP , and RP
 ; at F4 for MF, SE, RP
 , and RP
 ; at O1 for RP
 , RP
, RP , and RP
 ; and at O2 for RP
 , RP
, RP , and RP
 . The
. The  between the pairs of electrodes F3-O1 and F4-O2 was also computed. The distribution of the results appears in Fig. 13 as boxplots. In this case, there were no significant differences (all
  -values >0.10) between AD patients and control subjects for the average
  in each spectral band. Finally, the connectivity result computed with the phase slope index yields statistically significant result between the pairs of F3-O1 at PSI
 and PSI
 , with p-values equal to 0.02.
Figure 13.
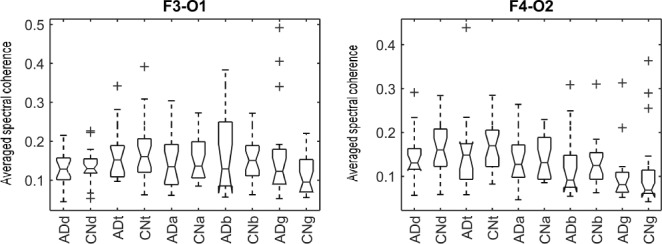
Boxplots with the distributions of the average c(f) value for the pairs of electrodes F3-O1 and F4-O2 in  (“d”),
  (“t”),
  (“a”),
  (“b”), and
  (“g”) bands for AD patients and control subjects (“CN”).
Among the features with significant differences, the highest areas under the ROC curve for the separation between AD and control subjects were achieved at O1 and O2 with the feature RP (areas of 0.983 and 0.990, respectively).
C. Combined Feature Analysis
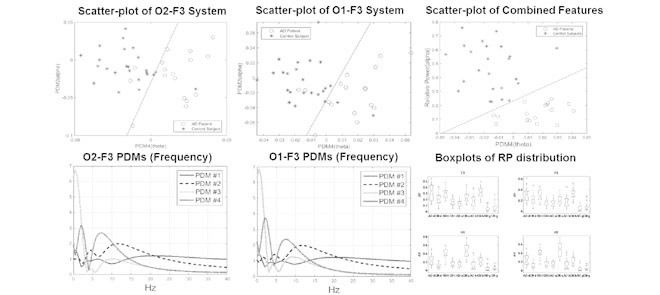
We explored combining the best classification features of the two approaches (i.e. those with most differentiating capability from PDM modeling and from Relative Power measurement) and achieved complete separation of patients from controls by using the 4th PDM of the O1-F3 system and the Relative Power in the alpha band measured at O1 (Fig. 14), or the 4th PDM of the O2-F3 system and the Relative Power in the alpha band measured at O2 (Fig. 15).
Figure 14.
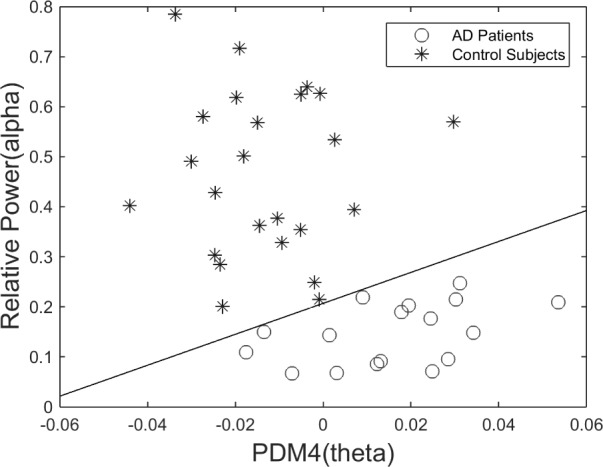
Scatter-plot of computed ANF linear trends (slopes) for 4th PDMs of the O1-to-F3 system, corresponding to the theta-delta band, versus the Relative Power in O1 corresponding to the alpha band. This classification plot shows no false-negatives and no false-positives.
Figure 15.
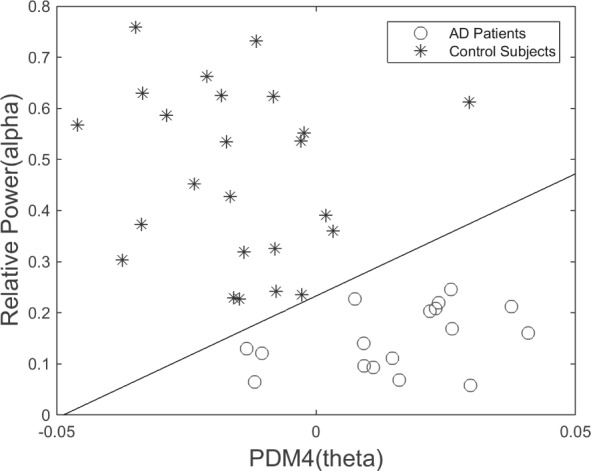
Scatter-plot of computed ANF linear trends (slopes) for 4th PDMs of the O2-to-F3 system, corresponding to the theta-delta band, versus the Relative Power in O2 corresponding to the alpha band. This classification plot shows no false-negatives and no false-positives.
IV. Discussion and Conclusion
We have presented a methodology for input-output modeling of the dynamic relationships between EEG recordings in AD patients and control subjects that can be used for diagnostic delineation of the two groups. The methodology is based on the concept of Principal Dynamic Modes (PDMs) and their associated nonlinear functions (ANFs) that has been recently developed and applied successfully to various physiological systems.
Preliminary results of the application of this methodology to data collected from 17 AD patients and 24 control subjects offer considerable promise. Specifically, when the effective gain coefficients of the 2nd and 4th PDMs (i.e. the slopes of the linear trends in their respective ANFs) are used as classifiers for the O2-F3 system, we have one false-positive and two false-negatives (see Fig. 6) – i.e. 88.2% sensitivity and 95.8% specificity. Likewise, when the effective gain coefficients of the 2nd and 4th PDMs are used as classifiers for the O1-F3 system, we have two false-negatives and two false-positves (see Fig. 9, i.e. 82.3% sensitivity and 91.7% specificity). This suggests that the use of more than two PDMs/ANFs ought to be explored for differentiation of patients from controls. The classification line is obtained through nonlinear regression. The ROC curve also demonstrates promising performance of these classifiers (see Fig. 7). The best classifiers for both O1-F3 and O2-F3 systems corresponded to the PDMs with theta-delta spectral characteristics, consistent with previously reported observations of increased theta and delta activity in the left hemispheric frontal region in AD patients compared to control subjects, as well as decreased alpha activity in AD patients [1]–[3]. If these results become confirmed in larger numbers of subjects, then the proposed approach will offer a valuable non-invasive diagnostic tool for AD. These initial results are consistent with the current view that elevated theta activity in the awake adult may indicate abnormal neurological conditions, and reduced alpha activity may reflect (in part) a state of heightened anxiety in AD patients. We note, however, that our PDM-based analysis yields classification features that concern the causal relation between two EEG signals (e.g. O1 as a putative “input” and F3 as a putative “output”), while activity within a neural-rhythm band concerns simply the spectral characteristics of the signals themselves.
Even though the coherence  only captures linear interactions between signals, previous research has suggested that it is strongly correlated with other commonly used synchronization measures [14]. However, there have been differences in the findings of previous studies about how AD affects brain connectivity. This might be due to differences in the analyzed populations, the heterogeneity of the disease and small differences in the connectivity metrics [15]. The use of PDM-based connectivity models addresses some of these issues by extending the analysis of the data into the nonlinear domain and, more importantly, by focusing on the dynamic relation between two EEG signals (measured at the frontal and occipital lobes in this case) and not the temporal or spectral structure of the signals themselves. This distinction may prove useful because it removes part of the potential ambiguity in differentiating patients from controls by virtue of the fact that the employed “classification feature” (i.e. the slope of the ANFs in this case) is independent of the particular neural activity that defines the spectro-temporal signal structure at the time of data collection. In other words, the PDM-based approach focuses on the system between the two signals and not on the signals themselves.
We examined the correlation between the PDM gain that yielded the best classification result (PDM4 in the O2-to-F3) and the Relative Power in O2 corresponding to theta band (RP that is dominant in PDM4. This correlation is statistically significant with correlation coefficient of 0.81 and p-value less than 0.0001. Similar result was obtained between the PDM4 in the O1-to-F3 system (delta-theta band) and the RP
 in O1 (correlation coefficient equal to 0.82 and p-value < 0.0001). Similarly, the most delineating features in the benchmark study: RP
 in O1 and O2, also correlate with their PDM counterparts (gain of PDM2 corresponding to the alpha band) with correlation coefficient equal to 0.3 and p-value < 0.05. These findings suggest that the RP measurements in theta and alpha band achieve similar delineation between patients and controls as PDM analysis. It was shown that perfect delineation between patients and controls was achieved when the best PDM and RP features were combined (see Fig. 14 and Fig. 15).
The findings of the PDM analysis imply that AD patients may have slower neural connectivity than controls between the occipital and the frontal cortical regions, as suggested by the higher gains in theta band and lower gains in alpha band. This is consistent with current views of the progressive impairment of cortical connectivity in neurodegenerative diseases.
Although our sample size is insufficient to prove the clinical utility of the reported EEG analyses for AD diagnosis, it is beneficial to relate our research to the current framework for AD diagnosis in clinical practice and research [8], [18]. Current criteria distinguish between the pathological process of AD and the observable symptoms caused by that process [8], [18]. Whereas the clinical diagnosis of AD must be performed using only the patient’s cognitive and behavioral symptoms [8], a few biomarkers (magnetic resonance imaging, biochemical levels in the cerebrospinal fluid, specific genetic factors and positron emission tomography) can increase or decrease the certainty that clinical symptoms are due to an underlying AD pathology [8], [18]. Although EEG is not currently included in such list of biomarkers, it provides a direct measure of the brain activity. Furthermore, it is noninvasive and affordable. Therefore, it holds promise to become, after suitable signal processing, a widely available method to support clinicians in the diagnosis of the disease.
Our preliminary results are promising but they are inevitably affected by various sources of errors, including the variability in physiological mechanisms and measurement instrumentation. Therefore, these potential errors must be further examined in future studies. We must emphasize that the sensitivity of parameter selection for model estimation is a critical issue for the reproducibility of results in a clinical context and, therefore, it should be examined in future studies with larger sample size and different clinical settings.
Another limitation of this study is that the average ages of the two subject groups were different. However, the AD patients were recruited following standard clinical procedures and the dataset have been used in a number of research studies [12]. Moreover, the probable AD subjects had not previously been diagnosed (prior to the assessment at the memory clinic that led to their referral to the EEG department). Thus, they were in the early stages of exhibiting clinical symptoms. Finally, the subjects did not perform any task. Hence, the classification performance might improve by analyzing signals acquired during specific experimental settings [14].
Biographies

Yue Kang was born in China in 1989. She received the B.Sc. degree in electrical engineering from the Beijing University of Posts and Telecommunications, Beijing, China, in 2011, and the M.Sc. degree in biomedical engineering from the University of Southern California, Los Angeles, CA, USA, in 2013, where she is currently pursuing the Ph.D. degree with the Biomedical Simulations Resource. Her research interests include biomedical signal processing and computational modeling of dynamic physiological systems, with a focus on improved clinical diagnosis.

Javier Escudero (S’07–M’10) received the M.Eng. and Ph.D. degrees in telecommunications engineering from the University of Valladolid, Valladolid, Spain, in 2005 and 2010, respectively. He held a post-doctoral position with Plymouth University, Plymouth, U.K., until 2013. He is currently a Tenure-Track Faculty Member (Chancellor’s Fellow) with The University of Edinburgh, Edinburgh, U.K. He has authored over 25 articles in biomedical data processing. His research interests include biomedical signal processing, multiway decompositions, graph theory, and pattern recognition in clinical applications. He was a recipient of the Third Prize of the EMBS Student Paper Competition in 2007 and the Best Ph.D. Thesis Award in healthcare technologies by the Spanish Organization of Telecommunications Engineers in 2010.

Dae Shin (S’81–M’95) received the B.S. and M.S. degrees from Seoul National University, Seoul, Korea, in 1982 and 1984, respectively, and the M.S. and Ph.D. degrees from the University of Southern California, in 1988 and 1994, respectively, all in electrical engineering. He was a Technical Staff Member with the Electrical and Telecommunication Research Institute in Korea (1984–1985). After one year of post-doctoral work with the University of Southern California (1994–1995), he was a Chief Engineer of MultiSpec Corporation (1995–2002), a high-tech company specializing on advanced telemetry systems. Changing his focus to biomedical signal processing, he was a Research Scientist with the Alfred Mann Institute, University of Southern California (2002–2008), where he is currently a Senior Research Associate with the Department of Biomedical Engineering. He has authored many papers in peer-reviewed journals and conference proceedings. His primary research interests are in statistical signal processing and linear and nonlinear dynamic modeling of biomedical systems, with a special focus on multi-input/multi-output and closed-loop modeling with applications to neural information processing and physiological autoregulation. He retains a research interest in 3-D ultrasound tomography, adaptive signal processing, and radar/sonar signal processing.

Emmanuel Ifeachor received the B.Sc. (Hons) degree in communication engineering from University of Plymouth, the M.Sc. degree in communication engineering from Imperial College, London, and a Ph.D. degree in medical electronics from the University of Plymouth. His primary research interests are in information processing and computational intelligence techniques and their application to problems in communications and biomedicine. His current research include in subject-specific bio data analysis for patient-specific early diagnosis and predictive healthcare in the areas of dementia, Parkinson’s disease, brain injury in the early stages of life, and cancer. He is a Co-Editor-in-Chief of the journal Source Code for Biology and Medicine, and was a Project Coordinator for BIOPATTERN, a 30-partner, 6.4M, EU-funded project. He has successfully led much Government and industry funded projects in biomedicine, multimedia communications, and audio, and has authored extensively in these fields.

Vasilis Marmarelis (M’78–F’97) received the Ph.D. degree in engineering science from the California Institute of Technology, in 1976. He was a Professor of Biomedical Engineering with the University of Southern California. In 2000, he invented the MUT diagnostic imaging system for early detection of breast cancer, which is currently clinically evaluated in Europe. He has been the Co-Director of the Biomedical Simulations Resource, a research center funded by NIH since 1985. He served as the Department Chairman from 1990 to 1996. His key research interests are in dynamic nonlinear modeling of biomedical systems, neural information processing, modeling of physiological autoregulation, multimodal ultrasound tomography (MUT) for diagnostic imaging, and model-based diagnostic physiomarkers. The key application domains of interests are in cerebral hemodynamics and neurodegenerative disease, cognitive systems and neurostimulation, endocrine-metabolic regulation and diabetes, and noninvasive lesion differentiation via MUT diagnostic imaging. He has co-authored a seminal book entitled Analysis of Physiological System: The White Noise Approach (1978; Russian, 1981; Chinese, 1990), and authored a monograph entitled Nonlinear Dynamic Modeling of Physiological Systems (2004). He has authored over 150 journal papers and book chapters. He is a fellow the American Institute for Medical and Biological Engineering.
Funding Statement
This work was supported by the National Institute of Biomedical Modeling and Simulations Resource, University of Southern California, Los Angeles, CA, USA, through the National Institutes of Health, New York, NY, USA, under Grant P41-EB001978.
References
- [1].Sankari Z., Adeli H., and Adeli A., “Intrahemispheric, interhemispheric, and distal EEG coherence in Alzheimer’s disease,” Clin. Neurophysiol., vol. 122, no. , pp. 897–906, May 2011. [DOI] [PubMed] [Google Scholar]
- [2].Ponomareva N. V., Korovaitseva G. I., and Rogaev E. I., “EEG alterations in non-demented individuals related to apolipoprotein E genotype and to risk of Alzheimer disease,” Neurobiol. Aging, vol. 29, no. 6, pp. 819–827, Jun. 2008. [DOI] [PubMed] [Google Scholar]
- [3].Adler G., Brassen S., and Jajcevic A., “EEG coherence in Alzheimer’s dementia,” J. Neural Transmiss., vol. 110, no. 9, pp. 1051–1058, Sep. 2003. [DOI] [PubMed] [Google Scholar]
- [4].Marmarelis V. Z., Nonlinear Dynamic Modeling of Physiological Systems. New York, NY, USA: Wiley, 2004. [Google Scholar]
- [5].Marmarelis V. Z., Shin D. C., Orme M. E., and Zhang R., “Model-based quantification of cerebral hemodynamics as a physiomarker for Alzheimer’s disease?” Ann. Biomed. Eng., vol. 41, no. 11, pp. 2296–2317, Nov. 2013. [DOI] [PMC free article] [PubMed] [Google Scholar]
- [6].Wimo A. and Prince M., “World Alzheimer report 2010: The global economic impact of dementia,” Alzheimer’s Disease Int, London, U.K, Tech. Rep., Sep. 2010. [Google Scholar]
- [7].Blennow K., de Leon M. J., and Zetterberg H., “Alzheimer’s disease,” Lancet, vol. 368, no. 9533, pp. 387–403, Jul. 2006. [DOI] [PubMed] [Google Scholar]
- [8].McKhann G. M., et al. , “The diagnosis of dementia due to Alzheimer’s disease: Recommendations from the National Institute on Aging-Alzheimer’s Association workgroups on diagnostic guidelines for Alzheimer’s disease,” Alzheimer’s Dementia, vol. 7, no. 3, pp. 263–269, May 2011. [DOI] [PMC free article] [PubMed] [Google Scholar]
- [9].Sanei S. and Chambers J. A., EEG Signal Processing. New York, NY, USA: Wiley, 2008. [Google Scholar]
- [10].Jeong J., “EEG dynamics in patients with Alzheimer’s disease,” Clin. Neurophysiol., vol. 115, no. 7, pp. 1490–1505, Jul. 2004. [DOI] [PubMed] [Google Scholar]
- [11].Hornero R., Abásolo D., Escudero J., and Gómez C., “Nonlinear analysis of electroencephalogram and magnetoencephalogram recordings in patients with Alzheimer’s disease,” Philos. Trans. Roy. Soc. A-Math. Phys. Eng. Sci., vol. 367, no. 1887, pp. 317–336, Jan. 2009. [DOI] [PubMed] [Google Scholar]
- [12].Henderson G., et al. , “Development and assessment of methods for detecting dementia using the human electroencephalogram,” IEEE Trans. Biomed. Eng., vol. 53, no. 8, pp. 1557–1568, Aug. 2006. [DOI] [PubMed] [Google Scholar]
- [13].Stam C. J., et al. , “Graph theoretical analysis of magnetoencephalographic functional connectivity in Alzheimer’s disease,” Brain, vol. 132, no. 1, pp. 213–224, Jan. 2009. [DOI] [PubMed] [Google Scholar]
- [14].Dauwels J., Vialatte F., Musha T., and Cichocki A., “A comparative study of synchrony measures for the early diagnosis of Alzheimer’s disease based on EEG,” NeuroImage, vol. 49, no. 1, pp. 668–693, Jan. 2010. [DOI] [PubMed] [Google Scholar]
- [15].Escudero J., Ifeachor E., Fernández A., López-Ibor J. J., and Hornero R., “Changes in the MEG background activity in patients with positive symptoms of schizophrenia: Spectral analysis and impact of age,” Physiological Meas., vol. 34, no. 2, p. 265, Feb. 2013. [DOI] [PubMed] [Google Scholar]
- [16].Escudero J., Sanei S., Jarchi D., Abásolo D., and Hornero R., “Regional coherence evaluation in mild cognitive impairment and Alzheimer’s disease based on adaptively extracted magnetoencephalogram rhythms,” Physiological Meas., vol. 32, no. 8, pp. 1163–1180, Aug. 2011. [DOI] [PubMed] [Google Scholar]
- [17].Greenblatt R. E., Pflieger M. E., and Ossadtchi A. E., “Connectivity measures applied to human brain electrophysiological data,” J. Neurosci. Methods, vol. 207, no. 1, pp. 1–16, May 2012. [DOI] [PMC free article] [PubMed] [Google Scholar]
- [18].Sperling R. A., et al. , “Toward defining the preclinical stages of Alzheimer’s disease: Recommendations from the National Institute on Aging-Alzheimer’s Association workgroups on diagnostic guidelines for Alzheimer’s disease,” Alzheimer’s Dementia, vol. 7, no. 3, pp. 280–292, May 2011. [DOI] [PMC free article] [PubMed] [Google Scholar]
- [19].Nolte G., et al. , “Robustly estimating the flow direction of information in complex physical systems,” Phys. Rev. Lett., vol. 100, no. 23, p. 234101, Jun. 2008. [DOI] [PubMed] [Google Scholar]


