ABSTRACT
BACKGROUND AND PURPOSE
Pathologic diagnosis is the gold standard in evaluating imaging measures developed as biomarkers for pathologically defined disorders. A brain MRI atlas representing autopsy‐sampled tissue can be used to directly compare imaging and pathology findings. Our objective was to develop a brain MRI atlas representing the cortical regions that are routinely sampled at autopsy for the diagnosis of Alzheimer's disease (AD).
METHODS
Subjects (n = 22; ages at death = 70‐95) with a range of pathologies and antemortem 3T MRI were included. Histology slides from 8 cortical regions sampled from the left hemisphere at autopsy guided the localization of the atlas regions of interest (ROIs) on each subject's antemortem 3D T1‐weighted MRI. These ROIs were then registered to a common template and combined to form one ROI representing the volume of tissue that was sampled by the pathologists. A subset of the subjects (n = 4; ages at death = 79‐95) had amyloid PET imaging. Density of β‐amyloid immunostain was quantified from the autopsy‐sampled regions in the 4 subjects using a custom‐designed ImageScope algorithm. Median uptake values were calculated in each ROI on the amyloid‐PET images.
RESULTS
We found an association between β‐amyloid plaque density in 8 ROIs of the 4 subjects (total ROI n = 32) and median PiB SUVR (r 2 = .64; P < .0001).
CONCLUSIONS
In an atlas developed for imaging and pathologic correlation studies, we demonstrated that antemortem amyloid burden measured in the atlas ROIs on amyloid PET is strongly correlated with β‐amyloid density measured on histology. This atlas can be used in imaging and pathologic correlation studies.
Keywords: Alzheimer's disease, atlas, MRI, pathology
Introduction
Pathologic diagnosis is the gold standard in the evaluation of imaging markers developed for specific pathophysiologic processes.1 Existing studies investigate imaging‐pathology correlations in individual subjects or, in cohort studies, use anatomic atlases developed for antemortem MRI studies. Some even limit their MRI analysis to global measures or standard biomarkers such as whole brain, ventricular, and hippocampal volumes.2 A brain MRI atlas composed of regions of interest (ROIs) that correspond to the standard anatomic tissue blocks sampled at autopsy has an advantage in that it can be utilized in direct image to tissue comparisons between the imaging and pathology findings. Since AD pathologies have a regional pattern of spread,3, 4 if an ROI does not encompass the area that is sampled for histology, the imaging measure might not reflect the level of pathology measured histologically. Therefore, an atlas enabling direct regional comparisons between imaging and pathology findings is crucial. Our objective was to develop a brain MRI atlas representing 8 cortical regions that are routinely sampled at autopsy in our institution for the pathologic diagnosis of Alzheimer's disease (AD).5
Methods
Subjects
The subjects (n = 22; ages at death = 70‐95) used to generate the atlas were selected from an autopsy cohort. They were participants in 1 of 3 prospective studies during the years of 1999 through 2014: (1) dementia clinic‐based Mayo Clinic Alzheimer's Disease Research Center; (2) community clinic‐based Alzheimer's Disease Patient Registry; and (3) population‐based Mayo Clinic Study of Aging.6, 7 Individuals participating in these prospective cohorts on aging and dementia undergo approximately annual MRI, clinical and neuropsychological examinations. Inclusion criteria were: patients with 3T MRI acquired within 4.5 years before death, with the left brain hemisphere sampled at autopsy, and with a range of AD pathology, Lewy body pathology and microinfarcts (Table 1). Participants with conditions such as epilepsy, tumors, or severe head trauma were excluded because these may cause focal structural changes on MRI. The limit of MRI acquisition occurring 4.5 years before death was chosen to remain close to the time of death, while allowing for a large enough sample size.
Table 1.
Characteristics of Subjects Used to Make Atlas
| n = 22 | |
|---|---|
| Age at MRI, median (range) | 86.5 (68, 99) |
| Female sex, n (%) | 8 (36) |
| Years between last MRI and death | 1.59 (.14, 4.1) |
| Pathologic diagnosis of likelihood AD, n (%) | |
| Low | 8 (36) |
| Intermediate | 7 (32) |
| High | 6 (27) |
| Lewy bodies present, n (%) | 4 (18) |
| Cortical microinfarcts present, n (%) | 16 (73) |
| Argyrophilic grains disease, n (%) | 1 (4) |
AD = Alzheimer's disease.
Standard Protocol Approvals, Registrations, and Patient Consents
This study was approved by the Mayo Clinic Institutional Review Board and all subjects or appropriate surrogates provided informed consent for participation.
Image Acquisition
All subjects underwent MRI at 3 Tesla (GE Healthcare, Milwaukee, WI, USA). 3D T1‐weighted images (Magnetization Prepared Rapid Acquisition Gradient Echo, 8 channel head coil, slice thickness = 1.2 mm, FOV = 26 cm, matrix = 256 × 256, bandwidth = 31.25, TR = 2300 ms, TE = 3.044, scan time = 9:17) were acquired for all patients.
A subset of the subjects (n = 4; ages at death = 79‐90) had 11C Pittsburgh compound‐B (PiB‐PET) amyloid imaging acquired within 2.5 years before death. PiB‐PET imaging consisted of 4 × 5 minute serial image frames acquired from 40 to 60 minutes after injection of 292‐ to 729‐MBq 11C‐PiB.8
Neuropathology
Neuropathologic sampling followed recommendations of the Consortium to Establish a Registry for Alzheimer's disease (CERAD),5 and in addition included the posterior cingulate gyrus because it is a region that is affected early in AD.9 The 8 sampled cortical regions included in the atlas were: anterior cingulate, posterior cingulate, posterior hippocampus, primary motor cortex, midfrontal gyrus, inferior parietal lobule, superior temporal gyrus, and primary visual/visual association cortices. All regions are from the sampled left brain hemisphere.
Atlas Generation
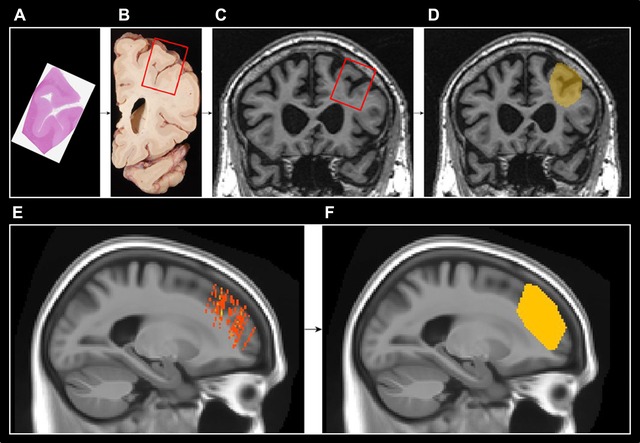
For each subject, 5‐μm‐thick tissue sections (Fig 1A) from all 8 regions were stained with hemotoxylin and eosin and the slides were digitally scanned at 20× using ScanScope XT (Aperio, Vista, CA, USA). These digital images were compared to photographs (Fig 1B) of 3‐cm‐thick gross tissue slabs taken during the autopsy. The tissue slab photographs then guided the visual localization of the sampled regions on each subject's antemortem 3D T1‐weighted image (Fig 1C). Reorientation of the MRI so that the angle of the MRI slices matched the angle and positioning of the tissue slabs was performed manually in Analyze version 12.0 (Mayo Clinic) software. Sampled regions were then manually drawn as a single‐slice mask on each subject's reoriented 3D T1‐weighted image in FSLView version 3.2.0 (Fig 1D). Each mask was assigned a different number. Figure 1A is a diagram of this process.
Figure 1.

Diagram of atlas generation. (A‐D) In each subject, slides from sampled regions stained with hemotoxylin and eosin were used to identify the sampled regions on digital images of gross tissue. This then guided the localization of the sampled regions in the left hemisphere on each subject's antemortem 3D T1‐weighted image. Sampled regions were then drawn as a single slice mask on each subject's 3D T1‐weighted image in FSL view. (E‐F) Each subject's drawn ROI was then then registered to a common template and the convex hull that encompassed all of the 22 subjects’ sampled regions was used to generate an ROI. The example shown in this figure is the midfrontal gyrus ROI.
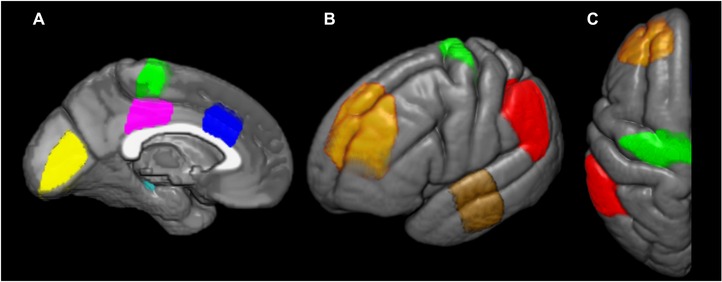
The 8 ROIs in each subject's native space image were then registered to a common population‐specific template generated in‐house from 202 adults ranging from ages 30 to 89 with cognitive statuses ranging from cognitively normal to Alzheimer's disease (colored masks on common template in Fig 1E). For each of the 8 cortical regions, the smallest 3D convex envelope that encompassed all of the 22 subjects’ sampled regions (the convex hull) was calculated and used as that region's ROI (Fig 1F). The resulting ROI represents the volume of tissue from which pathologists would likely sample for that region (Fig 2).
Figure 2.

Atlas ROIs overlaid on the left hemisphere of a common template. Medial (A), lateral (B), and axial (C) views of the atlas ROIs. Yellow = primary visual cortex; cyan = posterior hippocampus; magenta = posterior cingulate gyrus; green = primary motor cortex; blue = anterior cingulate gyrus; orange = midfrontal gyrus; brown = superior temporal gyrus; red = inferior parietal lobule.
Atlas Validation
Atlas validation was performed using a subset of the subjects (n = 4) who had PiB‐PET amyloid imaging acquired within 2.5 years before death and comparing median standard uptake value ratio (SUVR) of PiB with regional β‐amyloid plaque density.
PiB‐PET images were registered to each subject's corresponding T1‐weighted MR image using SPM12 with 12 degrees of freedom and resampled using third‐order B‐Spline interpolation.10 Segmentation of the T1‐weighted images was performed using SPM12.11 The population‐specific template was warped to each T1‐weighted image using the ANTs SyN algorithm and atlas ROIs were transformed using nearest‐neighbor interpolation.12 The median PiB standard uptake value ratios (SUVRs) were calculated from voxels segmented as either gray matter or white matter within each atlas ROI, partial‐volume corrected,13 and using the cerebellar gray matter as a reference region.
Regional β‐amyloid plaque densities were determined immunohistochemically. Serial 5‐μm‐thick sections of the 8 ROIs were analyzed using a custom‐designed color deconvolution Image Scope algorithm after immunostaining for amyloid β (33.1.1).
Correlation analysis between β‐amyloid plaque density and median PiB SUVR was performed using JMP software with an adjustment for the time interval between image acquisition and death.
Results
The median time interval between image acquisition and death in the subjects that were used to make the atlas was 1.59 years with a range of .14‐4.1 years (Table 1).
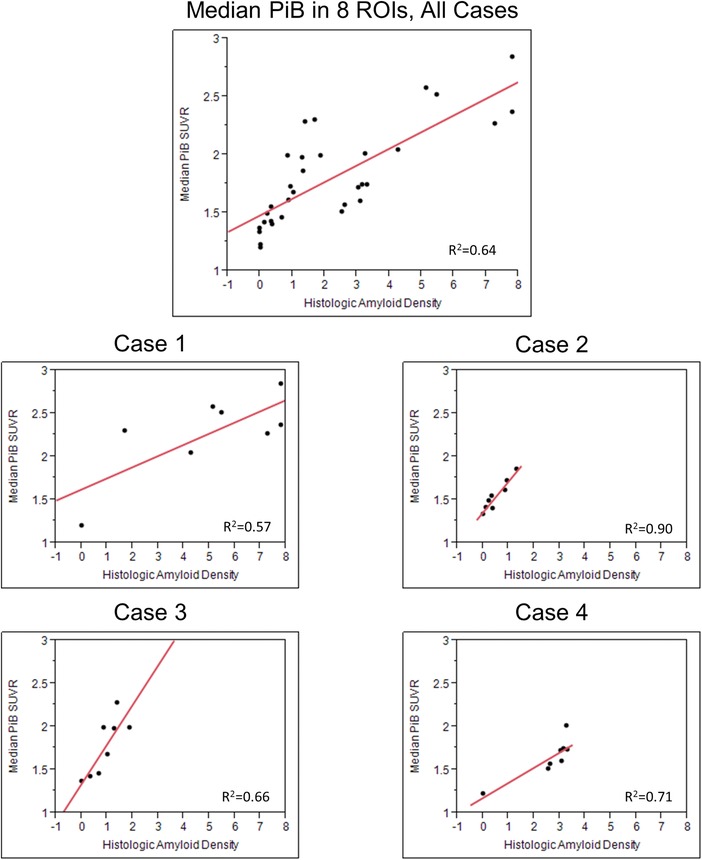
The cases used for validating the atlas had varying levels of AD pathology and densities of neuritic plaques of β‐amyloid (Table 2). In the validation test, a correlation of r 2 = .64 (P < .0001) was found between β‐amyloid plaque density from the pathologically sampled region and median PiB SUVR from the corresponding atlas ROI after adjusting for time from PET scan to death (Fig 3).
Table 2.
Characteristics of Cases Used for PET‐Histology Validation
| Age at death | Sex | Scan to death interval (years) | Pathologic diagnosis of likelihood AD | Frequency of neuritic plaques | |
|---|---|---|---|---|---|
| Case 1 | 95 | F | 2.33 | High | Frequent |
| Case 2 | 89 | M | 1.24 | Low | Moderate |
| Case 3 | 79 | M | .88 | Low | Moderate |
| Case 4 | 84 | M | .90 | Intermediate | Moderate |
PET = positron emission tomography; AD = Alzheimer's disease; F = female; M = male.
Figure 3.

Correlation plots show (1) median 11C Pittsburgh compound‐B (PiB) uptake in all 8 ROIs combined in the 4 cases (n = 32) and (2) individual plots show correlation of histologic amyloid density to median PiB uptake in each case.
Median and range PiB SUVR of the 8 ROIs combined in each of the 4 cases were Case 1 = 2.26 (1.20, 2.57), Case 2 = 1.51 (1.33, 1.86), Case 3 = 1.83 (1.36, 2.27), and Case 4 = 1.65 (1.22, 1.74). The correlation plots of the combined data and of each individual case are shown in Figure 3. ROI PiB SUVR and histologic amyloid density were correlated in Case 1 (r 2 = .57), Case 2 (r 2 = .90), Case 3 (r 2 = .66), and Case 4 (r 2 = .71) after adjusting for time from PET scan to death (Fig 3).
Conclusions
The atlas we have generated represents the image correlate of tissue in 8 cortical regions that are routinely sampled by pathologists for postmortem diagnosis of AD. From our validation analysis, we found that the antemortem amyloid burden measured in the atlas ROIs on amyloid PET is well correlated with β‐amyloid plaque density measured on histology. Case 1 had the lowest PiB uptake to histologic amyloid density correlation (r 2 = .57) and also had the longest scan to death interval (2.33 years) and the latest stage of AD pathology. Even though we adjusted for the scan to death interval, the adjustment assumes a linear build‐up of amyloid pathology over time, when it is more likely a sigmoidal progression with rapid pathology build‐up during disease onset and a plateauing in the later stages of disease.14 This suggests that studies correlating imaging and histology findings in AD patients should try to use scans that occurred as close to the time of death as possible.
The strong group‐level correlation between PiB SUVR measured from atlas‐derived ROIs antemortem, and the Aβ density measured from the histopathologically sampled tissue, postmortem, indicates that the atlas‐derived measures capture the pathologic burden in the brain regions sampled at autopsy. Furthermore, Alzheimer's disease pathology, which follows a spatially and temporally dependent pattern of spread, can be captured correctly. By choosing scans that were acquired close to the time of death (within 2.5 years) and further adjusting for the scan to death time interval, we accounted for the temporal aspect of disease progression and were able to highlight the regional component of pathology spread. This atlas can be used in Alzheimer's disease imaging‐pathology correlation studies, particularly if they are performed in large cohorts with short scan to death time intervals where manual matching between imaging ROIs and pathologically sampled regions in each subject would be time consuming.
Acknowledgment
The authors would like to acknowledge Dr. Robert Reid for his assistance with creating Figure 2.
Disclosures: None.
Funding: Mayo Alzheimer Disease Research grant (P50 AG016574), Mayo Clinic Study on Aging (U01 AG006786), R01‐AG040042, R01‐AG011378, Elsie and Marvin Dekelboum Family Foundation, and Robert H. and Clarice Smith and Abigail van Buren Alzheimer Disease Research Program. M. Raman acknowledges fellowship funding from Mayo Graduate School. Dr. Schwarz reports no disclosures. Dr. Murray is funded by the P50‐NS72187‐03 (Co‐Investigator), and Robert H. and Clarice Smith and Abigail van Buren Alzheimer Disease Research Fellowship. Dr. Lowe serves on scientific advisory boards for Bayer Schering Pharma, Piramal Life Sciences and receives research support from GE Healthcare, Siemens Molecular Imaging, and AVID Radiopharmaceuticals. He receives research funding from NIH. Dr. Dickson is an editorial board member of American Journal of Pathology, Annals of Neurology, Parkinsonism and Related Disorders, Journal of Neuropathology and Experimental Neurology, and Brain Pathology. He is editor in chief of American Journal of Neurodegenerative Disease, and International Journal of Clinical and Experimental Pathology. He receives research support from the NIH (P50 AG016574 [Co‐I], P50 NS072187 [PI]) and CurePSP/Society for Progressive Supranuclear Palsy. Dr. Jack serves as a consultant for Eli Lily. He receives research funding from the National Institutes of Health (R01‐AG011378, R01‐AG041851, RO1‐AG037551, U01‐AG032438, U01‐AG024904), and the Alexander Family Alzheimer's Disease Research Professorship of the Mayo Foundation Family. Dr. Kantarci serves on the data safety monitoring board for Pfizer Inc. and Takeda Global Research & Development Center, Inc; and she is funded by the NIH (R01AG040042 [PI], P50 AG44170/Project 2 [PI], P50 AG16574/Project 1 [Co‐I], U19 AG10483[Co‐I], U01 AG042791[Co‐I]) and Minnesota Partnership for Biotechnology and Medical Genomics (PO03590201[Co‐PI]).
References
- 1. Wardlaw JM. Post‐mortem MR brain imaging comparison with macro‐ and histopathology: useful, important and underused. Cerebrovasc Dis 2011;31:518‐19. [DOI] [PubMed] [Google Scholar]
- 2. Kotrotsou A, Schneider JA, Bennett DA, et al. Neuropathologic correlates of regional brain volumes in a community cohort of older adults. Neurobiol Aging 2015;36:2798‐805. [DOI] [PMC free article] [PubMed] [Google Scholar]
- 3. Braak H, Braak E. Neuropathological stageing of Alzheimer‐related changes. Acta Neuropathologica 1991;82:239‐59. [DOI] [PubMed] [Google Scholar]
- 4. Thal DR, Rub U, Orantes M, et al. Phases of A beta‐deposition in the human brain and its relevance for the development of AD. Neurology 2002;58:1791‐800. [DOI] [PubMed] [Google Scholar]
- 5. Mirra SS, Heyman A, McKeel D, et al. The consortium to establish a registry for Alzheimer's disease (CERAD). Part II. Standardization of the neuropathologic assessment of Alzheimer's disease. Neurology 1991;41:479‐86. [DOI] [PubMed] [Google Scholar]
- 6. Roberts RO, Geda YE, Knopman DS, et al. The Mayo Clinic study of aging: design and sampling, participation, baseline measures and sample characteristics. Neuroepidemiology 2008;30:58‐69. [DOI] [PMC free article] [PubMed] [Google Scholar]
- 7. Petersen RC, Kokmen E, Tangalos E, et al. Mayo Clinic Alzheimer's disease patient registry. Aging (Milano) 1990;2:408‐15. [DOI] [PubMed] [Google Scholar]
- 8. Knopman DS, Jack CR, Jr, Lundt ES, et al. Role of beta‐amyloidosis and neurodegeneration in subsequent imaging changes in mild cognitive impairment. JAMA Neurol 2015:1‐9. [DOI] [PMC free article] [PubMed] [Google Scholar]
- 9. Herholz K, Salmon E, Perani D, et al. Discrimination between Alzheimer dementia and controls by automated analysis of multicenter FDG PET. Neuroimage 2002;17:302‐16. [DOI] [PubMed] [Google Scholar]
- 10. Ashburner J. Computational anatomy with the SPM software. Magn Reson Imaging 2009;27:1163‐74. [DOI] [PubMed] [Google Scholar]
- 11. Ashburner J, Friston KJ. Unified segmentation. Neuroimage 2005;26:839‐51. [DOI] [PubMed] [Google Scholar]
- 12. Avants BB, Epstein CL, Grossman M, et al. Symmetric diffeomorphic image registration with cross‐correlation: evaluating automated labeling of elderly and neurodegenerative brain. Med Image Anal 2008;12:26‐41. [DOI] [PMC free article] [PubMed] [Google Scholar]
- 13. Meltzer CC, Leal JP, Mayberg HS, et al. Correction of PET data for partial volume effects in human cerebral cortex by MR imaging. J Comput Assist Tomogr 1990;14:561‐70. [DOI] [PubMed] [Google Scholar]
- 14. Jack CR, Jr, Knopman DS, Jagust WJ, et al. Tracking pathophysiological processes in Alzheimer's disease: an updated hypothetical model of dynamic biomarkers. Lancet Neurol 2013;12:207‐16. [DOI] [PMC free article] [PubMed] [Google Scholar]


