Abstract
The Human Disease Glycomics/Proteome Initiative (HGPI) is an activity in the Human Proteome Organization (HUPO) supported by leading researchers from international institutes and aims at development of disease-related glycomics/glycoproteomics analysis techniques. Since 2004, the initiative has conducted three pilot studies. The first two were N- and O-glycan analyses of purified transferrin and immunoglobulin-G and assessed the most appropriate analytical approach employed at the time. This paper describes the third study, which was conducted to compare different approaches for quantitation of N- and O-linked glycans attached to proteins in crude biological samples. The preliminary analysis on cell pellets resulted in wildly varied glycan profiles, which was probably the consequence of variations in the pre-processing sample preparation methodologies. However, the reproducibility of the data was not improved dramatically in the subsequent analysis on cell lysate fractions prepared in a specified method by one lab. The study demonstrated the difficulty of carrying out a complete analysis of the glycome in crude samples by any single technology and the importance of rigorous optimization of the course of analysis from preprocessing to data interpretation. It suggests that another collaborative study employing the latest technologies in this rapidly evolving field will help to realize the requirements of carrying out the large-scale analysis of glycoproteins in complex cell samples.
Keywords: Human proteome organization (HUPO), Human disease glycomics/proteome initiative (HGPI), Glycoproteomics
Introduction
One of the fields that has benefitted from the advancement of glycoanalytical technologies is the discovery of novel biomarkers. Sufficiently specific and sensitive biomarkers allow early identification of disease and improved diagnoses, which will lead to safer and more efficacious treatments. Biomarker-based diagnostics may be used in the development of treatment strategies which are tailored to the conditions of individual patients. Over the long term, the use of biomarkers may improve patient welfare by delivering better health outcomes.[1] Importantly they provide disease targets and insights into disease mechanisms and pathways of pathogenesis.
Glycosylation processing pathways have long been known to be altered in most diseases, including cancer and autoimmune diseases as well as in congenital disorders of glycosylation. These changes are potential clinical markers that can be detected on tumour tissue, in the cytosol or on glycoproteins secreted from the tumour cells.
Glycosylation can contribute to the metastatic potential of cells by supporting detachment of cells from the primary tumour, aiding intravasation and extravasation, camouflaging them from the immune system, and promoting angiogenesis [2–4]. The technology now exists to associate altered glycomes directly with genetic disease and epigenetic changes, as well as with transcriptomes, metabolomes, proteomes and other –omics [5–9], providing further insights into the integrated biology of tumour cells and the mechanisms of disease. The potential of glycosylated epitopes in clinical medicine is well recognised; however until recently, translation into practice has been hampered by the lack of rapid, reliable, reproducible technologies for glycan analysis.
The Human Proteome Organization (HUPO) is an international scientific organization representing and promoting proteomics through international cooperation and collaborations by fostering the development of new technologies, techniques and training. The Human Disease Glycomics/Proteome Initiative (HGPI), one of the activities in HUPO, aims to perform disease-related glycomics/glycoproteomics using three major complementary approaches – functional glycomics and high-sensitivity, high-throughput liquid chromatography (LC) and mass spectrometry (MS). The HGPI consists of a number of researchers and collaborators throughout the world who are dedicated to fostering and accelerating research progress in disease glycomics by pursuing collaborative and interdisciplinary research.
The HGPI has conducted three pilot studies on standard glycoprotein analyses as well as congenital disorders of glycosylation (CDG) screening since 2005. In the first study, N-linked glycans were analysed using standardized purified glycoproteins (i.e., immunoglobulin (Ig) G and transferrin) with the participation of 20 laboratories worldwide.[10] In the second pilot study, O-glycomics analysis was conducted on three samples of IgA1 purified from the serum of patients with multiple myeloma by 15 laboratories around the world.[11] The purpose of the former first and second pilot studies was to compare different methods (e.g., LC-based and MS-based technologies) for quantitation of N- and O-linked glycans.
The aim of this third pilot study was to compare the data from a total of 14 labs, which undertook either or both the preliminary analysis (lyophilized cell pellets of three cancer cell lines) and the follow-up analysis (glycoproteins extracted from cell membrane and cytosolic fractions of two cancer cell lines). The labs used different technologies, enabling us to gain some insights into the strengths and limitations of these approaches in this particular field. There are many ways to compare data, including profile comparison, characterising glycans by type (e.g., high–mannose, hybrid, fucosylated, neutral and sialylated complex), reporting critical features (such as levels of Lewis antigens, core fucose, galactosylation or sialylated structures), or providing evidence of antigenic epitopes such as α-Gal from detailed glycan analysis. Here we have emphasised levels of sialic acid as these are important features of cell surface glycosylation that have been implicated in many diseases.
Material and methods
Preliminary analysis: analysis of lyophilized cell pellets
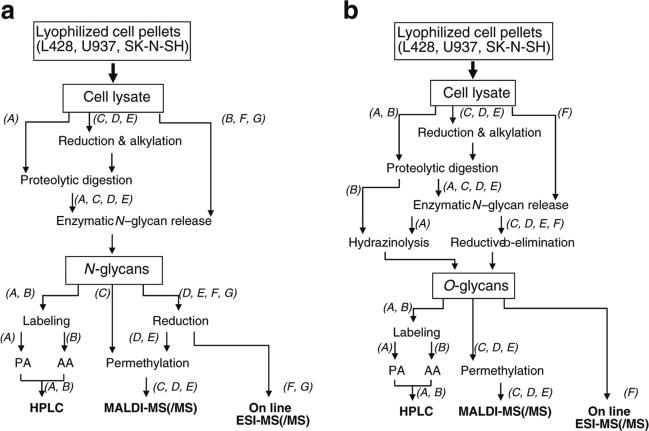
The third pilot study consisted of two approaches. In the first approach, three cancer cell lines (Hodgkin's lymphoma cell [L428], lymphoma cell [U937], neuroblastoma cell [SK-N-SH]: 1×10⁷ cells/cell line) were sent to the participating labs (total of 7 labs [Lab A to G]) as the common target samples. The participants were provided with lyophilized cell pellets. Each lab prepared cell lysates that were analysed in accordance with their own protocols. No optimized or designated process was provided for sample preparation or analysis. The detailed methods used by each lab are shown as Supplementary Method 1. Briefly, 6 labs prepared whole lysates and 1 lab used the membrane fraction for glycan structure analysis. Preparation of samples and analytical methods (Table 1, Fig. 1a, b), and results of the structure analyses are summarized (Figs. 2, 3 and 4, Supplementary Figures 1, 2, 3).
Table 1.
Summary of the analytical methodologies and instruments used for the N- and O-glycan profiling of glycoproteins in lyophilized cell pellets
| Lab code |
N-glycan preparation |
N-glycan derivatization |
O-glycan preparation |
O-glycan derivatization |
Analysis strategy |
MS instrument |
|---|---|---|---|---|---|---|
| Lab A | Pr/Pn | OS/PA | Pr/Pn/Hy | OS/PA | HPLC: AE/RP-LC/FL, MALDI-TOF-MS (+ ion) | Shimadzu AXIMA-CFR MALDI-TOF |
| Lab B | Pn | OS/AA | Pr/AGC | OS/AA | HPLC: Se-LC/FL, MALDI-TOF-MS(MSn) (+ ion) | Shimadzu AXIMA Resonance MALDI-QIT-TOF |
| Lab C | RA/Pr/Pn | OS/PM | RA/Pr/Pn/ β-elim | OSa/PM | MALDI-TOF-MS (+ ion) | ABI Voyager DE Pro MALDI-TOF |
| Lab D | RA/Pr/Pn | OSa/PM | RA/Pr/Pn/β-elim | OSa/PM | MALDI-TOF-MS (+ ion) | Bruker Ultraflex I MALDI-TOF |
| Lab E | RA/Pr/Pn | OSa/PM | RA/Pr/Pn/β-elim | OSa/PM | MALDI-TOF-MS(MSn) (+ ion) | Bruker Reflex IV MALDI-TOF, Shimadzu AXIMA QIT MALDI-QIT-TOF |
| Lab F | Pn | OSa | Pn/β-elim | OSa | PGC-LC-ESI-MS(/MS) (− ion) | Agilent LC/MSD Trap XCT Plus Series 1100 |
| Lab G | RA/Pr/Pn | Osa | Not participated | Not participated | PGC-LC-ESI-MS (+/− ion) | Thermo Fisher Scientific LTQ FT |
AA 2-aminobenzoic acid, AE anion exchange, AGC AutoGlycoCutter, β-elim reductive β-elimination, PGC porous graphitic carbon column, FL fluorescence, Gp glycopeptide, Hy hydrazinolysis, OS oligosaccharides (reducing sugar), OSa oligosaccharide alditols, PA pyridylamination, PM permethylation, Pn peptide-N-glycosidase treatment, N-glycan removal, Pr proteolytic digestion, RA reduction and cysteine derivatization, RP reverse phase, Se serotonin chromatography, +/− ion positive/negative ion mode
Fig. 1.
Flowcharts of various methodologies for the N-glycan profiling (a) and O-glycan profiling (b) of glycoproteins in lyophilized cell pellets. Letters in italics represent laboratory codes. PA pyridylamination, AA 2-aminobenzoic acid, HPLC high performance liquid chromatography, MALDI-MS Matrix-assisted laser desorption/ionization, MS mass spectrometry, ESI electrospray ionization
Fig. 2.
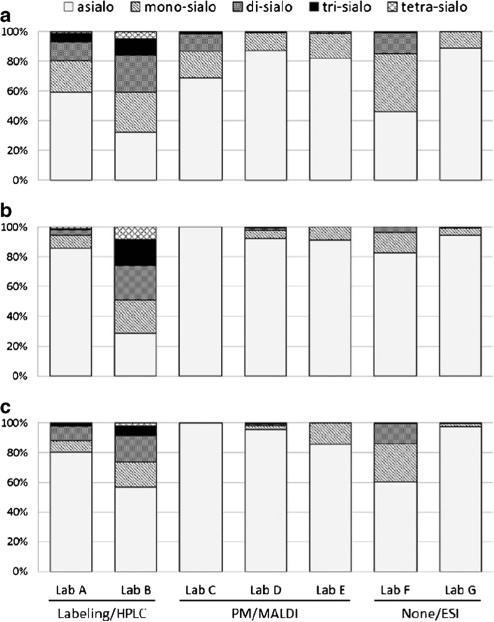
Relative quantities of N-glycans based on the number of sialic acids (asialo, mono-sialo, di-sialo, tri-sialo, tetra-sialo) detected in lyophilized cell pellets (a: L428, b: U937, c: SK-N-SH) by each laboratory. Percentages of all classes to the total glycans are presented. PM permethylation
Fig. 3.
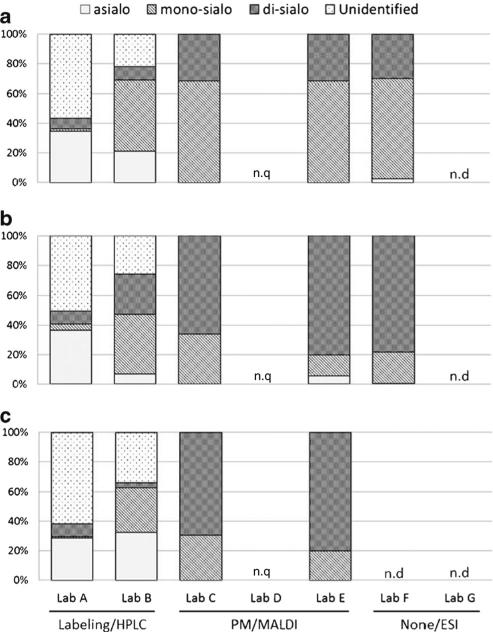
Relative quantities of O-glycans based on the number of sialic acids (asialo, mono-sialo, di-sialo) and the unidentified structures detected in lyophilized cell pellets (a: L428, b: U937, c: SK-N-SH) by each laboratory. Percentages of all classes of the total glycans are presented. n.q not quantified; n.d, not detected
Fig. 4.
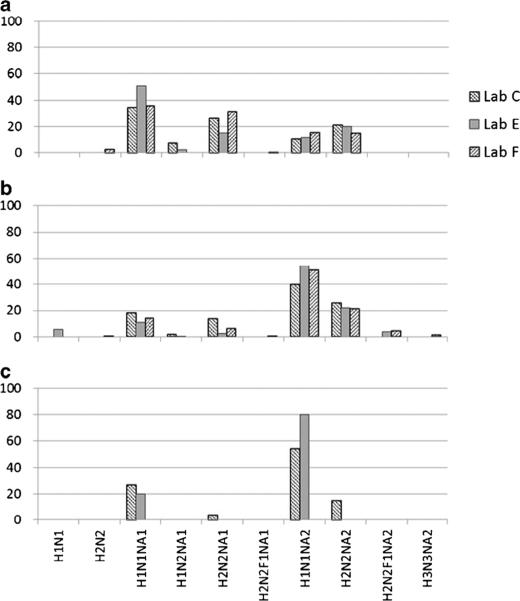
Comparison of O-glycan profiles obtained from lyophilized cell pellets (a: L428, b: U937, c: SK-N-SH) by the laboratories used MS techniques. Percentages of the identified structures to the total glycans are indicated by the compositions as H Hex, N HexNAc, F deoxyHex, NA NeuAc
The results were compared based on the assumption that the protocols were optimized and the experimental processes and repeatability maintained by each laboratory, through the first and second pilot studies. Unlike the first and second HGPI studies on purified proteins, however, there was no standard glycan structure to be used for the appropriate comparative evaluation of the results. Moreover N-glycans on the cell surface are more complex and heterogeneous than on single glycoproteins. In fact, the number of detected glycans was largely different between the different labs and it was impossible to compare the abundance of each structure, since these differences seemed to be associated with the differences in the protocols used for the analysis of the glycans. Therefore, we judged the appropriateness of the analytical results based on the correlation of the relative amounts compared across each lab. Namely, for N-glycans, correlations of results by each analytical method were compared semi-quantitatively based on the number of sialic acids (asialo, mono-sialo, disialo, tri-sialo, tetra-sialo) detected on the glycan structures by each lab (Fig. 2). O-glycans were also evaluated by the number of attached sialic acids as well as by the number of detected structures for those labs which employed similar MS methods (Figs. 3 and 4). This is a rather simple comparison in contrast to the first pilot study in which purified glycoproteins were provided as the common analysis samples. Even so, the results showed no correlation even within the same approach (either high performance liquid chromatography (HPLC) or MS). This was more than likely because of the lack of consistent protocols across the labs for the necessary extraction of total glycoproteins from the crude cell samples for glycan structural analysis. N-glycan structural variation was greater than for O-glycan structures in the analyses, which may be a reflection of the number of the detected N-glycan structures in each lab (from about 30 to 90 structures depending on the laboratory).
Follow-up analysis: analysis of the membrane and cytosolic fractions
Due to the large variation in the preliminary results of the analysis of cell pellets, one laboratory prepared samples by a single extraction method, (Supplementary Methods 2) and the membrane and cytosolic fractions of two cell lines (Hodgkin's lymphoma cell [L428] and lymphoma cell [U937]) were provided to 10 labs (Lab A to L) for analysis. Each laboratory used independent analysis protocols as shown in Table 2 and Supplementary Method 3.
Table 2.
Summary of the analytical methodologies and instruments used for the N- and O-glycan profiling from lyophilized cell membrane and cytosolic fractions
| Lab code |
N-glycan preparation |
N-glycan derivatization |
O-glycan preparation |
O-glycan derivatization |
Analysis strategy |
MS instrument |
|---|---|---|---|---|---|---|
| Lab A | Pr/Pn | OS/PA | Pr/Pn/Hy | OS/PA | HPLC: AE/RP-LC/FL, MALDI-TOF-MS (+ ion) | Shimadzu AXIMA-CFR MALDI-TOF |
| Lab B | Pn | OS/AA | Pr/AGC | OS/AA | HPLC: Se-LC/FL, MALDI-TOF-MS(MSn) (+ ion) | Shimadzu AXIMA Resonance MALDI-QIT-TOF |
| Lab C | RA/Pr/Pn | OS/PM | RA/Pr/Pn/β-elim | OSa/PM | MALDI-TOF-MS (+ ion) | ABI Voyager DE Pro MALDI-TOF |
| Lab E | RA/Pr/Pn | OSa/PM | RA/Pr/Pn/β-elim | OSa/PM | MALDI-TOF-MS(MSn) (+ ion) | Bruker Reflex IV MALDI-TOF, Shimadzu AXIMA QIT MALDI-QIT-TOF |
| Lab F | Pn | OSa | Pn/β-elim | OSa | PGC-LC-ESI-MS(/MS) (− ion) | Bruker HCT 3D ion traps, Agilent MSD XCT Plus 3D ion traps |
| Lab H | RA/Pr/Pn | OS | Not participated | Not participated | NP-LC-ESI-MS (/MS) (+ ion) | AB SCIEX Triple TOF 5600 System |
| Lab I | RA/Pr/Pn | OSa | RA/Pr/Pn/β-elim | OSa | PGC-LC-ESI-MS(/MS) (− ion) | Thermo LTQ XL ion trap |
| Lab J | Pr/Pn | OS/PM | Pr/Pn/β-elim | OSa/PM | MALDI-TOF-MS (+ ion), ESI-MS(MSn) (+ ion) | AB SCIEX TOF/TOF 5800, Thermo LTQ Orbitrap |
| Lab K | Pn | OSa | Pn/β-elim | OSa | PGC-LC-ESI-MS(/MS) (− ion) | Bruker esquire HCT ion traps |
| Lab L | Pn | OSa | Pn/β-elim | OSa | PGC-LC-ESI-MS(/MS) (− ion) | Bruker AmaZon speed ETD ion trap |
AA 2-aminobenzoic acid, AE anion exchange, β-elim reductive β-elimination, PGC porous graphitic carbon column, FL fluorescence, Gp glycopeptide, OS oligosaccharides (reducing sugar), OSa oligosaccharide alditols, PA pyridylamination, PM permethylation, Pn peptide-N-glycosidase treatment, N-glycan removal, Pr proteolytic digestion, RA reduction and cysteine derivatization, RP reverse phase, Se serotonin chromatography, +/− ion positive/negative ion mode
Labs D and G did not participate
There are 6 steps in glycan analysis that need to be addressed and optimised: sample preparation, glycan release, glycan labelling and clean up (if used), separation technologies, quantitation and data interpretation. The following sections describe the different approaches taken by the 10 participating labs for each step.
Sample preparation
The preliminary study showed that different approaches to sample preparation resulted in different glycan analytics. Although the analytical strategies varied, it was clear that the major challenge, as in the proteomics field, lay in deciding on the best possible sample preparation method to recover all the proteins on the cell membranes and in the cytosol. In the follow up study, the sample preparation was carried out in a central lab (AIST) and aliquots of the membrane and cytosolic fractions were sent to each lab to test the effectiveness of this approach of separation of the cell membrane and cytosolic protein fractions for glycan analysis. Judging from the results, it seems that there was cross contamination of the membrane and cytosol in both fractions. This suggests the need to develop better separation technologies. One approach may be to release glycans directly from the whole cell, but this has been disappointing in that it is very hard to remove all the glycans without destroying the cell. Another approach that was explored here was to recover and analyse all the cellular glycopeptides together and then separate the data depending on the attached glycan structures.
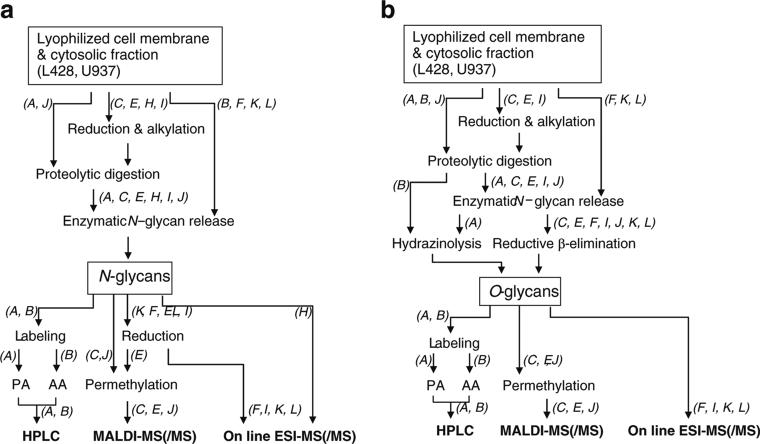
In Labs A, C, E, H, I, and J, glycoproteins were treated by protease-digestion into glycopeptides prior to glycan release, and in Labs B, F, K, L, glycans were released from glycoproteins directly without digestion (Table 2). The procedures from sample preparation to detection were almost the same in three labs (Lab F, K, L). In addition, most of the labs prepared glycan samples sequentially from the samples, with release of N-glycans first and then releasing O-glycans; except for lab B, which released N-glycans directly from glycoproteins and then the O-glycans from glycopeptides after protease treatment (Fig. 5a, b).
Fig. 5.
Flowcharts of various methodologies for the N-glycan profiling (a) and O-glycan profiling (b) of glycoproteins in lyophilized cell membrane and cytosolic fractions. Letters in italics represent laboratory codes
Glycan release
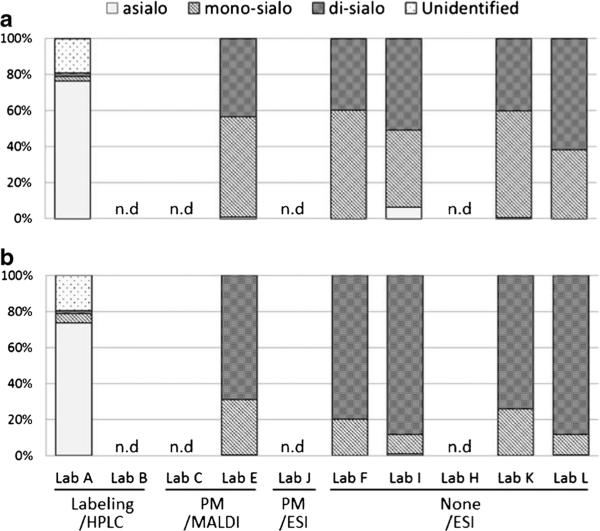
All labs released N-glycans using enzymatic treatments, but released O-glycans by chemical treatment as there are no appropriate endoenzymes for O-glycan release such as exist for N-glycans (peptide N-glycosidases) (Fig. 5a, b). In labs A and B, which employed HPLC analysis using luminescent labelling, O-glycans were released as reducing sugars by β-elimination prior to derivatization. In contrast, in labs C to L, glycans were released as alditols, by β-elimination under reducing conditions, for MS analysis which does not allow labelling. It is known however that O-glycans released as reducing sugars under alkaline conditions degrade as side reactions. As a possible consequence, Lab A, which used β-elimination alone, resulted in about 20 % of the detected products being unidentified, whereas other labs that released O-glycans as alditols did not see any unidentified glycan products (Fig. 6). Most labs released glycans in solution, but Labs F, K, and L released N- and O-glycans sequentially from lysates immobilized on a polyvinylidene fluoride (PVDF) membrane.
Fig. 6.
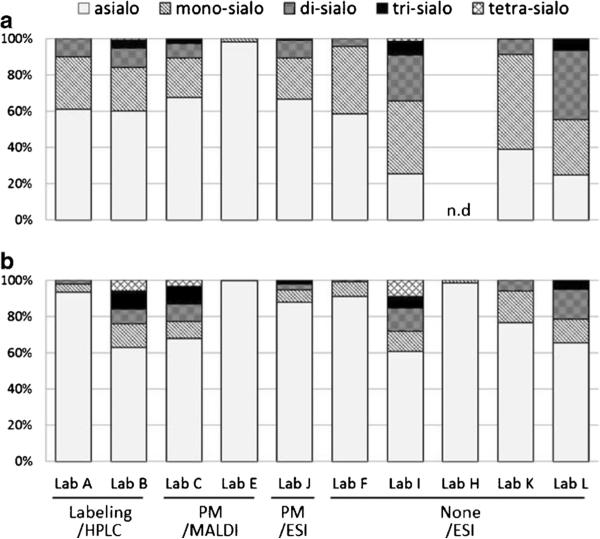
Relative quantities of N-glycans based on the number of sialic acids (asialo, mono-sialo, di-sialo, tri-sialo, tetra-sialo) from lyophilized cell membrane fraction (a: L428, b: U937) by each laboratory. Percentages of the identified glycan structures to the total glycans are presented
Glycan labelling and clean up
For derivatization of released glycans, Lab A and B (HPLC analysis) labelled N- and O-glycans with a luminescent labelling agent (2-aminopyridine [PA] or 2-aminobenzoic acid [2AA]). For the MS analysis (Lab C to L), mainly two derivatization methods were used. One method methylated the carboxyl and hydroxy groups of sialic acids and the resultant hydrophobic glycans were analysed in the positive ion mode to increase the ionization efficiency of released glycans. The other method directly analysed the released glycans as alditols by negative ion mode MS. Of the eight labs using MS, five (Labs E, F, I, K, L) enzymatically released N-glycans, and used one of these methods to carry out the analysis.
Separation technologies and quantitation
In the two labs that conducted HPLC analyses, Lab A fractionated the pyridylaminated glycans by the number of sialic acids using an anion-exchange column (DEAE column), and further separated the PA-glycans with a reverse phase column (C18 or C30 column). The compositions of the peaks in each fraction were detected by Matrix Assisted Laser Desorption/Ionization (MALDI)-MS and the detailed glycan structures were determined by HPLC mapping using GALAXY software [12, 13]. The HPLC peaks, in which multiple glycans were detected by MS, were further fractionated by an amide column and the structures determined by HPLC mapping. Relative amounts of each glycan were calculated based on the areas of the HPLC separated elution peaks. In Lab B, 2AA-labeled glycans were fractionated and characterized based on the number of sialic acids using a column of immobilized serotonin. For N-glycans, detailed structures were determined by MALDI-MS/MS after sialidase-treatment of each LC separated sialic acid fraction. The relative amount of each detailed structure was calculated based on the MS signal intensity.
In the eight labs employing MS analysis, some permethylated the hydrophilic groups of the released glycans and analyzed in the positive ion mode, and the others analyzed native glycans in the negative ion mode (except for Lab H). The systems were either MALDI-MS (Lab C, E, and J) or electrospray ionization (ESI)-MS (Lab F, H, I, K, and L). In the MALDI-MS, glycan mixtures were applied to MS (/MS) without separation, and the relative amounts of each structure were calculated based on the MS signal intensity. In this regard, MALDI-MS does not discriminate isomers having the same mass. On the other hand, since the ESI-MS analysis uses LC-MS(/MS), the glycan mixtures were separated on-line by LC either with a porous graphitic carbon (PGC) column (Lab F, I, K, and L) or amide column (Lab H) before MS analysis. The relative amounts of each structure were calculated based on the MS signal intensity or by integration of the extracted ion chromatogram (EIC) peaks for each mass. As the LC-MS(/MS) separates isomers at the LC level, it can distinguish differences in the relative amounts of structural isomers of the same mass to some extent. Detailed structures were determined by MS/MS or MSn.
Results
All laboratories had participated either or both the first [10] and second [11] pilot studies, in which purified glycoproteins were subjected for analysis. Each lab used their own protocols and established methods, and the validity of each method is ensured by the participants (Supplementary Method 3). To reduce the variability of the structures identified in the first analysis, many of which were attributable to the total cellular protein extraction process, cell membrane and cytosolic fractions were pre-prepared and sent to the participating labs, and the results were evaluated based on the analytical methods. As more results were submitted for the cell membrane fraction, we mainly discuss the analysis of the cell membrane fraction here.
In the HPLC analysis (Lab A and B), both labs used a similar process of separation and detection of glycans. In the N-glycan data, based on separation by number of sialic acids (Lab A and B in Fig. 6), L428 (Panel A) showed similar trends in both labs, but U937 (Panel B) did not. In the MS analysis, a variety of MS signals (almost 40) were detected, identified and similarly compared based on grouping the structures according to the number of sialic acids. However, even with the same pre-prepared samples, the results, as based on the numbers of sialic acids, were largely different among the labs. Although Lab F, K, and L used almost the same pretreatment, separation, and MS analysis methods, there was little similarity in the results (Fig. 6). This may be due to loss of relatively labile sialic acid residues in the work up of the samples or during the analysis.
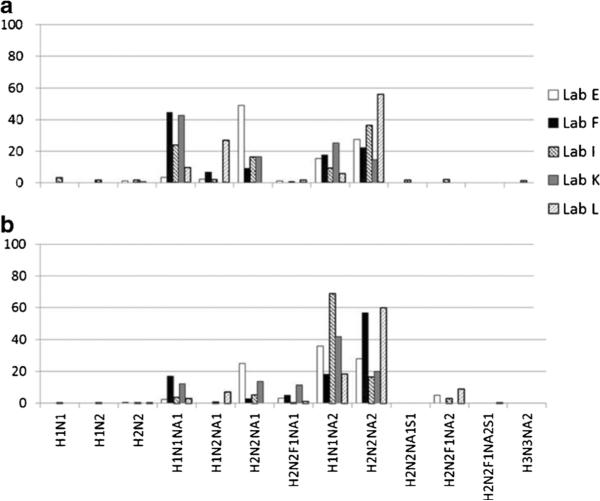
In the O-glycan analysis, the results were evaluated similarly based on grouping the structures according to the relative amount of sialic acids (Fig. 7). The relative amounts of glycans (released by β–elimination, labeled with fluorescent tags and analysed quantitatively by HPLC) are largely different from those of MS analysis: about 90 % of the detected forms were asialo glycans in the HPLC analysis, while MS detected almost no asialo glycans. Considering that a similar tendency was observed in the preliminary analysis using cell pellets, this difference may be partly because of the degradative side reactions of O-glycan release under non-reducing conditions. This is substantiated by the results of Lab A, that detected about 20 % of unidentified products that are presumed to be degradation products. In the MS analysis of O-glycan alditols, the relative amounts of each sialylated structure group were similar using both ionization methods (MALDI or ESI). This tendency was also observed in the preliminary analysis using cell pellets. As the results of O-glycan MS analysis were more similar than those of the N-glycans, further analysis was conducted on each glycan structure based on the relative MS signal intensities between Lab E, F, I, K, and L (Fig. 8). However, unlike Fig. 7 that shows similar sialylated grouping patterns, large variability was observed between different ionization methods of each structure. Although Lab F, K, and L used almost the same procedure for the O-glycan analysis, there was no significant reproducibility of structure abundance and the variations were large.
Fig. 7.
Relative quantities of O-glycans based on the number of sialic acids (asialo, mono-sialo, di-sialo) and the unidentified structures from lyophilized cell membrane fraction (a: L428, b: U937) by each laboratory. Percentages of all classes to the total glycans are presented
Fig. 8.
Comparison of O-glycan profiles obtained from lyophilized cell membrane fraction (a: L428, b: U937) by each laboratory used MS techniques. Percentages of the identified structures to the total glycans are indicated by the compositions as H Hex, N HexNAc, F deoxyHex, NA NeuAc, S sulphate
Thus, the analysis of the released N- and O-linked glycans by the different technologies showed significant variation. MS is a very high resolution technology and can report compositional data with a high degree of accuracy. It performs less well when used for quantitation because some oligosaccharides are better ionised than others. Mannose structures for example are usually overrepresented by MALDI MS and single MS is not able to provide monosaccharide sequence and linkage information; this requires fragmentation data. Where LC/MS is used, some linkage information can be deduced from the LC elution order [14–16].
In the positive ion mode of MALDI-MS and ESI-MS, the sialic acids of sialylated glycans tend to be lost if they are not modified. When sialic acids are lost upon ionization, the resultant MS signals are not distinguishable from the precursor asialo forms, causing lower estimation of the relative abundance of sialylated glycans. Therefore to prevent removal of sialic acids and to increase the ionization efficiency of glycans, esterification of the carboxyl group or methylation of carboxyl and hydroxy groups is often used as a pretreatment. In this study, the labs that used MALDI-MS conducted complete methylation of samples to prevent loss of sialic acids. Completely methylated glycans have different m/z from that of their precursor asialo forms even if they are desialylated upon ionization. In contrast, the negative ion mode of ESI is an efficient method that does not lose sialic acids. Thus for the comparison of glycan abundance based on MS signal intensities, both acidic and neutral glycans can be measured in the negative ion mode. Negative ion mode ionization results in sialylated glycans having better ionization efficiency than asialo glycans [17], and thus the glycans with a higher number of sialic acids are estimated at more than the amount actually present. The membrane glycoproteins would be expected to be heavily sialylated, therefore we expect that technologies that conserve sialic acids would more faithfully represent the glycosylation. In general, 2-3-linked sialic acids are increased in cancer compared with 2-6-linked sialic acids, [17, 18] perhaps as a result of disruption of the Golgi or changes in the glycosyltransferase levels. Cancer also reflects in increased levels of lactosamine structures which favour 2-3-linked sialic acids, as well as increases in tri- and tetra-antennary scaffolds which provide more antennae for sialylation.[19].
Discussion
In the preliminary analysis using cell pellets as the common samples, the results of the N-glycan profiles varied more than expected but were semi-quantified in the first study. This was probably because of the unspecified pre-processing sample preparation methodologies used by the different laboratories, including the glycoprotein enrichment methods. The subsequent analysis addressed this problem by providing cell lysate fractions prepared by the same preprocessing in the same laboratory. However, it only showed that a specified sample preparation method did not necessarily improve the reproducibility of the N-glycan profiles between different laboratories using different analytical workflows. Clearly, the diversity of the glycan structures in the sample, and the large variety of glycoproteins with heterogeneous glycan structures attached, affected the reproducibility of the data obtained. In fact, even the same pre-prepared membrane samples showed little similarity between the grouping of N-glycan structures as asialo, monosialo, and di-sialo glycans (Labs F, K, and L in Fig. 6). Some similarity was found if limited to a comparison of the major types of glycan classes. Therefore, if further analysis of complex samples such as cells is to be compared between laboratories, it will be necessary to not only specify detailed protocols for sample preparation but also for standardized analytical procedures and equipment, in order to enable inter-laboratory variability to be determined. When the fundamental technology (such as HPLC and MS) is different, it is apparent that it is not possible to obtain comparable data on complex samples. Optimization of sample preprocessing procedures appears not to be sufficient and it may be necessary to apply uniform computational processing of the experimentally obtained data. In that context, the minimum information required for a glycomics experiment (MIRAGE) initiative represents a first important step forward towards standardized reporting of experimental conditions [20, 21]; http://www.beilstein-institut.de/en/projects/mirage).
Glycan analysis remains challenging; different technologies provide different aspects of protein glycosylation. There have been attempts to select the best possible method to elucidate glycoforms.[22–24] This study implies that, for the foreseeable future, the choice of appropriate glycoanalytical protocols will continue to be determined by the question.[25] This inter-laboratory study demonstrates that a complete analysis of glycans by any single technology is not currently possible at the time, that sample preparation, separation, analysis and data interpretation need to be rigorously optimized, and that the “correct” result is still elusive. Although uniform criteria for method verification were not provided due to the principle objective of the study, which was comparison of a variety of well-established approaches for quantitative glycan analysis, we should discuss for the methods to maintain the data reliability and the definition of “true glycome” in planning of further studies.
In addition to the qualitative and quantitative comparative analyses of cell glycomes described above, we had set another goal (Task 2) toward establishment and standardization of glycoproteomics technologies aimed at glycobiomarker discovery, i.e., identification of glycoproteins carrying any carbohydrate antigen (e.g., Lewis x structures). The cell lines used in this study are known to express Lewis x, and Lewis-type fucosylation was found in the glycomes detected in this study. However, since selective capturing of glycopeptides containing Lewis-type terminal fucose is technically difficult, there was no laboratory that provided reliable data on Task 2 in this study. If selective capturing of the target glycopeptides with a specific structure, Lewis x in this case, becomes possible, the core peptide can be identified by existing LC/MS methods after releasing the glycans. Therefore, it is necessary to develop a method to capture them specifically. In parallel, it will be necessary to confirm that the identified peptides are actually carrying the antigen. To do this, glycopeptides have to be analyzed directly without separating the glycan from the peptide; however, although hyphenated MS methods are starting to be developed for this purpose, this analysis is still in its infancy and needs further developments.[26] Currently, the direct analysis of glycopeptides is becoming possible by tandem mass spectrometric analysis using high-energy collision-induced dissociation (HCD) or electron-transfer dissociation (ETD) MS. Unfortunately, these technologies are still cumbersome and hard to apply to a large-scale complex glycoprotein analysis. Therefore, we are proposing a new international collaboration study aimed at the development and popularization of such glycoproteomics technologies, including high-throughput and in-depth glycome analyses with new glycoinformatics data analysis tools, under the activity of the Biology/Disease-driven Human Proteome Project Initiative of HUPO.
Supplementary Material
Acknowledgments
Authors thank Drs. Yuzuru Ikehara and Ta-Wei Liu, and Ms. Azusa Tomioka of the National Institute of Advanced Industrial Science and Technology (AIST) for preparation and distribution of the samples. PA and MI acknowledge funding from the National Institutes of Health (NIH)-funded Research Resource for Biomedical Glycomics (P41GM10349010) to the Complex Carbohydrate Research Center. DK acknowledges funding from the European Union (Seventh Framework Program “Glycoproteomics”, grant number PCIG09-GA-2011-293847). NP, MT-A acknowledge funding from the Australian Research Council. NGK would like to acknowledge the financial contribution from Swedish Research Council (grant no 342-2004-4434 and no 621-2013-5895). All the authors would like to acknowledge the tremendous contribution that Azumi Takahashi of the AIST has made in assembling this paper and bringing it to fruition. This paper is dedicated to the memory of Prof. Kazuaki Kakehi of Kinki University who died on May 28, 2014 and we acknowledge his contribution to this project.
Abbreviations
- 2AA
2-aminobenzoic acid
- AAL
Aleuria aurantia lectin
- CDG
Congenital disorders of glycosylation
- ConA
Concanavalin A
- DEAE
Diethylaminoethyl
- EIC
Extracted ion chromatogram
- ESI
Electrospray ionization
- ETD
Electron-transfer dissociation
- HCD
High-energy collision-induced dissociation
- HGPI
Human Disease Glycomics/Proteome Initiative
- HPLC
High performance liquid chromatography
- HUPO
Human Proteome Organization
- Ig
Immunoglobulin
- LC
Liquid chromatography
- MALDI
Matrix-assisted laser desorption ionization
- MIRAGE
Minimum information required for a glycomics experiment
- MS
Mass spectrometry
- PVDF
Polyvinylidene fluoride
- PA
Pyridylaminated
- PGC
Porous graphitic carbon
Footnotes
Kazuaki Kakehi deceased in 2014
Hisashi Narimatsu served as the chair of the Human Disease Glycomics/Proteome Initiative, HUPO.
Electronic supplementary material The online version of this article (doi:10.1007/s10719-015-9625-3) contains supplementary material, which is available to authorized users.
References
- 1.Development, O. for E.C. and, Co-operation, O.E., Oecd, D. Policy issues for the development and use of biomarkers in health. 2011 [Google Scholar]
- 2.Kim YJ, Varki A. Perspectives on the significance of altered glycosylation of glycoproteins in cancer. Glycoconj. J. 1997;14:569–576. doi: 10.1023/a:1018580324971. [DOI] [PubMed] [Google Scholar]
- 3.Freire-de-Lima L. Sweet and sour: the impact of differential glycosylation in cancer cells undergoing epithelial-mesenchymal transition. Front. Oncol. 2014;4:59. doi: 10.3389/fonc.2014.00059. [DOI] [PMC free article] [PubMed] [Google Scholar]
- 4.Rivinoja A, Pujol FM, Hassinen A, Kellokumpu S. Golgi pH, its regulation and roles in human disease. Ann. Med. 2012;44:542–554. doi: 10.3109/07853890.2011.579150. [DOI] [PubMed] [Google Scholar]
- 5.Lauc G, Essafi A, Huffman JE, Hayward C, Knezevic A, Kattla JJ, Polasek O, Gornik O, Vitart V, Abrahams JL, Pucic M, Novokmet M, Redzic I, Campbell S, Wild SH, Borovecki F, Wang W, Kolcic I, Zgaga L, Gyllensten U, Wilson JF, Wright AF, Hastie ND, Campbell H, Rudd PM, Rudan I. Genomics meets glycomics-the first GWAS study of human N-Glycome identifies HNF1alpha as a master regulator of plasma protein fucosylation. PLoS Genet. 2010;6:e1001256. doi: 10.1371/journal.pgen.1001256. [DOI] [PMC free article] [PubMed] [Google Scholar]
- 6.Saldova R, Dempsey E, Perez-Garay M, Marino K, Watson JA, Blanco-Fernandez A, Struwe WB, Harvey DJ, Madden SF, Peracaula R, McCann A, Rudd PM. 5-AZA-2′-deoxycytidine induced demethylation influences N-glycosylation of secreted glycoproteins in ovarian cancer. Epigenetics. 2011;6:1362–1372. doi: 10.4161/epi.6.11.17977. [DOI] [PubMed] [Google Scholar]
- 7.Abbott KL, Nairn AV, Hall EM, Horton MB, McDonald JF, Moremen KW, Dinulescu DM, Pierce M. Focused glycomic analysis of the N-linked glycan biosynthetic pathway in ovarian cancer. Proteomics. 2008;8:3210–3220. doi: 10.1002/pmic.200800157. [DOI] [PMC free article] [PubMed] [Google Scholar]
- 8.Guo H, Nairn A, dela Rosa M, Nagy T, Zhao S, Moremen K, Pierce M. Transcriptional regulation of the protocadherin beta cluster during Her-2 protein-induced mammary tumorigenesis results from altered N-glycan branching. J. Biol. Chem. 2012;287:24941–24954. doi: 10.1074/jbc.M112.369355. [DOI] [PMC free article] [PubMed] [Google Scholar]
- 9.Zhao P, Nairn AV, Hester S, Moremen KW, O'Regan RM, Oprea G, Wells L, Pierce M, Abbott KL. Proteomic identification of glycosylphosphatidylinositol anchor-dependent membrane proteins elevated in breast carcinoma. J. Biol. Chem. 2012;287:25230–25240. doi: 10.1074/jbc.M112.339465. [DOI] [PMC free article] [PubMed] [Google Scholar]
- 10.Wada Y, Azadi P, Costello CE, Dell A, Dwek RA, Geyer H, Geyer R, Kakehi K, Karlsson NG, Kato K, Kawasaki N, Khoo K-H, Kim S, Kondo A, Lattova E, Mechref Y, Miyoshi E, Nakamura K, Narimatsu H, Novotny MV, Packer NH, Perreault H, Peter-Katalinić J, Pohlentz G, Reinhold VN, Rudd PM, Suzuki A, Taniguchi N. Comparison of the methods for profiling glycoprotein glycans— HUPO Human Disease Glycomics/Proteome Initiative multi-institutional study. Glycobiol. 2007;17:411–422. doi: 10.1093/glycob/cwl086. [DOI] [PubMed] [Google Scholar]
- 11.Wada Y, Dell A, Haslam SM, Tissot B, Canis K, Azadi P, Bäckström M, Costello CE, Hansson GC, Hiki Y, Ishihara M, Ito H, Kakehi K, Karlsson N, Hayes CE, Kato K, Kawasaki N, Khoo KH, Kobayashi K, Kolarich D, Kondo A, Lebrilla C, Nakano M, Narimatsu H, Novak J, Novotny MV, Ohno E, Packer NH, Palaima E, Renfrow MB, Tajiri M, Thomsson KA, Yagi H, Yu SY, Taniguchi N. Comparison of methods for profiling O-glycosylation: Human Proteome Organisation Human Disease Glycomics/Proteome Initiative multi-institutional study of IgA1. Mol. Cell. Proteomics. 2010;9:719–727. doi: 10.1074/mcp.M900450-MCP200. [DOI] [PMC free article] [PubMed] [Google Scholar]
- 12.Yagi H, Ohno E, Kondo S, Yoshida A, Kato K. Development and application of multidimensional HPLC mapping method for O-linked oligosaccharides. Biomolecules. 2011;1:48–62. doi: 10.3390/biom1010048. [DOI] [PMC free article] [PubMed] [Google Scholar]
- 13.Takahashi N, Kato K. GALAXY (Glycoanalysis by the Three Axes of MS and Chromatography): a web application that assists structural analyses of N-Glycans. Trends. Glycosci. Glycotechnol. 2003;15:235–251. [Google Scholar]
- 14.Pabst M, Bondili JS, Stadlmann J, Mach L, Altmann F. Mass + retention time = structure: a strategy for the analysis of N-glycans by carbon LC-ESI-MS and its application to fibrin N-glycans. Anal. Chem. 2007;79:5051–5057. doi: 10.1021/ac070363i. [DOI] [PubMed] [Google Scholar]
- 15.Jensen PH, Karlsson NG, Kolarich D, Packer NH. Structural analysis of N- and O-glycans released from glycoproteins. Nat. Protoc. 2012;7:1299–1310. doi: 10.1038/nprot.2012.063. [DOI] [PubMed] [Google Scholar]
- 16.Campbell MP, Nguyen-Khuong T, Hayes CA, Flowers SA, Alagesan K, Kolarich D, Packer NH, Karlsson NG. Validation of the curation pipeline of UniCarb-DB: building a global glycan reference MS/MS repository. Biochim. Biophys. Acta. 2014;1844:108–116. doi: 10.1016/j.bbapap.2013.04.018. [DOI] [PubMed] [Google Scholar]
- 17.Pabst M, Altmann F. Influence of electrosorption, solvent, temperature, and ion polarity on the performance of LC-ESI-MS using graphitic carbon for acidic oligosaccharides. Anal. Chem. 2008;80:7534–7542. doi: 10.1021/ac801024r. [DOI] [PubMed] [Google Scholar]
- 18.Kellokumpu S, Sormunen R, Kellokumpu I. Abnormal glycosylation and altered Golgi structure in colorectal cancer: dependence on intra-Golgi pH. FEBS Lett. 2002;516:217–224. doi: 10.1016/s0014-5793(02)02535-8. [DOI] [PubMed] [Google Scholar]
- 19.Saldova R, Asadi Shehni A, Haakensen VD, Steinfeld I, Hilliard M, Kifer I, Helland A, Yakhini Z, Børresen-Dale AL, Rudd PM. Association of N-glycosylation with breast carcinoma and systemic features using high-resolution quantitative UPLC. J. Proteome Res. 2014;13:2314–2327. doi: 10.1021/pr401092y. [DOI] [PubMed] [Google Scholar]
- 20.Kolarich D, Rapp E, Struwe WB, Haslam SM, Zaia J, McBride R, Agravat S, Campbell MP, Kato M, Ranzinger R, Kettner C, York WS. The minimum information required for a glycomics experiment (MIRAGE) project: improving the standards for reporting mass-spectrometry-based glycoanalytic data. Mol. Cell. Proteomics. 2013;12:991–995. doi: 10.1074/mcp.O112.026492. [DOI] [PMC free article] [PubMed] [Google Scholar]
- 21.York WS, Agravat S, Aoki-Kinoshita KF, McBride R, Campbell MP, Costello CE, Dell A, Feizi T, Haslam SM, Karlsson N, Khoo KH, Kolarich D, Liu Y, Novotny M, Packer NH, Paulson JC, Rapp E, Ranzinger R, Rudd PM, Smith DF, Struwe WB, Tiemeyer M, Wells L, Zaia J, Kettner C. MIRAGE: the minimum information required for a glycomics experiment. Glycobiology. 2014;24:402–406. doi: 10.1093/glycob/cwu018. [DOI] [PMC free article] [PubMed] [Google Scholar]
- 22.Huffman JE, Pucic-Bakovic M, Klaric L, Hennig R, Selman MHJ, Vuckovic F, Novokmet M, Kristic J, Borowiak M, Muth T, Polasek O, Razdorov G, Gornik O, Plomp R, Theodoratou E, Wright AF, Rudan I, Hayward C, Campbell H, Deelder AM, Reichl U, Aulchenko YS, Rapp E, Wuhrer M, Lauc G. Comparative performance of four methods for high-throughput glycosylation analysis of immunoglobulin G in genetic and epidemiological research. Mol. Cell. Proteomics. 2014;13:1598–1610. doi: 10.1074/mcp.M113.037465. [DOI] [PMC free article] [PubMed] [Google Scholar]
- 23.Reusch D, Haberger M, Falck D, Peter B, Maier B, Gassner J, Hook M, Wagner K, Bonnington L, Bulau P, Wuhrer M. Comparison of methods for the analysis of therapeutic immunoglobulin G Fc-glycosylation profiles-Part 2: mass spectrometric methods. MAbs. 2015;7:732–742. doi: 10.1080/19420862.2015.1045173. [DOI] [PMC free article] [PubMed] [Google Scholar]
- 24.Sinha S, Pipes G, Topp EM, Bondarenko PV, Treuheit MJ, Gadgil HS. Comparison of LC and LC/MS methods for quantifying N-glycosylation in recombinant IgGs. J. Am. Soc. Mass Spectrom. 2008;19:1643–1654. doi: 10.1016/j.jasms.2008.07.004. [DOI] [PubMed] [Google Scholar]
- 25.Mariño K, Bones J, Kattla JJ, Rudd PM. A systematic approach to protein glycosylation analysis: a path through the maze. Nat. Chem. Biol. 2010;6:713–723. doi: 10.1038/nchembio.437. [DOI] [PubMed] [Google Scholar]
- 26.Leymarie N, Griffin PJ, Jonscher K, Kolarich D, Orlando R, McComb M, Zaia J, Aguilan J, Alley WR, Altmann F, Ball LE, Basumallick L, Bazemore-Walker CR, Behnken H, Blank MA, Brown KJ, Bunz S-C, Cairo CW, Cipollo JF, Daneshfar R, Desaire H, Drake RR, Go EP, Goldman R, Gruber C, Halim A, Hathout Y, Hensbergen PJ, Horn DM, Hurum D, Jabs W, Larson G, Ly M, Mann BF, Marx K, Mechref Y, Meyer B, Moginger U, Neusubeta C, Nilsson J, Novotny MV, Nyalwidhe JO, Packer NH, Pompach P, Reiz B, Resemann A, Rohrer JS, Ruthenbeck A, Sanda M, Schulz JM, Schweiger-Hufnagel U, Sihlbom C, Song E, Staples GO, Suckau D, Tang H, Thaysen-Andersen M, Viner RI, An Y, Valmu L, Wada Y, Watson M, Windwarder M, Whittal R, Wuhrer M, Zhu Y, Zou C. Interlaboratory study on differential analysis of protein glycosylation by mass spectrometry: the ABRF glycoprotein research multi-institutional study 2012. Mol. Cell. Proteomics. 2013;12:2935–2951. doi: 10.1074/mcp.M113.030643. [DOI] [PMC free article] [PubMed] [Google Scholar]
Associated Data
This section collects any data citations, data availability statements, or supplementary materials included in this article.


