

Abstract
Cisplatin-induced acute kidney injury is a serious problem in cancer patients during treatment of solid tumors. Currently, there are no therapies available to treat or prevent cisplatin nephrotoxicity. Since histone deacetylase (HDAC) inhibition augments cisplatin anti-tumor activity, we tested whether HDAC inhibitors can prevent cisplatin-induced nephrotoxicity and determined the underlying mechanism. Cisplatin up-regulated the expression of several HDACs in the kidney. Inhibition of HDAC with clinically used trichostatin A suppressed cisplatin-induced kidney injury, inflammation and epithelial cell apoptosis. Moreover, trichostatin A upregulated the novel anti-inflammatory protein, activated microglia/macrophage WAP domain protein (AMWAP), in epithelial cells which was enhanced with cisplatin treatment. Interestingly, HDAC1 and -2 specific inhibitors are sufficient to potently up-regulate AMWAP in epithelial cells. Administration of recombinant AMWAP or its epithelial cell-specific overexpression reduced cisplatin-induced kidney dysfunction. Moreover, AMWAP treatment suppressed epithelial cell apoptosis, and siRNA-based knockdown of AMWAP expression abolished trichostatin A-mediated suppression of epithelial cell apoptosis in vitro. Thus, HDAC-mediated silencing of AMWAP may contribute to cisplatin nephrotoxicity. Hence, HDAC1 and -2 specific inhibitors or AMWAP could be useful therapeutic agents for the prevention of cisplatin nephrotoxicity.
Keywords: Cisplatin, AMWAP, Acute kidney injury, Inflammation, Histone deacetylases
Introduction
Acute kidney injury (AKI) is a serious problem in hospitalized patients [1-4]. Currently there are no therapies available to treat or prevent AKI in humans. A number of causes are identified for AKI in humans and include ischemia reperfusion, infection, drug toxicity and contrast media administration [5-9]. Acute kidney injury due to cisplatin chemotherapy occurs over 10% of patients who receive chemotherapy. A number of mechanisms have been identified using animal models of cisplatin nephrotoxicity; they include immune inflammatory cell-mediated injury, oxidative stress, DNA damage, apoptosis of tubular epithelial cells and disruption of transport activity in tubular epithelium [10-14]. Many of these mechanisms may happen at the same time, and all these pathways may be inter-related. Currently, the existing fluid therapy for cisplatin nephrotoxicity in humans does not completely prevent AKI from happening. Therefore, there is an urgent need to find a new therapy that is based on the mechanism of cisplatin nephrotoxicity.
Histone deacetylases (HDACs) are enzymes that remove acetyl groups from specific lysine residues on cellular and DNA binding proteins, such as histones, to regulate protein function, chromatin architecture and gene expression [15-17]. These enzymes are grouped into four distinct classes. Class I HDACs (HDAC 1, -2, -3, and -8) generally localize to the nucleus, and class II HDACs (HDAC 4, -5, -6, -7, -9, and -10) can shuttle between the nucleus and cytoplasm. HDAC11, which has similarities to the class I and II enzymes, is the sole member of the class IV group. The class III HDACs or sirtuins (SIRTs) 1–7 require the cofactor nicotinamide adenine dinucleotide for activity and act via a distinct mechanism to class I, II, and IV HDACs. HDAC inhibitors are now used to treat different types of cancer. However, recent studies suggest that HDAC inhibitors also have immunomodulatory activity [18;19] and anti-apoptotic effects in kidney cells in vitro [20]. Both inflammation and apoptosis are major mediators of cisplatin induced AKI in animal models. However, the role of HDACs in cisplatin nephrotoxicity in vivo is unknown. The aim of this study was to determine whether HDAC inhibitors can suppress cisplatin nephrotoxicity and if so, the underlying mechanisms would be determined. Our results show that administration of the HDAC inhibitor trichostatin A (TSA) suppressed inflammation and tubular epithelial cell apoptosis. The protective activity of the HDAC inhibitor was mediated through upregulation of a novel anti-inflammatory and anti-apoptotic protein called activated microglia/macrophage WAP domain protein (AMWAP) in tubular epithelial cells.
Results
Cisplatin differentially regulates HDAC expression in kidney and kidney epithelial cells
To determine which isoforms of HDAC are induced in response to cisplatin treatment, kidney tissue was harvested at 24hr and 72hr after cisplatin administration. Expression of HDACs was determined by RT-PCR. As shown in Figure 1, cisplatin induced a large increase in HDAC1expression, whereas a moderate increase was seen for the expression of HDAC2 and HDAC6. The other isoforms was not increased significantly. Similarly, expression of sirtuin 3 and -6 increased whereas sirtuin 4 and -5 expression was down-regulated and sirtuin 1, 2 and 7 expression was not altered significantly with cisplatin treatment.
Figure 1.

Cisplatin differentially regulates HDAC expression in the kidney. C57BL/6 mice were treated with saline or 30mg/kg body weight (BW). Kidneys were harvested at 24hr and 72hr after treatment, and RNA was isolated and used real time RT-PCR. A. Expression level of different isoforms of HDAC at 24hr after cisplatin administration. B. Expression level of different isoforms of HDAC at 72hr after cisplatin administration.*, p<0.05 vs. saline treated. n=5.
HDAC inhibitor trichostatin (TSA) administration suppressed cisplatin-induced kidney dysfunction
To determine whether the cisplatin-induced increase in HDAC expression mediated cisplatin induced nephrotoxicity, TSA or vehicle was administered with cisplatin. As shown in Figure 2A, cisplatin administration causes time-dependent kidney dysfunction as seen by increased serum creatinine over time. TSA administration significantly suppressed kidney dysfunction at both 48 and 72hr after cisplatin administration. Either saline administration or administration of TSA alone does not alter kidney function.
Figure 2.

Effects of HDAC inhibitor on cisplatin-induced nephrotoxicity. A. Serum creatinine levels at different time after various treatments. Serum creatinine was quantified as an indicator of kidney function as described in Materials and Methods. *, p<0.001 vs. saline-treated. #, p<0.01 vs cisplatin-treated. n=8-10. B-F. Kidney injury was assessed in a PAS stained tissue section. 72hr after various treatment, kidney tissue was processed for PAS staining and semiquantitative scoring of tubular injury as described in Materials and Methods. B. Semiquantitative scoring of tubular injury. *, p<0.001 vs. other groups. #, p<0.05 vs. Cisplatin-treated group. n=4-6. C. Saline-treated kidney tissue showing normal morphology. D. Cisplatin-treated kidney tissue showing extensive tubular necrosis and cast formation. E. Cisplatin+TSA treated kidney tissue showing less tubular necrosis. F. TSA treated kidney showing normal morphology.
Consistent with improved kidney function with TSA administration, a PAS-stained section shows less tubular necrosis, cast formation and preservation of a brush border in the cisplatin+TSA administered group as compared to the cisplatin+vehicle treated group (Figure 2C-F). This was further supported by quantification of the injury score (Figure 2B).
To determine whether administration of another HDAC1 specific inhibitor also protects the kidney against cisplatin-induced AKI, mice were treated with MS-275 with/without cisplatin. Administration of MS-275 significantly improved kidney function, which was associated with better preservation of kidney morphology (supplementary Figure 1), suggesting that both specific and broad spectrum inhibitors of HDAC are capable of suppressing cisplatin-induced kidney injury.
TSA administration suppressed cisplatin induced kidney inflammation
Since previous studies have shown that HDAC inhibitors suppressed the innate immune response [18;19], we examined whether TSA treatment has any influence on cisplatin-induced cytokine production. As shown in Figure 3, cisplatin administration significantly increased TNFα, IL-6 and MCP-1 levels both in plasma and urine, which was suppressed with TSA treatment. Consistent with the plasma and urine data, cytokine expression in the kidney was also increased as determined by RT-PCR (Figure 3).
Figure 3.

TSA suppressed cisplatin-induced increase in proinflammatory cytokine expression. 72hr after cisplatin administration, cytokine levels in plasma, urine and kidney were quantified by ELISA and RT-PCR. IL-6 (A), TNFα (B), MCP-1 (C) levels in plasma. MCP-1 (D) and IL-6 (E) levels in urine expressed as pg/mg of creatinine. F. Quantification of cytokines, adhesion molecule ICAM-1 and heme oxygenase-1 (HO-1) mRNA by real time RT-PCR. *, p<0.01 vs. other groups. #, p<0.05 vs. cisplatin-treated. n=4-6.
Consistent with the reduced cytokine and chemokine expression with TSA administration, neutrophil and monocyte infiltration into the kidney was also significantly suppressed as compared to cisplatin treatment (Figure 4).
Figure 4.
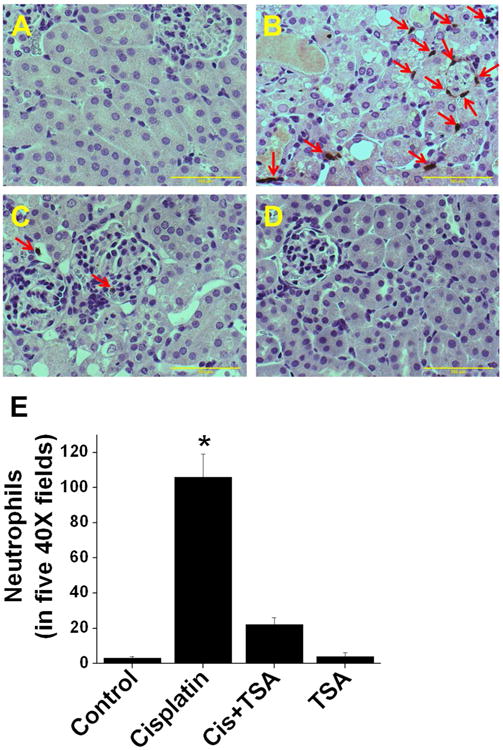
TSA suppressed cisplatin-induced leukucyte infiltration into the kidney. A-D. Immunohistochemical localization of monocyte and neutrophils infiltration at 72hr after different treatments. A. Saline-treated kidney. B. Cisplatin-treated kidney. C. Cisplatin+TSA-treated kidney. D. TSA-treated kidney. E. Quantification of infiltrated leukocytes in the kidney. *, p<0.001 vs. other groups. n=6.
HDAC inhibition suppressed cisplatin-induced tubular epithelial cell apoptosis
Epithelial cell apoptosis is a prominent feature of cisplatin-induced kidney injury. Recent in vitro studies had shown that HDAC inhibitor reduces epithelial cell apoptosis [20]. However, its in vivo relevance is unknown. As shown in Figure 5, cisplatin administration significantly increased tubular epithelial cell apoptosis in the kidney (indicated by yellow arrows) which was largely suppressed with TSA treatment. TSA alone did not alter epithelial cell apoptosis.
Figure 5.

TSA treatment reduced cisplatin-induced tubular epithelial cell apoptosis in the kidney. Apoptotic cells was quantified by TUNEL assay. A. Saline-treated kidney. B. Cisplatin-treated kidney. C.Cisplatin and TSA-treated kidney. D. TSA-treated kidney. E. Quantification of TUNEL positive cells in five 40× fields per animals. *, p<0.01 vs. other groups. #, p<0.01 vs. cisplatin-treated groups. Yellow arrows: tunel-positive apoptotic cells. n=4-6.
HDAC inhibitor up-regulated AMWAP expression in vivo and in vitro
During PCR-based screening for the influence of TSA on immune regulatory pathway genes in tubular epithelial cells, we identified a novel gene called activated microglia/macrophage WAP domain protein (AMWAP) that is highly induced with TSA treatment (Supplementary Figure S2). This gene was cloned recently in mice and is a counter-regulator of the proinflammatory response in macrophages [21]. In vitro data was confirmed by real time PCR analysis in the kidney (Figure 6A) and TKPTS cells (Figure 6B). Saline and cisplatin treatment did not increase AMWAP expression in the kidney or TKPTS cells (Figure 6A, B, C & D). Localization studies show that TSA treatment induced AMWAP expression in tubular epithelium (Figure. 6F) which was further increased with cisplatin treatment (Figure 6E). To determine which isoform of HDAC mediates AMWAP gene silencing, specific inhibitors for HDAC1 (MS-275), HDAC1&2 (romidepsin or FK-228) and HDAC6 (Tubastatin A) were used. Inhibition of HDAC1 induced a large increase (over 200 fold) in AMWAP expression in TKPTS cells (Figure 6G) but not in macrophages (Figure 6H). Inhibition of HDAC1&2 together induced a massive increase in AMWAP expression (over 1000 fold) in TKPTS cells but very little increase in macrophages. However, inhibition of HDAC6 increased AMWAP expression a few fold in TKPTS cells but none in macrophages (Figure 6G-H).
Figure 6.

HDAC inhibitor TSA up-regulates AMWAP expression in kidney epithelial cells in vivo and in vitro. A. RT-PCR analysis of AMWAP mRNA expression in the kidney at 72hr after different treatments. B. TKPTS cells were treated with saline, cisplatin with/without TSA or TSA alone for 24hr and AMWAP expression quantified by RT-PCR. C-F. Immunohistochemical localization of AMWAP expression in the kidney at 72hr after various treatments. C. Saline-treated kidney. D. Cisplatin treated kidney. E. Cisplatin+TSA-treated kidney. F. TSA treated kidney. G. Effect of HDAC isoform specific inhibitors on AMWAP expression in TKPTS cells. H. Effect of HDAC isoform specific inhibitors on AMWAP expression in RAW264.7 cells. I. AMWAP excretion in urine with cisplatin and/or TSA treatment. *, p<0.001 vs. other groups.
Consistent with AMWAP induction with HDAC inhibitors, excretion of AMWAP is increased dramatically in TSA-treated mouse as compared to saline (Figure 6I). HDAC inhibition was confirmed by Western blot analysis of acetylated protein in the kidney and TKPTS cells. HDAC inhibitor treatments increased histone acetylation as compared to saline-treated samples (Supplementary Figure S3 A&B). Interestingly, HDAC inhibition was also associated with an increase in AMWAP protein expression in TKPTS cells (Supplementary Figure S3-B).
Chromatin immunoprecipitation assay shows that TSA treatment increased acetylation of histones in the promoter region of the AMWAP gene. Recovery of the AMWAP promoter with TSA is significantly higher than that of either saline or cisplatintreated TKPTS cells (Supplementary Figure 3C).
AMWAP treatment suppressed tubular epithelial cell apoptosis in vitro
To determine whether TSA-mediated suppression of epithelial cell apoptosis is through induction of AMWAP, we treated TKPTS cells with recombinant AMWAP protein with/without cisplatin. As shown in Figure 7, cisplatin treatment increased epithelial cell apoptosis. As expected, treatment of epithelial cells significantly reduced cisplatin induced epithelial cell apoptosis. Interestingly, AMWAP treatment with cisplatin also reduced epithelial cell apoptosis similar to TSA treatment. To further confirm that AMWAP is the mediator of TSA-mediated suppression of cisplatin-induced apoptosis, AMWAP was knocked down with transfection of siRNA targeting AMWAP into TKPTS cells. TSA-mediated suppression of cisplatin-induced epithelial cell apoptosis was abolished with AMWAP knockdown (Supplementary Figure S4). Taken together, the TSA-mediated induction of AMWAP and AMWAP-mediated suppression of cisplatin-induced epithelial cell apoptosis suggests that TSA mediates its effect through AMWAP.
Figure 7.
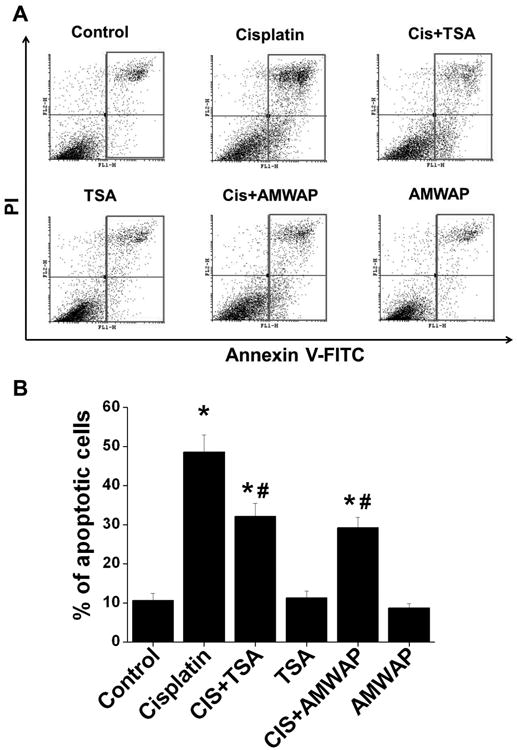
AMWAP and TSA suppressed cisplatin-induced tubular epithelial cell apoptosis in vitro. Tubular epithelial cell apoptosis was quantified by flow cytometry after staining cells with propidium iodide (PI) and annexin V-FITC. A. Histogram showing apoptotic cell gating at 24hr after various treatments. B. Quantification of annexin V-positive cells in each group expressed as percentage of total cells. *, p<0.01 vs. other groups. #, p<0.05 vs. cisplatin-treated group. n=5.
Administration of recombinant AMWAP suppressed cisplatin induced kidney dysfunction and inflammatory cell infiltration
To determine whether exogenous administration is effective in preventing cisplatin induced kidney injury, recombinant AMWAP was given to mice as described in Materials and Methods. As shown in Figure 8, cisplatin induced a significant increase in serum creatinine, a marker of kidney injury. However, AMWAP administration significantly reduced the cisplatin-induced increase in serum creatinine levels, suggesting a protective effect on kidney. Saline or AMWAP treatment alone did not alter kidney function. Functional improvement of kidney function with AMWAP treatment was associated with structural improvement, including reduced tubular necrosis, cast formation and preservation of the epithelial cell brush border (Figure 8F) as compared to cisplatin-treated kidney (Figure 8E). Consistent with the structural preservation, administration of AMWAP suppressed neutrophil infiltration (Figure 8J) as compared to cisplatin-treated kidney (Figure 8I). Saline or AMWAP treated animal kidney did not show any neutrophil infiltration (Figure 8H & K).
Figure 8.
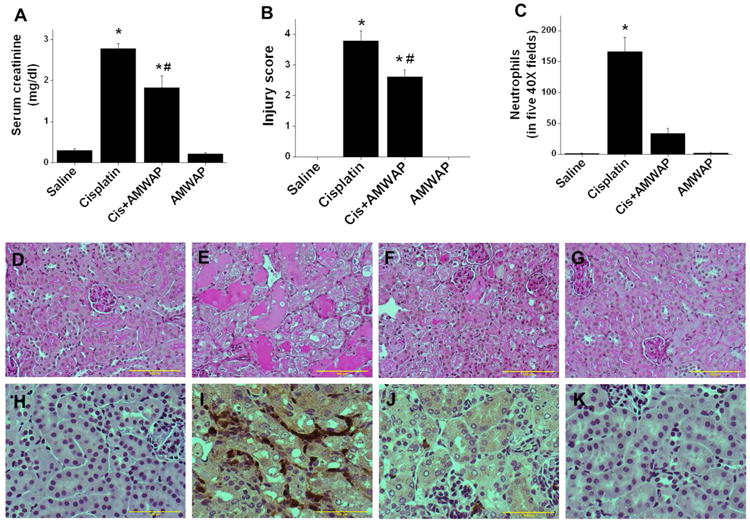
AMWAP administration suppressed cisplatin induced kidney injury. A. Serum creatinine at 72hr after different treatments. B. Tissue injury score quantified as described in Materials and Methods. C. Quantification of neutrophil infiltration. D-G: PAS stained kidney tissue section. H-K: Immunohistochemical staining for neutrophils. D&H. Saline treated. E&I: Cisplatin-treated. F&J. Cisplatin+AMWAP-treated. G&K. AMWAP treated. *, p<0.001 vs. other groups. #, p<0.05 vs. cisplatin-treated. n=6-8.
Epithelial cell specific overexpression of AMWAP ameliorates cisplatin-induced AKI in mice
As shown in Figure 6, AMWAP regulation by HDAC is specific for epithelial cells. To directly test whether gene silencing of AMWAP by HDAC is responsible for epithelial cell injury and increased inflammation, we created transgenic mice with AMWAP overexpression in renal epithelial cells (Supplementary Figure S5). As shown in the Figure 9, administration of cisplatin to wild-type miceinduced renal dysfunction (Figure 9A), increased tissue injury (Figure 9B & C-F) and inflammatory cytokine expression (Figure 9G), which was significantly suppressed in AMWAP transgenic mice. Improvement in kidney function and reduced cytokine expression was associated with significant reduction in the infiltration of neutrophils in AMWAP transgenic mouse kidney as compared to wild-type mouse kidney (Supplementary Figure S6).
Figure 9.

Epithelial cell-specific overexpression of AMWAP suppressed cisplatin-induced kidney injury. A. Serum creatinine at different times after cisplatin treatment. B. Tissue injury score quantified as described in Materials and Methods. C-F. PAS-stained kidney tissue section. C. Saline treated wild-type (WT). D. Saline treated AMWAP transgenic mouse kidney. E. Cisplatin treated WT kidney. F. Cisplatin-treated AMWAP transgenic mouse kidney. G. RT-PCR analysis of cytokine and chemokine expression in WT and AMWAP transgenic mouse kidneys. *, p<0.001 vs. other groups. #, p<0.05 vs. cisplatin-treated WT. n=6.
Discussion
HDACs are known to play an important role in cellular physiology and gene regulation [22]. HDAC inhibitors are commonly used for the treatment of several cancers [16] where they sensitize cancers to apoptosis. Cisplatin is an effective chemotherapeutic agent used to treat a wide variety of solid tumors. However, cisplatin also damages kidney, and there are no treatments available to prevent its nephrotoxicity. Cisplatin and HDAC inhibitors have been tested for several chemotherapy resistant cancers to enhance cisplatin effectiveness. HDAC inhibitors as such do not show any reported toxicity towards kidney in humans. The purpose of our study was to determine whether HDAC inhibitors can alleviate cisplatin nephrotoxicity and if they are effective, to determine the underlying mechanism. Our studies show for the first time that low dose of HDAC inhibitors is capable of suppressing inflammation and the tubular epithelial cell apoptosis associated with cisplatin administration. Interestingly, HDAC inhibitors induced expression of a novel protein called AMWAP in tubular epithelium. Administration of AMWAP protein effectively suppressed cisplatin nephrotoxicity in mice.
The only mechanism thought to be responsible for gene silencing is DNA methylation [23]. However, in recent years there has been a significant growth in our knowledge about the involvement of histone modifications in gene regulation that are known to play a role in normal cell physiology as well as pathology. In particular, acetylation of lysine residues of histone 3 and 4 is one of the best studied of this type of modification and is the result of a balance of the activities of histone acetyltransferase (HAT) and deacetylase (HDAC). The levels of histone acetylation play a crucial role in chromatin remodeling and in the regulation of gene transcription. The presence of acetylated lysine in histone tails is associated with a more relaxed chromatin state and activation of gene transcription, while the deacetylation of lysine residues is associated with a more condensed chromatin state and transcriptional gene silencing [15;22]. Interestingly, the AMWAP gene is silenced by deacetylase activity. Our chromatin immunoprecipitation (ChIP) assay supports this view that increased acetylation of histone in the AMWAP promoter region may enhance AMWAP transcription. Thus, it appears that inhibition of deacetylase activity promote AMWAP gene transcription.
Recent studies suggest that AMWAP expression is increased in response to inflammation, which is a NFkB and PU.1 dependent mechanism in macrophages [21]. However, AMWAP overexpression suppressed expression of several cytokine genes, including IL-1β, IL-6 and CCL2. Consistent with this data, our studies also demonstrate that AMWAP administration suppressed cisplatin-induced TNFα, IL-1β, MCP-1 and IL-6 in the kidney, plasma and urine. It is interesting to note that HDAC inhibitor treatment also suppressed the innate immune response by suppressing cytokine production in macrophages [18;19]. However, it was unknown whether HDAC inhibitor-mediated upregulation of AMWAP is responsible for it's anti-inflammatory properties. Our studies suggest that AMWAP could be a downstream mediator of HDAC inhibitor induced suppression of the innate immune response.
Recent studies in several animal models suggest that HDAC inhibitors can be protective against diabetic nephropathy [24], suppressed kidney fibrosis in unilateral ureteral ligation model [25], enhanced kidney recovery from AKI[26], and suppressed inflammation and kidney injury in the MRL-lpr/lpr mouse [27]. Consistent with these studies, we show that HDAC inhibitors also protect kidney against cisplatin nephrotoxicity. Similarly, in vitro studies had shown that TSA addition suppressed cisplatin-induced tubular epithelial cell apoptosis through suppression of p53 [20] and restoration of CREB-mediated transcription [28]. In contrast to these positive effects on the kidney, another in vitro study from the same group also described the pro-apoptotic action of the HDAC inhibitors suberoylanilide hydroxamic acid (SAHA) and TSA in kidney epithelial cell apoptosis [29]. Interestingly, our in vitro studies show suppression of cisplatin induced apoptosis, consistent with the two previous studies. In addition to TSA, treatment with the relatively HDAC1-specific inhibitor MS-275 also suppressed cisplatin-induced kidney injury, suggesting both a specific and broad spectrum HDAC inhibitor may be useful for treating cisplatin nephrotoxicity. It is interesting to note that MS-275 treatment in another model of AKI exacerbated AKI [30], suggesting that HDAC activity is protective in one form of injury but injurious in another form. Further studies need to be done to determine the specific mechanism for these differences. This effect of HDAC inhibitors is mediated through up-regulation of AMWAP expression in epithelial cells. Our studies also show that inhibition of deacetylase activity up-regulated its own expression in TKPTS cells (Supplementary Figure S7), suggesting the presence of a feedback loop. Consistent with the AMWAP infusion studies, epithelial cell-specific overexpression also suppressed renal injury and inflammation, suggesting that epithelial cell-derived AMWAP could be a key regulator of epithelial cell survival and inflammation in cisplatin-induced AKI.
In summary, for the first time, we show that HDACactivity suppressed AMWAP gene expression in epithelial cells and inhibition enhanced AMWAP expression. Both deacetylase inhibitor and AMWAP administration suppressed kidney injury in response to cisplatin treatment, suggesting these agents could be useful therapeutic drugs for treatment of cisplatin nephrotoxicity in humans. Further studies need to be done to determine the mechanism underlying AMWAP-mediated suppression of epithelial cell apoptosis.
Materials and Methods
Animals and drug administration
Experiments were performed using 8-10-week-old male C57BL/6 mice and epithelial cell-specific transgenic mice that overexpress AMWAP in kidney under control of the E-cadherin promoter [31]. AMWAP transgenic mice were in the FVB/N background and littermates that were negative for the AMWAP transgene were used as a control for transgenic animals. Mice were maintained on a standard diet and water was freely available. This study was approved by IACUC at Georgia Regents University. Cisplatin was dissolved in saline at a concentration of 1 mg/ml. Mice were given a single intraperitoneal injection of either saline or cisplatin (30mg/kg body weight). Some of these animals received trichostatin A (TSA) (1mg/kg BW) or AMWAP (10μg/animals) or MS-275 (1mg/kg BW) or vehicle every 24hr starting two days before cisplatin administration. Animals were sacrificed 72hr after cisplatin injection, and blood and kidney tissues were collected. Kidney tissues were processed for histology, TUNEL assay, neutrophil and RNA isolation.
Generation of AMWAP transgenic mice
Epithelial cell-specific overexpression of mouse AMWAP was accomplished using the partial E-cadherin promoter [31]. The E-cadherin promoter (-178 to +17) with mouse AMWAP cDNA was synthesized (Integrated DNA Technologies, Inc.) and then cloned upstream of a poly A signal in pcDNA3.1 plasmid using SpeI and XhoI restriction sites. Expression in epithelial cells was confirmed by transfecting into mouse proximal tubular epithelial cells (TKPTS). Plasmid DNA was cut with Bgl III and Dra III to release the construct, which was gel purified and used for microinjection. Microinjections were carried out by the Emory University Transgenic Core, and 2 founder lines in the FVB/N background were obtained.
Cell Culture
Immortalized mouse proximal tubule cells(TKPTS) [32], kindly provided by Dr. Bell-Reuss and Dr. J. Megyesi, were cultured in DMEM/F12 supplemented with glutamine, 7.5% FBS and antibiotics and were grown to confluence and maintained at 37° C in 5% CO2. Cells were treated with cisplatin with/without 1μg/ml of AMWAP or 0.1μM of TSA for 24 h and then harvested for RNA isolation or used to determine apoptosis. To determine the specific HDAC that regulates AMWAP expression, cells were treated with vehicle or specific inhibitor for HDAC-1 (MS-275, 1μM), HDAC-1&2 (romidepsin or FK228, 200nM) or HDAC-6 (Tubastatin A, 100nM) (SelleckChem, Houston TX, USA) for 24hrs. Cells were harvested and RNA used for AMWAP expression studies by real-time PCR. To determine the effect of AMWAP knockdown on TSA-induced suppression of cisplatin-mediated epithelial cell apoptosis, siRNA specific to AMWAP was transfected (50nM). 48hr after transfection, cells were treated with/without cisplatin and TSA for 24hr, and then cells were harvested to quantify apoptosis by flow cytometry.
Raw 264.7 cells were cultured in RPMI medium containing 10% FBS. At 80% confluency, cells were treated with cisplatin with/without 1μg/ml of AMWAP or 0.1μM of TSA for 24 h and 72hrs. Cells and supernatants were harvested and subjected to cytokine and gene expression analysis.
Quantification of Apoptosis By Flow Cytometry
To quantify the dead cells in culture, TKPTS cells were harvested at 24hrs after cisplatin treatment (25μM) with/without TSA or AMWAP as described above. Cells were then washed and stained for Annexin V-FITC and propidium iodide (Cat #640914, Biolegend, San Diego, CA). Stained cells were immediately analyzed by flow cytometry (BD FACSCalibur), and the data were analyzed using Cyflogic V.1.2.1 software.
To determine directly whether AMWAP induction with HDAC inhibitor suppresses cisplatin-induced apoptosis, TKPTS cells were transfected with 1nM of AMWAP siRNA (LifeTechnologies). 72hr after transfection, cells were treated with cisplatin (25μM) with/without TSA as described above for 24hr, and apoptotic cells were quantified by flow cytometry.
Renal Function
Renal function was assessed by measuring serum creatinine (cat no: DZ072B, Diazyme Labs, USA).
Quantitation of mRNA by real-time RT-PCR
Real-time RT-PCR was performed in an Applied Biosystems Inc. 7700 Sequence Detection System (Foster City, California, USA). 1.5 μg total RNA was reverse transcribed in a reaction volume of 20 μl using Omniscript RT kit and random primers. The product was diluted to a volume of 150 μl, and 6μl aliquots were used as templates for amplification using the SYBR Green PCR amplification reagent (Qiagen) and gene-specific primers. The primer sets used were: mouse TNFα (forward: GCATGATCCGCGACGTGGAA; reverse: AGATCCATGCCGTTG GCCAG), MCP-1 (forward: ATGCAGGTCCCTGTCATG; reverse: GCTTGAGGTGGTTGTGGA), ICAM-1 (forward: AGATCACATTCACGGTGCTG; reverse: CTTCAGAGGCAGGAAACAGG), hemeoxygenase-1 (HO-1) (forward: AGCATGCCCCAGGATTTG; reverse: AGCTCAATGTTGAGCAGGA), AMWAP (forward: ATGCCACCAACTACAGACAGGGGTG and reverse: CAGGATCCATCTCCTGAGCATTGA), IDO (forward: ACTGTGTCCTGGCAAACTGGAAG; reverse: AAGCTGCGATTTCCACCAATAGAG), IL-10 (forward: ATGCCTGGCTCAGCACTG; reverse: GTCCTGCATTAAGGAGTCG), β-catenin (forward: GGTGGACTGCAGAAAATGGT; reverse: TCAGCACTCTGCTTGTGGTC) and TGF-β1 (forward: TGACGTCACTGGAGTTGTACGG; reverse: GGTTCATGTCATGGATGGTGC). The amount of DNA was normalized to the β-actin signal amplified in a separate reaction (forward primer: AGAGGGAAATCGTGCGTGAC; reverse: CAATAGTGATGACCTGGCCGT).
Serum Cytokine Measurement
Serum cytokines and chemokines were measured using ELISA array kit from SA biosciences and ELISA kit from eBiosciences.
Tacs TdT in situ Apoptosis Detection
To identify apoptotic cells, tissue sections were stained using TACS TdT in situ Apoptosis Detection kit (R&D Systems, Inc.) according to the manufacturer's instructions. Briefly, tissue sections were deparaffinized, hydrated and washed with PBS. Sections were digested with proteinase K for 15 minutes at 24° C. Slides were then washed, and endogenous peroxidase activity was quenched with 3% H202 in methanol. Slides were washed and incubated with TdT labeling reaction mix at 37° C for 1 hour and then with streptavidin-HRP. Color was developed using TACS blue label substrate solution. Slides were washed, counterstained and mounted with Permount. Sections were photographed, and labeled cells were counted and quantified.
Chromatin Immunoprecipitation
Chromatin immunoprecipitation (ChIP) experiments on TKPTS cells was carried out using a kit (Cat # P-2002-2, Epigentek, Farmingdale, NY). Briefly, 10 million TKPTS cells were treated with 1% formaldehyde for 15 min, and the reaction was then stopped with glycine. Cell were lysed with lysis buffer with protease inhibitors. After brief centrifugation, DNA was sheared by sonication and then centrifuged again to remove cell debris. Immunoprecipitation was performed on the lysate with 4 μg of anti-acetyl histone (Cell Signaling Technologies, Danvers, MA) or anti-IgG Ab (Santa Cruz Biotechnology). After washing, cross-links were reversed with proteinase K addition. The immunoprecipitated DNA was purified using the DNA purification column from the kit and analyzed by PCR using the forward primer 5′-CCC CTC GAG CTG GAA AAA GGA ACC TGG TG-3′ and the reverse primer 5′-CCC AAG CTT TCA TCC CCA CAG TGA TCA AA-3′ specific for the AMWAP proximal promoter region -114/+68. Input DNA was normalizaed to amplification of GAPDH promoter primer (forward: ATCCTGTAGGCCAGGTGATG; reverse: AGGCTCAAGGGCTTTTAAGG).
Histology
Kidney tissue was fixed in buffered 10% formalin for 12 hours and then embedded in paraffin wax. For assessment of injury, 5 μM sections were stained with periodic acid-Schiff (PAS). Acute tubular necrosis was assessed in the outer strip of the outer medulla and cortex using a semiquantitative scale in which the percentage of tubules showing epithelial necrosis, brush-border loss and cast formation was assigned a score: 0 = normal, 1 = <10%, 2 = 11–25%,3 = 26–45%, 4 = 46–75%, and 5 = >76% [33;34]. Ten fields of 40× magnification were examined and averaged. The slides were scored in a blinded manner and de-identified. To quantify leukocyte infiltration, sections were stained with rat anti-mouse neutrophil antibody (Abcam) (1:200 dilution) followed by goat anti-rat biotin conjugate. Color was developed after incubation with ABC reagent (Vector Lab). Stained sections were photographed, and five 40× fields of neutrophils were examined for quantitation of leukocytes.
To localize the AMWAP expression in the kidney, sections were incubated with rabbit anti-AMWAP antibody (antibody was custom made from Sydlabs.com against peptide sequence PKEFEKPGACPKPSP from AMWAP protein), which was followed by a secondary antibody conjugated with Cy5 fluorescent tag.
Statistical Methods
All assays were performed in duplicate. The data are reported as mean ± SEM. Statistical significance was assessed by an unpaired, two tailed Student t-test for single comparison or ANOVA for multiple comparisons.
Supplementary Material
Figure S1. Effects on HDAC inhibitor MS-275 on cisplatin-induced nephrotoxicity. A. Serum creatinine levels at different times after various treatments. Serum creatinine was quantified as an indicator of kidney function as described in Materials and Methods. *, p<0.001 vs. other groups at corresponding times. n=8-10. B-E. n=4-6. B. Saline treated kidney showing normal morphology. C. Cisplatin-treated kidney showing extensive tubular necrosis and cast formation. D. Cisplatin+MS-275-treated kidney showing less tubular necrosis. E. MS-275-treated kidney showing normal morphology. F. Kidney injury was assessed in a PAS-stained tissue section. 72hr after various treatment kidney tissue was processed for PAS staining and semiquantitative scoring of tubular injury as described in Materials and Methods. F. Semiquantitative scoring of tubular injury. *, p<0.001 vs. other groups. #, p<0.001 vs. cisplatin-treated group.
Figure S2. Regulation of tolerogenic pathway genes by HDAC inhibitors in mouse proximal tubular epithelial cells. Cisplatin did not alter IDO, TGFβ1, IL-10, β-catenin and AMWAP expression. However, TSA treatment induced a large increase in AMWAP expression whereas the IDO and TGFβ1 expression increase is minimal. *, p<0.01 vs. saline. N=4-6.
Figure S3. Effect of HDAC inhibitors on protein acetylation. A. Western blot analysis of kidney extract from different treatments. Membrane was probed with antiacetyl antibody. Cisplatin significantly reduced the level of acetylated protein corresponding to histone H3/H4, which was normalized with TSA treatment. B. Western blot analysis of acetylated proteins (Histone H3/H4) in TKPTS cells treated with different HDAC inhibitors with/without cisplatin. HDAC inhibitors increased the acetylated histone levels as compared to saline or cisplatin. This was associated with increased expression of AMWAP in TKPTS cells. Protein loading was normalized to actin. C. Chromatin immunoprecipitation (ChIP) assay was performed as described in Materials and Methods. TSA-treated cells show significantly higher recovery as compared to control or cisplatin-treated groups. *, p<0.05 vs. control. #, p<0.05 vs. cisplatin-treated.
Figure S4. AMWAP knockdown abolished TSA-mediated suppression of cisplatin-induced tubular epithelial cell apoptosis in vitro. Tubular epithelial cell apoptosis was quantified by flow cytometry after staining cells with propidium iodide (PI) and annexin V-FITC. A. Histogram showing apoptotic cell gating at 24hr after various treatments. B. Quantification of annexin V-positive cells in each group expressed as percentage of total cells. *, p<0.01 vs. other groups. #, p<0.05 vs. cisplatin-treated group. n=5. C. Efficiency of AMWAP knockdown was determined by real time RT-PCR. *, P < 0.001 vs. scrambled siRNA transfected.
Figure S5. Characterization of AMWAP transgenic mice. A. Schematic representation of epithelial cell-specific AMWAP expression construct. B. PCR genotyping of AMWAP transgenic mice using primer designed for both the promoter and AMWAP gene. C. 2ND antibody control. D-F. Immunohistochemical localization of AMWAP expression in kidney epithelium of WT (D) and AMWAP transgenic mice (E&F). G. Western blot analysis of urine sample from WT and AMWAP transgenic mice for AMWAP excretion. H. Western blot analysis of AMWAP protein expression in transgenic mouse kidney.
Figure S6. Quantification of neutrophil infiltration in the kidney. A. WT saline-treated mouse kidney. B. WT cisplatin-treated mouse kidney showing increase in neutrophil infiltration (yellow arrows). C. AMWAP transgenic mouse saline-treated kidney. B. AMWAP transgenic mouse cisplatintreated kidney showing reduced neutrophil infiltration (yellow arrow). E. Neutrophil infiltration was quantified by counting stained cells in five 40× fields in each mouse. *, p<0.001 vs. other groups. n=4.
Figure S7. Regulation of HDAC isoforms expression with cisplatin and TSA treatment. Real time RT-PCR analysis of RNA isolated from TKPTS cells that are treated with saline, cisplatin, cisplatin with TSA or TSA alone for 24hr. *, p<0.05 vs. saline-treated. #, p<0.001 vs. cisplatin-treated. n=4-6.
Acknowledgments
GR is supported by an R01 grant from NIH-NIDDK (1R01DK083379 - 01A5). RM and PR are supported by postdoctoral fellowships from American Heart Association. RH is supported by a pre-doctoral fellowship from the Egyptian Government. The funding agencies had no role in the study design, data collection and analysis, decision to publish or preparation of the manuscript.
Footnotes
Statement of Competing Financial Interests: All authors declared no competing financial interest.
References
- 1.Himmelfarb J, Joannidis M, Molitoris B, Schietz M, Okusa MD, Warnock D, Laghi F, Goldstein SL, Prielipp R, Parikh CR, Pannu N, Lobo SM, Shah S, D'Intini V, Kellum JA. Evaluation and Initial Management of Acute Kidney Injury. Clin J Am Soc NephrolCJN. 2008 doi: 10.2215/CJN.04971107. [DOI] [PMC free article] [PubMed] [Google Scholar]
- 2.Kelly KJ, Molitoris BA. Acute renal failure in the new millennium: time to consider combination therapy. Semin Nephrol. 2000;20:4–19. [PubMed] [Google Scholar]
- 3.Mehta RL, Kellum JA, Shah SV, Molitoris BA, Ronco C, Warnock DG, Levin A. Acute Kidney Injury Network: report of an initiative to improve outcomes in acute kidney injury. Crit Care. 2007;11:R31. doi: 10.1186/cc5713. [DOI] [PMC free article] [PubMed] [Google Scholar]
- 4.Xue JL, Daniels F, Star RA, Kimmel PL, Eggers PW, Molitoris BA, Himmelfarb J, Collins AJ. Incidence and mortality of acute renal failure in Medicare beneficiaries, 1992 to 2001. J Am Soc Nephrol. 2006;17:1135–1142. doi: 10.1681/ASN.2005060668. [DOI] [PubMed] [Google Scholar]
- 5.Bellomo R, Ronco C, Kellum JA, Mehta RL, Palevsky P. Acute renal failure - definition, outcome measures, animal models, fluid therapy and information technology needs: the Second International Consensus Conference of the Acute Dialysis Quality Initiative (ADQI) Group. Crit Care. 2004;8:R204–R212. doi: 10.1186/cc2872. [DOI] [PMC free article] [PubMed] [Google Scholar]
- 6.Al Ghonaim M, Pannu N. Prevention and treatment of contrast-induced nephropathy. Tech Vasc Interv Radiol. 2006;9:42–49. doi: 10.1053/j.tvir.2006.12.002. [DOI] [PubMed] [Google Scholar]
- 7.Dear JW, Yasuda H, Hu X, Hieny S, Yuen PST, Hewitt SM, Sher A, Star RA. Sepsis-induced organ failure is mediated by different pathways in the kidney and liver: Acute renal failure is dependent on MyD88 but not renal cell apoptosis. Kidney Int. 2006;69:832–836. doi: 10.1038/sj.ki.5000165. [DOI] [PMC free article] [PubMed] [Google Scholar]
- 8.Tuttle KR, Worrall NK, Dahlstrom LR, Nandagopal R, Kausz AT, Davis CL. Predictors of ARF after cardiac surgical procedures. Am J Kidney Dis. 2003;41:76–83. doi: 10.1053/ajkd.2003.50025. [DOI] [PubMed] [Google Scholar]
- 9.Bonventre JV. Mechanisms of ischemic acute renal failure. Kidney Int. 1993;43:1160–1178. doi: 10.1038/ki.1993.163. [DOI] [PubMed] [Google Scholar]
- 10.Arany I, Safirstein RL. Cisplatin nephrotoxicity. Seminars in Nephrology. 2003;23:460–464. doi: 10.1016/s0270-9295(03)00089-5. [DOI] [PubMed] [Google Scholar]
- 11.Ramesh G, Reeves WB. TNF-alpha mediates chemokine and cytokine expression and renal injury in cisplatin nephrotoxicity. J Clin Invest. 2002;110:835–842. doi: 10.1172/JCI15606. [DOI] [PMC free article] [PubMed] [Google Scholar]
- 12.Townsend DM, Deng M, Zhang L, Lapus MG, Hanigan MH. Metabolism of Cisplatin to a nephrotoxin in proximal tubule cells. J Am Soc Nephrol. 2003;14:1–10. doi: 10.1097/01.asn.0000042803.28024.92. [DOI] [PMC free article] [PubMed] [Google Scholar]
- 13.Miller RP, Tadagavadi RK, Ramesh G, Reeves WB. Mechanisms of Cisplatin nephrotoxicity. Toxins(Basel) 2010;2:2490–2518. doi: 10.3390/toxins2112490. [DOI] [PMC free article] [PubMed] [Google Scholar]
- 14.Jo SK, Cho WY, Sung SA, Kim HK, Won NH. MEK inhibitor, U0126, attenuates cisplatin-induced renal injury by decreasing inflammation and apoptosis. Kidney Int. 2005;67:458–466. doi: 10.1111/j.1523-1755.2005.67102.x. [DOI] [PubMed] [Google Scholar]
- 15.Ropero S, Esteller M. The role of histone deacetylases (HDACs) in human cancer. Molecular Oncology. 2007;1:19–25. doi: 10.1016/j.molonc.2007.01.001. [DOI] [PMC free article] [PubMed] [Google Scholar]
- 16.Johnstone RW. Histone-deacetylase inhibitors: novel drugs for the treatment of cancer. Nat Rev Drug Discov. 2002;1:287–299. doi: 10.1038/nrd772. [DOI] [PubMed] [Google Scholar]
- 17.Chen S, Bellew C, Yao X, Stefkova J, Dipp S, Saifudeen Z, Bachvarov D, El Dahr SS. Histone Deacetylase (HDAC) Activity Is Critical for Embryonic Kidney Gene Expression, Growth, and Differentiation. Journal of Biological Chemistry. 2011;286:32775–32789. doi: 10.1074/jbc.M111.248278. [DOI] [PMC free article] [PubMed] [Google Scholar]
- 18.Halili MA, Andrews MR, Labzin LI, Schroder K, Matthias G, Cao C, Lovelace E, Reid RC, Le GT, Hume DA, Irvine KM, Matthias P, Fairlie DP, Sweet MJ. Differential effects of selective HDAC inhibitors on macrophage inflammatory responses to the Toll-like receptor 4 agonist LPS. J Leukoc Biol. 2010;87:1103–1114. doi: 10.1189/jlb.0509363. [DOI] [PubMed] [Google Scholar]
- 19.Roger T, Lugrin J, Le Roy D, Goy G, Mombelli M, Koessler T, Ding XC, Chanson AL, Reymond MK, Miconnet I, Schrenzel J, Francois P, Calandra T. Histone deacetylase inhibitors impair innate immune responses to Toll-like receptor agonists and to infection. Blood. 2011;117:1205–1217. doi: 10.1182/blood-2010-05-284711. [DOI] [PubMed] [Google Scholar]
- 20.Dong G, Luo J, Kumar V, Dong Z. Inhibitors of histone deacetylases suppress cisplatin-induced p53 activation and apoptosis in renal tubular cells. Am J Physiol Renal Physiol. 2010;298:F293–F300. doi: 10.1152/ajprenal.00410.2009. [DOI] [PMC free article] [PubMed] [Google Scholar]
- 21.Karlstetter M, Walczak Y, Weigelt K, Ebert S, Van den Brulle J, Schwer H, Fuchshofer R, Langmann T. The Novel Activated Microglia/Macrophage WAP Domain Protein, AMWAP, Acts as a Counter-Regulator of Proinflammatory Response. J Immunol. 2010;185:3379–3390. doi: 10.4049/jimmunol.0903300. [DOI] [PubMed] [Google Scholar]
- 22.Iizuka M, Smith MM. Functional consequences of histone modifications. Curr Opin Genet Dev. 2003;13:154–160. doi: 10.1016/s0959-437x(03)00020-0. [DOI] [PubMed] [Google Scholar]
- 23.Esteller M. CpG island hypermethylation and tumor suppressor genes: a booming present, a brighter future. Oncogene. 2002;21:5427–5440. doi: 10.1038/sj.onc.1205600. [DOI] [PubMed] [Google Scholar]
- 24.Christensen DP, Dahllof M, Lundh M, Rasmussen DN, Nielsen MD, Billestrup N, Grunnet LG, Mandrup-Poulsen T. Histone deacetylase (HDAC) inhibition as a novel treatment for diabetes mellitus. Mol Med. 2011;17:378–390. doi: 10.2119/molmed.2011.00021. [DOI] [PMC free article] [PubMed] [Google Scholar]
- 25.Liu N, He S, Ma L, Ponnusamy M, Tang J, Tolbert E, Bayliss G, Zhao TC, Yan H, Zhuang S. Blocking the Class I Histone Deacetylase Ameliorates Renal Fibrosis and Inhibits Renal Fibroblast Activation via Modulating TGF-Beta and EGFR Signaling. PLoS ONE. 2013;8:e54001. doi: 10.1371/journal.pone.0054001. [DOI] [PMC free article] [PubMed] [Google Scholar]
- 26.Cianciolo Cosentino C, Skrypnyk NI, Brilli LL, Chiba T, Novitskaya T, Woods C, West J, Korotchenko VN, McDermott L, Day BW, Davidson AJ, Harris RC, de Caestecker MP, Hukriede NA. Histone Deacetylase Inhibitor Enhances Recovery after AKI. J Am Soc Nephrol. 2013;24:943–953. doi: 10.1681/ASN.2012111055. [DOI] [PMC free article] [PubMed] [Google Scholar]
- 27.Mishra N, Reilly CM, Brown DR, Ruiz P, Gilkeson GS. Histone deacetylase inhibitors modulate renal disease in the MRL-lpr/lpr mouse. J Clin Invest. 2003;111:539–552. doi: 10.1172/JCI16153. [DOI] [PMC free article] [PubMed] [Google Scholar]
- 28.Arany I, Herbert J, Herbert Z, Safirstein RL. Restoration of CREB function ameliorates cisplatin cytotoxicity in renal tubular cells. American Journal of Physiology - Renal Physiology. 2008;294:F577–F581. doi: 10.1152/ajprenal.00487.2007. [DOI] [PubMed] [Google Scholar]
- 29.Dong G, Wang L, Wang CY, Yang T, Kumar MV, Dong Z. Induction of Apoptosis in Renal Tubular Cells by Histone Deacetylase Inhibitors, a Family of Anticancer Agents. J Pharmacol Exp Ther. 2008;325:978–984. doi: 10.1124/jpet.108.137398. [DOI] [PubMed] [Google Scholar]
- 30.Tang J, Yan Y, Zhao TC, Gong R, Bayliss G, Yan H, Zhuang S. Class I HDAC activity is required for renal protection and regeneration after acute kidney injury. American Journal of Physiology - Renal Physiology. 2014;307:F303–F316. doi: 10.1152/ajprenal.00102.2014. [DOI] [PMC free article] [PubMed] [Google Scholar]
- 31.Behrens J, L+¦wrick O, Klein-Hitpass L, Birchmeier W. The E-cadherin promoter: functional analysis of a G.C-rich region and an epithelial cell-specific palindromic regulatory element. PNAS. 1991;88:11495–11499. doi: 10.1073/pnas.88.24.11495. [DOI] [PMC free article] [PubMed] [Google Scholar]
- 32.Ernest S, Bello-Reuss E. Expression and function of P-glycoprotein in a mouse kidney cell line. American Journal of Physiology - Cell Physiology. 1995;269:C323–C333. doi: 10.1152/ajpcell.1995.269.2.C323. [DOI] [PubMed] [Google Scholar]
- 33.Wang W, Li C, Summer SN, Falk S, Wang W, Ljubanovic D, Schrier RW. Role of AQP1 in endotoxemia-induced acute kidney injury. Am J Physiol Renal Physiol. 2008;294:F1473–F1480. doi: 10.1152/ajprenal.00036.2008. [DOI] [PubMed] [Google Scholar]
- 34.Ramesh G, Zhang B, Uematsu S, Akira S, Reeves WB. Endotoxin and cisplatin synergistically induce renal dysfunction and cytokine production in mice. Am J Physiol Renal Physiol. 2007;293:F325–F332. doi: 10.1152/ajprenal.00158.2007. [DOI] [PubMed] [Google Scholar]
Associated Data
This section collects any data citations, data availability statements, or supplementary materials included in this article.
Supplementary Materials
Figure S1. Effects on HDAC inhibitor MS-275 on cisplatin-induced nephrotoxicity. A. Serum creatinine levels at different times after various treatments. Serum creatinine was quantified as an indicator of kidney function as described in Materials and Methods. *, p<0.001 vs. other groups at corresponding times. n=8-10. B-E. n=4-6. B. Saline treated kidney showing normal morphology. C. Cisplatin-treated kidney showing extensive tubular necrosis and cast formation. D. Cisplatin+MS-275-treated kidney showing less tubular necrosis. E. MS-275-treated kidney showing normal morphology. F. Kidney injury was assessed in a PAS-stained tissue section. 72hr after various treatment kidney tissue was processed for PAS staining and semiquantitative scoring of tubular injury as described in Materials and Methods. F. Semiquantitative scoring of tubular injury. *, p<0.001 vs. other groups. #, p<0.001 vs. cisplatin-treated group.
Figure S2. Regulation of tolerogenic pathway genes by HDAC inhibitors in mouse proximal tubular epithelial cells. Cisplatin did not alter IDO, TGFβ1, IL-10, β-catenin and AMWAP expression. However, TSA treatment induced a large increase in AMWAP expression whereas the IDO and TGFβ1 expression increase is minimal. *, p<0.01 vs. saline. N=4-6.
Figure S3. Effect of HDAC inhibitors on protein acetylation. A. Western blot analysis of kidney extract from different treatments. Membrane was probed with antiacetyl antibody. Cisplatin significantly reduced the level of acetylated protein corresponding to histone H3/H4, which was normalized with TSA treatment. B. Western blot analysis of acetylated proteins (Histone H3/H4) in TKPTS cells treated with different HDAC inhibitors with/without cisplatin. HDAC inhibitors increased the acetylated histone levels as compared to saline or cisplatin. This was associated with increased expression of AMWAP in TKPTS cells. Protein loading was normalized to actin. C. Chromatin immunoprecipitation (ChIP) assay was performed as described in Materials and Methods. TSA-treated cells show significantly higher recovery as compared to control or cisplatin-treated groups. *, p<0.05 vs. control. #, p<0.05 vs. cisplatin-treated.
Figure S4. AMWAP knockdown abolished TSA-mediated suppression of cisplatin-induced tubular epithelial cell apoptosis in vitro. Tubular epithelial cell apoptosis was quantified by flow cytometry after staining cells with propidium iodide (PI) and annexin V-FITC. A. Histogram showing apoptotic cell gating at 24hr after various treatments. B. Quantification of annexin V-positive cells in each group expressed as percentage of total cells. *, p<0.01 vs. other groups. #, p<0.05 vs. cisplatin-treated group. n=5. C. Efficiency of AMWAP knockdown was determined by real time RT-PCR. *, P < 0.001 vs. scrambled siRNA transfected.
Figure S5. Characterization of AMWAP transgenic mice. A. Schematic representation of epithelial cell-specific AMWAP expression construct. B. PCR genotyping of AMWAP transgenic mice using primer designed for both the promoter and AMWAP gene. C. 2ND antibody control. D-F. Immunohistochemical localization of AMWAP expression in kidney epithelium of WT (D) and AMWAP transgenic mice (E&F). G. Western blot analysis of urine sample from WT and AMWAP transgenic mice for AMWAP excretion. H. Western blot analysis of AMWAP protein expression in transgenic mouse kidney.
Figure S6. Quantification of neutrophil infiltration in the kidney. A. WT saline-treated mouse kidney. B. WT cisplatin-treated mouse kidney showing increase in neutrophil infiltration (yellow arrows). C. AMWAP transgenic mouse saline-treated kidney. B. AMWAP transgenic mouse cisplatintreated kidney showing reduced neutrophil infiltration (yellow arrow). E. Neutrophil infiltration was quantified by counting stained cells in five 40× fields in each mouse. *, p<0.001 vs. other groups. n=4.
Figure S7. Regulation of HDAC isoforms expression with cisplatin and TSA treatment. Real time RT-PCR analysis of RNA isolated from TKPTS cells that are treated with saline, cisplatin, cisplatin with TSA or TSA alone for 24hr. *, p<0.05 vs. saline-treated. #, p<0.001 vs. cisplatin-treated. n=4-6.