Abstract
Introduction
Pregnancy Associated Plasma Protein A2 (PAPP-A2) is a pregnancy related insulin-like growth factor binding protein-5 (IGFBP-5) protease, known to be elevated in preeclampsia. As the insulin-like growth factors are important in human implantation and placentation, we sought to determine the expression pattern of PAPP-A2 over human gestation in normal and preeclamptic pregnancies to evaluate its role in placental development and the pathogenesis of preeclampsia.
Methods
Placental basal plate and chorionic villi samples, maternal and fetal cord blood sera were obtained from preeclamptic and control pregnancies. Formalin-fixed tissue sections from across gestation were stained for cytokeratin-7, HLA-G, and PAPP-A2. PAPP-A2 immunoblot analysis was also performed on protein lysates and sera.
Results
PAPP-A2 expression is predominately expressed by differentiated trophoblasts and fetal endothelium. Chorionic villi show strong expression in the first trimester, followed by a progressive decrease in the second trimester, which returns in the third trimester. PAPP-A2 expression is not impacted by labor. PAPP-A2 is increased in the basal plate, chorionic villi and maternal sera in preeclampsia compared to controls, but is not detectable in cord blood.
Discussion
PAPP-A2 is differentially expressed in different trophoblast populations and shows strong down regulation in the mid second trimester in chorionic villous samples. Both maternal sera and placental tissue from pregnancies complicated by preeclampsia show increased levels of PAPP-A2. PAPP-A2 levels are not altered by labor. Additionally, PAPP-A2 cannot be detected in cord blood demonstrating that the alterations in maternal and placental PAPP-A2 are not recapitulated in the fetal circulation.
Keywords: PAPP-A2, preeclampsia, placenta
INTRODUCTION
Preeclampsia, a common disorder of human gestation, complicates 3-8% of pregnancies, contributes to 15% of preterm births, and is associated with 10-15% of maternal deaths [1, 2]. Currently, the pathogenesis is believed to occur as a result of poor placentation, followed later in pregnancy by a maternal systemic response to placental factors [3]. In the early stages, the poor placentation is characterized by impaired extravillous trophoblast invasion into the maternal decidua and impaired remodeling of the uterine spiral arteries [4].
Extravillous trophoblast invasion is stimulated by insulin growth factors (IGFs) whose bioavailability is regulated by insulin-like binding proteins (IGFBPs) [5-8]. Pregnancy-associated plasma protein-A2 (PAPP-A2), is an insulin-like growth factor-binding protein protease, whose natural substrate is IGFBP-5, and to a lesser extent, IGFBP-3 [9]. PAPP-A2 expression is most abundant in the placenta [10-12]. PAPP-A2, by cleaving IGFBPs, has the potential to regulate IGF growth –promoting activities[13, 14], specifically fetoplacental growth [15], and placental development through impact on trophoblast differentiation.
Placental PAPP-A2 is significantly increased in preeclampsia [16-19]. RNA and protein studies confirm increased levels of PAPP-A2 in both placenta and maternal serum of preeclamptic subjects compared with controls [11, 20, 21], as well as up-regulated in HELLP syndrome [22], and fetal growth restriction [19]. Recently, first trimester PAPP-A2 levels were reported to be elevated in pregnancies that subsequently developed preeclampsia [5]. However, less is known about PAPP-A2 expression over gestation in normal pregnancy and in response to labor, particularly within the different regions of the placenta, specifically the basal plate (area of trophoblast invasion) and chorionic villi (area of exchange between maternal and fetal compartments). The potential impact of elevated PAPP-A2 levels in preeclampsia on the fetus has also not been explored.
Therefore, in this study we sought to further characterize the developmental expression pattern of placental PAPP-A2 over human gestation, determine the impact of labor on PAPP-A2 expression, and to further assess serum levels of PAPP-A2, both in the maternal and fetal circulation.
MATERIALS AND METHODS
Tissue and Serum Collection
Under IRB approved protocols, placental biopsies were collected for developmental analysis from singleton pregnancies between 5-39 weeks gestation. Samples from previable gestational ages were obtained from elective terminations. Pregnancies complicated by multiple gestations, fetal anomalies, premature rupture of membranes, infection, diabetes, or other autoimmune diseases were excluded. Pregnancies complicated by preeclampsia were compared to normotensive controls of similar gestational age. Pregnancies complicated only by preterm labor without signs of infection served as the preterm controls. Preeclampsia was defined using the NIH Working Group on High Blood Pressure in Pregnancy 2009. Gestational age was determined by foot length [23], or standard dating criteria by last menstrual period and ultrasound [24]. All placental samples were processed within one-hour following delivery. After extensive rinsing with cold phosphate buffered saline (PBS), the basal plate was dissected and processed separately from the underlying chorionic villi and snap frozen as previously described [25]. For localization studies, 1×1cm3 placental biopsies were taken from central cotyledon, placed in 10% formalin for 24 to 48 hours and embedded in paraffin. A total of 14 first trimester, 23 second trimester and 24 third trimester were used for these studies, the number of placentas used for each analysis are listed in the figure legends. Maternal and cord blood serum was collected using standard venipuncture into red top tubes. After clotting at room temperature, blood was centrifuged at 2000g for 10 minutes at 4°C. The ser um was aliquoted and stored at −80°C. Sample sizes are provided in figure legends.
Immunohistochemistry
Formalin-fixed serial tissue sections from across gestation were stained for cytokeratin-7 to identify all trophoblasts, HLA-G to identify invasive CTBs, and PAPP-A2 using previously published methods [17]. Briefly, serial sections (5μm) were deparaffinized using xylene and dehydrated using isopropanol. Quenching of endogenous peroxidase activity was done with 20% H2O2. Antigen retrieval was performed using Antigen Unmasking Solution, (Vector Labs) for 20 minutes at 95-100°C. Blocking was performed using the Vectastain Elite ABC reagents kit (Vector Laboratories). Primary antibodies were diluted in blocking serum of originating species and incubated overnight at 4°C. The following antibodies were used: anti-Cytokeratin-7 (1:100 clone OVTL12/30 Dako), anti-HLA-G (1:50; 4H84 kindly provided by Mike McMaster [26]) and anti-PappA2 (1:30,000; kindly provided by Claus Oxvig and described in [17]). Control sections were incubated without primary antibody.
Biotinylated secondary antibodies were incubated for 1 hour at room temperature (RT). Following washes, visualization was by incubation with diaminobenzadien (DAB kit, Vector Laboratories). Sections were counterstained with Hematoxylin QS (Vector laboratories). Sections were photographed on a Nikon eclipse 80i microscope with a Q-imaging Retiga 2000R digital camera.
PAPP-A2 immunoreactivity by cell type, as assessed by morphology and trophoblast staining, was scored as follows: (−) no immunoreactivity, (+) light, (++) moderate, and (+++) strong. The CK-7 and HLA-G staining identified trophoblast populations and served as control for staining quality of the tissue.
Immunoblotting
Snap frozen basal plate and chorionic villi placental samples were homogenized in RIPA buffer (Tris HCL 50mM pH 7.4, NaCL 150mM, NP-40 1%, Sodium deoxycholate 0.5%, socium dodecyl sulfate 0.1%, EDTA 5mM, protease inhibitor (Sigma P8340)). Protein concentrations determined using the Bradford method [27]. For serum, a 1:10 dilution was made with 1× PBS. 12.5ul of sera or 30 μg of protein lysates were loaded in 6X loading buffer (Boston BioProducts). Samples were separated on a 4-15% gradient Criterion Tris-HCL gel (BioRad) and transferred to a polyvinylidene difluoride membrane (PVDF, BioRad). Blocking was performed for 1 hour using 5% bovine serum albumin in TBS-T (10mM Tris Base, 150mM NaCl and 0.05% tween 20, pH 8.4). Membrane was then incubated with anti-PAPP-A2 antibody (1:10,000; kindly provided by Claus Oxvig [17]) in blocking buffer overnight at 4°C. After wa shing with TBS-T the membrane was incubated for 1 hour at RT with anti-rabbit horseradish peroxidase-conjugated antibody diluted in blocking buffer (1:100,000; Sigma). Following final rinse with TBS, chemiluminescence (Western Lightening Plus-ECL, Perkin & Elmer) was used to visualize the immunoreactive bands and exposed to XR film. For placental samples, protein loading was assessed using anti-β-actin antibody, 1:10,000 (Sigma clone AC-74/076K4771) and for serum blots loading was assessed by albumin. Immunoreactive bands were visualized as described above. Densitometry was performed using QuantityOne software (BioRad).
Statistical Analysis
Differences in PAPP-A2 measurements among trimesters were determined by one-way ANOVA with Tukey's post-test for chorionic villi and Student's t-test for basal plate, as only 2 trimesters were evaluated. Descriptive statistics (geometric means and standard error) were calculated for the preeclamptic and control groups. Differences in PAPP-A2 measurements between these groups were determined using two sample t-tests. Geometric means were transformed back to the original measurement scale. ANOVA and t-tests were performed using Graphpad Prism, version 6.0b. Pearson correlations between BP and CV PAPP-A2 measurements were calculated using R version 3.1.1 (2014-07-10) [28]. Statistical significance was set at p <0.05.
RESULTS
Analysis of the spacio-temporal expression pattern of placental PAPP-A2 over gestation
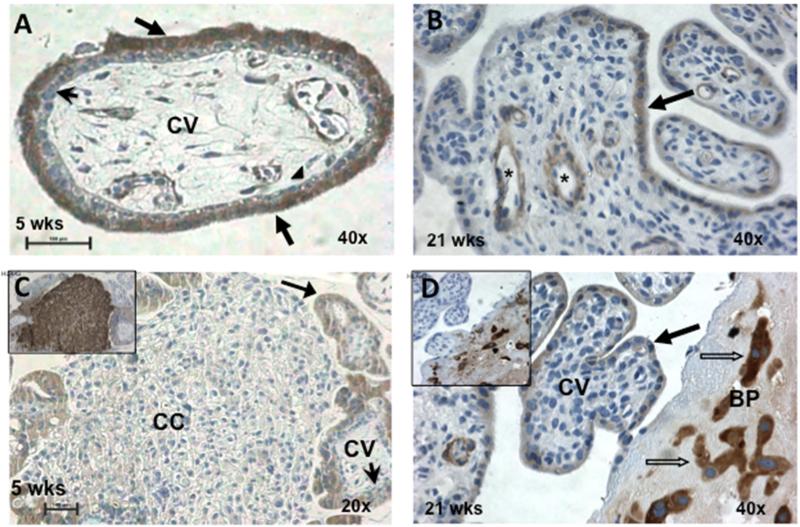
To determine the spacio-temporal expression of placental PAPP-A2 over human gestation, placental samples from first, second and third trimester human placentas were analyzed. First, immunlocalization studies to determine which cell types express PAPP-A2 were performed (Figure 1). In first trimester placental tissue, PAPP-A2 staining is seen in the syncytium with no immunoreactivity of the underlying villous cytotrophoblast layer. In addition PAPP-A2 reactivity is noted in the fetal endothelium and some stromal cells. Cytotrophoblasts within the cell column show weak to no immunoreactivity. Second trimester samples that contain basal plate region demonstrate expression by invasive cytotrophoblasts. No appreciable staining is noted by the decidual cells. PAPP-A2 expression is predominately expressed by differentiated trophoblasts (syncytial trophoblasts and the invasive trophoblasts) and fetal endothelium.
Figure 1. Placental PAPP-A2 expressed by synctiotrophoblasts of the chorionic villi and invasive trophoblasts of the basal plate.
Human placental biopsies from 5 weeks (A,C) and 21 weeks (B,D) gestations were stained for CK-7 to identify all trophoblasts, HLA-G to identify invasive CTBs and PAPP-A2. Panel A shows PAPP-A2 expression by the STBs (arrows) but not the villous CTBs (arrow heads) of the CV. Panel B shows variable PAPP-A2 staining of the STB and cells surrounding the fetal vessels (*). Panel C demonstrates that the HLA-G positive (see insert) CTBs of the cell column have minimal to no detectable PAPP-A2 staining. Panel D demonstrated that the invasive CTBs (blocked arrows) that are HLA-G positive (insert) in the BP stain for PAPP-A2. Bar represents 100μM. CK-7: cytokeratin-7, HLA-G: human leukocyte antigen-G; CTB: cytotrophoblast, STB: synctiotrophoblasts, CV: chorionic villi, CC: cell column, BP: basal plate.
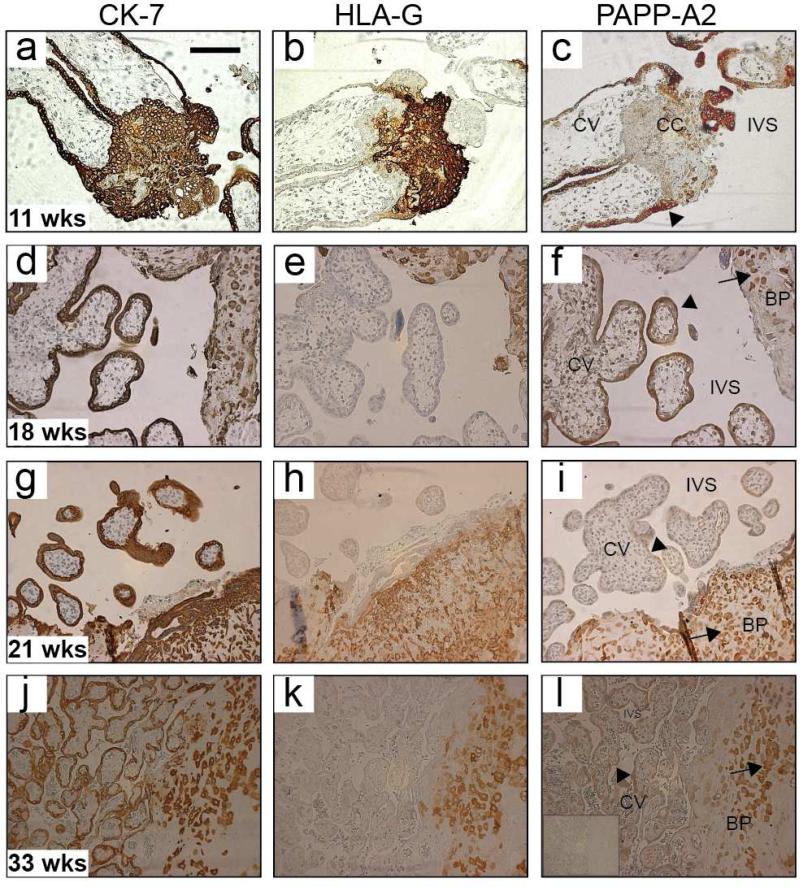
To determine the temporal expression of placental PAPP-A2 over normal gestation, an expanded number of placental samples (n=23) were evaluated using immunohistochemistry and immunoblot analysis of chorionic villi and basal plate protein lysates (n=14). Figure 2 includes representative images of the placental immunohistochemistry. Semi-quantitative assessment of the staining pattern of PAPP-A2 is provided in Supplement Data (Table S1). In the early first trimester, PAPP-A2 stained all of the syncytiotrophoblasts (STB) but was not visible in the cytotrophoblasts (CTB) of the chorionic villi. As pregnancy progressed into the second trimester, PAPP-A2 staining decreased in the STBs while light staining became visible in the invasive CTBs of the basal plate. In the late second and early third trimester, PAPP-A2 expression returns and increases in both the STB and invasive CTBs of the basal plate. PAPP-A2 expression is not noted in the decidual cells of the basal plate. Of note, the relationship between gestational age and PAPP-A2 expression varied for the invasive CTB and STB showing different temporal expression of PAPP-A2 in different regions of the placenta.
Figure 2. PAPP-A2 immunohistochemical analysis of human chorionic villi and basal plate over gestation.
Representative human placental biopsies stained with CK-7 to identify all trophoblasts (column 1), HLA-G to identify invasive CTBs (column 2), and PAPP-A2 (column 3). Rows are serial sections from one placenta, ordered going down by increasing gestational age [11 weeks (a-c), 18 weeks (d-f), 21 weeks (g-i) and 33 weeks (j-l)]. All sections showed the expected pattern for CK-7 (all trophoblasts), and HLA-G staining (invasive CTBs). PAPP-A2 staining in earlier pregnancy samples (c, f), was detected in the STBs (arrowheads). Cell column (CC) trophoblasts lack or have minimal staining (c). STB (arrows) staining then decreased in the late second trimester (i). PAPP-A2 expression returns in most of the STB by 33 weeks (l). A negative control is shown in insert (l). CK-7: cytokeratin-7, HLA-G: human leukoctye antigen-G, CTB: cytotrophoblast, STB: synctiotrophoblasts, CV: chorionic villi, BP: basal plate, CC: cell column; and IVS: intervillous space
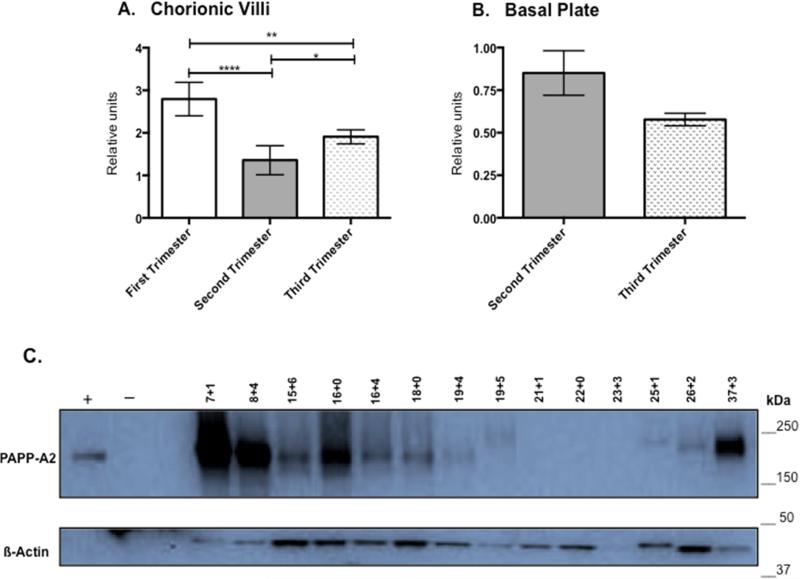
PAPP-A2 levels in chorionic villi, as determined by immunoblot, are significantly different in each trimester compared to all others. PAPP-A2 is highest in first trimester (n=4; 6-12 weeks), then decreases during the second trimester (n=5; 13-23 weeks) and rises again in the third trimester (n=5; 24-40 weeks; Figure 3A). Basal plate samples were not available for first trimester biopsies. There is not a significant difference detected between the second (n=9) and third trimester (n=5) basal plate PAPP-A2 levels (p=0.08; Figure 3B). Based on the IHC studies, samples at mid-gestation often lacked detectable PAPP-A2 levels in the chorionic villi so additional samples covering smaller gestational age windows in the second trimester were also evaluated by immunoblot analysis to clarify the temporal expression pattern. PAPP-A2 expression is high both in the early and late gestation lysates. First and third trimester samples were included for comparison. PAPP-A2 levels progressively decrease in the early second trimester and by around 20 weeks gestation, PAPP-A2 levels are extremely low or not detectable. PAPP-A2 is then detected in the 25-26 week samples. Samples in Figure 3C are independent from those reported in Fig. 3A and densitometry was not performed given the lack of PAPP-A2 in multiple lanes. Although some of the B-actin bands are light, they are still visible and the PAPP-A2 expression trends appreciated. Of interest is the upward shift of PAPP-A2 in several lanes, which may reflect post-translational modifications, such as glycosylation being different among individuals. The on-off-on again expression pattern is in contrast to expression in the basal plate, which did not reveal a clear developmental expression pattern (data not shown). This demonstrates that PAPP-A2 appears to be under different regulatory influences in the various placental regions and shows down regulation during mid-gestation in the chorionic villi.
Figure 3. Placental PAPP-A2 Expression Changes over Gestation.
3A: PAPP-A2 expression in CV by trimester: First (5-12 weeks: n=4), Second (13-24 weeks; n=5), Third (24-39 weeks; n=5). * P<0.05, ** p<0.001, **** p<.0001. 3B: PAPP-A2 expression in BP by trimester (Second n=9; Third, n=5, p=0.08). 3C Immunoblot for PAPP-A2 on additional CV protein lysates focusing on the second trimester (n=9; 15-23 weeks). Pregnant (36wk) and non-pregnant female serum served as positive and negative controls. First trimester (n=2) and third trimester (n=3) are provided for comparison. Staining for ß-actin for protein loading control. Gestational age of samples noted above lane (weeks+days). Image of full blot provided in supplemental data (Fig. S1)
The effect of labor on PAPP-A2 levels
To assess whether labor impacts PAPP-A2 expression, immunoblot analysis was performed using basal plate and chorionic villi samples from term normotensive subjects who underwent scheduled cesarean deliveries prior to labor (n=8) or from deliveries that labored (n=8). No significant difference was noted in PAPP-A2 levels in either the basal plate region (p=0.25) or the chorionic villi (p=0.52) between labored and non-labored samples (Supplemental Data, Fig. S2). This suggests that the physiologic process of labor does not impact PAPP-A2 expression.
PAPP-A2 levels in preeclamptic pregnancies
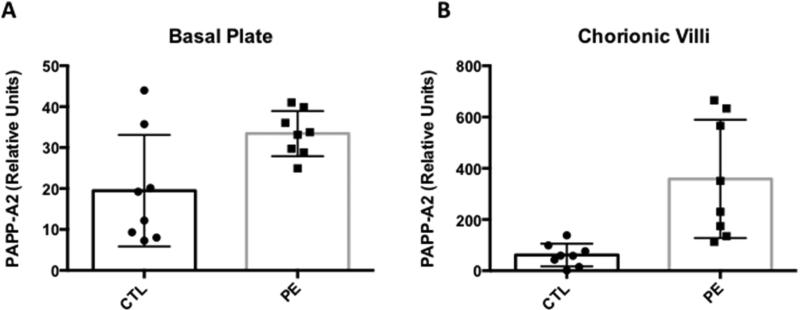
To further explore the relationship between PAPP-A2 expression in the BP and CV regions from preeclamptic and normotensive pregnancies, immunoblot analysis was performed on preeclamptic (n=8) and normotensive control samples (n=8) with gestational ages varying between 25 and 40 weeks of gestation. Half of the samples are from early onset PE (25-34 weeks), and the other half are from late onset PE (35-40 weeks). For each preeclamptic sample, a control sample was selected, to be gestational age matched within 3 days. As expected, on the placental level, there are significant differences in the mean PAPP-A2 values between preeclamptic and control cases in the basal plate and chorionic villi (Figure 4). The data presented by early and late onset is presented in Supplemental Data (Figure S3). The increase is much greater for the CV compared to the BP with preeclampsia, suggesting differential regulation of PAPP-A2 in these two distinct placental regions. Therefore, correlations between the basal plate and chorionic villi PAPP-A2 for the controls (r=0.59, p=0.1209) and preeclamptics (r=−0.23, p=0.5758) were calculated. Neither group exhibited statistically significant correlations suggesting that PAPP-A2 levels are differentially regulated, consistent with the developmental IHC analysis.
Figure 4. Placental PAPP-A2 expression is increased in the basal plate and chorionic villi of preeclamptic (PE) compared to control (CTL) pregnancies.
Relative PAPP-A2 levels normalized to ß-actin determined by immunoblot analysis of basal plate (A) and chorionic villi (B) protein lysates from PE (n= 8) compared to CTL (n=8). PAPP-A2 levels are significantly higher in basal plate of PE (33.01 ± 0.97) compared to CTL (15.87 ± 2.70) (p=0.02) and in the chorionic villi of PE (290.90 ± 12.19) compared to CTL (36.92 ± 8.86) (p=0.005). Statistical analysis performed using Student's t-test.
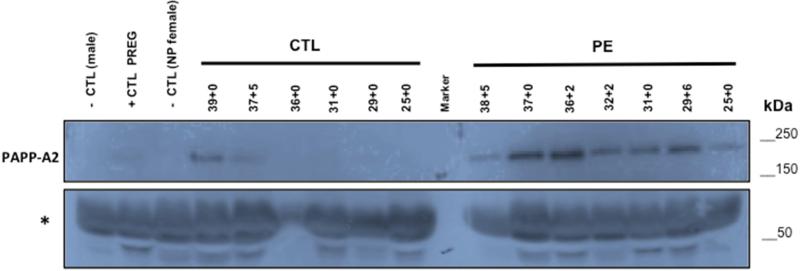
To confirm elevated circulating levels of PAPP-A2 in preeclampsia, immunoblot analysis of serum from preeclamptic (n=7) and normotensive controls (n=6) from 25-39 weeks gestation were performed. PAPP-A2 is increased in maternal serum from pregnancies complicated by preeclampsia. Because PAPP-A2 increases with advanced gestational age, the difference between preeclamptics and controls is greater in more preterm samples (Figure 5). The lack of immunoreactivity in the controls at the earlier gestations made densitometry analysis not possible.
Figure 5. Serum levels of PAPP-A2 are higher from pregnancies complicated by preeclampsia.
Immunoblot for PAPP-A2 of pregnancy sera (10uL; diluted 1:10 in PBS) from pregnancies at stated gestational ages (weeks+days) from normotensive (n=6; CTL) or preeclamptic (n=7; PE) pregnancies. Serum from non-pregnant female and male serve as negative controls and serum from pregnant female serves as positive control. Samples ordered by decreasing age (39 to 25 weeks gestation) within each category. Non-specific band (*) at ~60kDa consistent with albumin shows protein loading. The 36-week CTL sample is clearly underloaded. (Image of full blot provided as supplemental data; Fig. S4)
Relationship of maternal and fetal PAPPA-2 serum levels
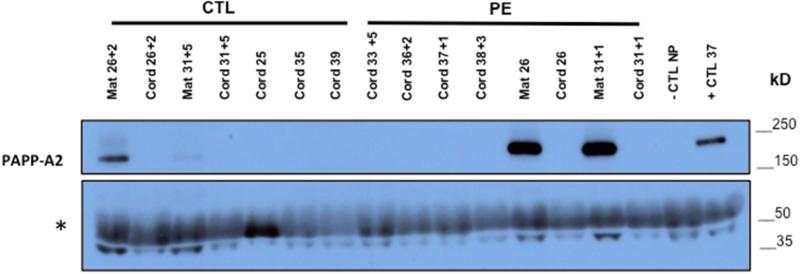
To assess whether PAPP-A2 is also increased in fetal circulation in preeclampsia, immunoblot analysis of venous cord blood from preeclampsia (n=6) and CTL (n=5) was performed with maternal bloods from two preeclamptic and control cases included. As expected, the results confirmed higher PAPP-A2 expression in maternal preeclampsia cases compared to controls. However, PAPP-A2 is not detectable in cord blood samples even from pregnancies with markedly high levels seen in maternal blood (Figure 6).
Figure 6. PAPP-A2 is not detectable in cord blood serum.
Immunoblot for PAPP-A2 on venous cord blood serum (12 μl; 1:10 dilution with 1x PBS) from normotensive (n= 5) and preeclamptic (n=6) pregnancies with maternal serum from some of the same pregnancies (Mat; n=4). Gestational age at delivery noted as weeks + days above lane. Non-pregnant and pregnant sera serve as negative and positive controls. Non-specific band (*) at ~60kDa consistent with albumin reflects protein loading. An overexposed film is shown to clarify lack of detection of PAPP-A2 in cord blood sera. (Image of full blot provided in supplemental data; Fig. S5).
DISCUSSION
In the present work, we show that PAPP-A2 is expressed by syncytiotrophoblasts, invasive cytotrophoblasts and fetal endothelium. PAPP-A2 is not expressed by decidua or villous cytotrophoblasts. PAPP-A2 expression levels vary between the basal plate and chorionic villous regions of the placenta and over gestation. Both maternal sera and placental tissue from pregnancies complicated by preeclampsia show increased levels of PAPP-A2, while labor does not appear to affect expression. Additionally, PAPP-A2 cannot be detected in cord blood demonstrating that the alterations in PAPP-A2 on the maternal side are not recapitulated in the fetal circulation, despite the fact that fetal endothelium within the chorionic villi of the placenta expresses PAPP-A2. So while PAPP-A2 produced by trophoblasts of the placenta likely account for the elevated levels in maternal circulation; PAPP-A2 does not appear to be transported from the placenta into the fetal circulation. Alternatively, PAPP-A2 may be rapidly broken down in fetal circulation, making it undetectable.
Wang et al similarly demonstrated PAPP-A2 expression in synciotrophoblasts and invasive cytotrophoblasts in first trimester placenta [10], while Macintire and Nishizawa demonstrated similar PAPP-A2 expression in synciotrophoblasts at later gestations, and with preeclampsia [11, 21]. However, this is the first study to show the differential expression throughout gestation. It appears that PAPP-A2 has an on - off - on again expression pattern in the synciotrophoblasts. While staining of invasive cytotrophoblasts is present in the second trimester, there is no statistically significant change in expression levels with increasing gestation. Whether the increase in PAPP-A2 in preeclampsia, is due to either a lack of down regulation or induced expression, cannot be concluded due to lack of longitudinal samples prior to onset for the preeclamptic cases.
Kloverpris et al demonstrated that circulating PAPP-A2 sera levels in normal human pregnancy are elevated in the first trimester over nonpregnant serum, and then rise exponentially throughout the second trimester, stabilizing around 33 weeks [29]. We also saw expression increase over the third trimester with the strongest expression at term. However, this contrasts our placental immunoblot studies, which demonstrated strong expression of PAPP-A2 early in pregnancy in the chorionic villi, a decrease in the second trimester and then a progressive increase again until term. While the earliest placental samples represent a timeframe prior to establishment of maternal circulation into the intervillous space, the sera at 11-14 weeks should reflect maternal circulation sampling of the placenta. This lack of correlation between the placental and maternal sera levels of PAPP-A2 may be due to the fact that the overall placental size is much smaller at these earlier gestational ages. So while PAPP-A2 expression is increased per grams of placental tissue, the overall production that is released into the circulation may be comparable when considering STB expression levels and overall placental size.
Given the report of PAPP-A2 elevation in the first trimester in women who subsequently develop preeclampsia [5], the elevation of PAPP-A2 by the early third trimester in the sera and placentas of women with preeclampsia, and the on-off-on again developmental expression pattern of PAPP-A2, the question remains as to whether in preeclampsia PAPP-A2 expression is not appropriately downregulated in the second trimester. If in early pregnancy, PAPP-A2 cleaves IGFBP5, releasing IGF to potentiate cytotrophoblast migration and invasion, then the persistent elevation may reflect an attempt to further stimulate invasion when in normal development this is no longer required.
CONCLUSION
The developmental pattern of PAPP-A2 expression in placenta demonstrates diferential expression in different placental regions and over gestation. It is also well documented that PAPP-A2 increases in preeclampsia both in the placenta and maternal circulation, but what is driving expression in preeclampsia and over development in the various placental regions is yet to be elucidated. The implication of PAPP-A2 expression on IGF biology in these spacio-temporal patterns is an area for further exploration. Determining the interactions of PAPP-A2, IGF-I, IGF-II, and IGFBPs and elucidating the effect on human placentation and the development of preeclampsia will be important to determine if and how these molecules can be utilized and manipulated to improve the clinical management of preeclampsia.
Supplementary Material
HIGHLIGHTS.
PAPP-A2 is expressed by differentiated trophoblasts and the fetal endothelium
Different placental regions show varying temporal PAPP-A2 expression
Mid-second trimester chorionic villi show strong developmental down regulation
PAPP-A2 is elevated in the placenta and maternal serum in preeclampsia
PAPP-A2 is not detectable in the fetal circulation or altered by labor
ACKNOWLEDGEMENTS
Dr. Claus Oxvig (University of Aarhus) for PAPP-A2 antibody, Anne Mailhot for laboratory assistance, the Perinatal Clinical Research Center staff for assistance with third trimester placental collection, Nicole Carlson, Adrianne Stefanski, and Peter DeWitt for statistical advice. Nadine Martinez and Purnima Narasimhan for assistance with figures. Funding by Department of Obstetrics and Gynecology University of Colorado School of Medicine, March of Dimes Basil O'Conner, WRHR K12 HD001271-, AAOGF Career Development Award. R01 HD60723-01 and Supported by NIH/NCATS Colorado CTSA Grant Number UL1 TR001082.
Footnotes
Publisher's Disclaimer: This is a PDF file of an unedited manuscript that has been accepted for publication. As a service to our customers we are providing this early version of the manuscript. The manuscript will undergo copyediting, typesetting, and review of the resulting proof before it is published in its final citable form. Please note that during the production process errors may be discovered which could affect the content, and all legal disclaimers that apply to the journal pertain.
Disclosures:
Anita Kramer: No conflicts of Interest.
Leah Lamale-Smith: No conflicts of Interest.
Contents are the authors’ sole responsibility and do not necessarily represent official NIH views.
REFERENCES
- 1.Duley L. The global impact of pre-eclampsia and eclampsia. Semin Perinatol. 2009;33(3):130–7. doi: 10.1053/j.semperi.2009.02.010. [DOI] [PubMed] [Google Scholar]
- 2.Uzan J, et al. Pre-eclampsia: pathophysiology, diagnosis, and management. Vasc Health Risk Manag. 2011;7:467–74. doi: 10.2147/VHRM.S20181. [DOI] [PMC free article] [PubMed] [Google Scholar]
- 3.Roberts JM, Cooper DW. Pathogenesis and genetics of pre-eclampsia. Lancet. 2001;357(9249):53–6. doi: 10.1016/s0140-6736(00)03577-7. [DOI] [PubMed] [Google Scholar]
- 4.Redman CW, Sargent IL. Latest advances in understanding preeclampsia. Science. 2005;308(5728):1592–4. doi: 10.1126/science.1111726. [DOI] [PubMed] [Google Scholar]
- 5.Crosley EJ, et al. First-Trimester Levels of PregnancyAssociated Plasma Protein A2 ( PAPP-A2) in the Maternal Circulation Are Elevated in Pregnancies That Subsequently Develop Preeclampsia. Reproductive Sciences. 2014;21(6):754–760. doi: 10.1177/1933719113512532. [DOI] [PMC free article] [PubMed] [Google Scholar]
- 6.Nayak NR, Giudice LC. Comparative biology of the IGF system in endometrium, decidua, and placenta, and clinical implications for foetal growth and implantation disorders. Placenta. 2003;24(4):281–96. doi: 10.1053/plac.2002.0906. [DOI] [PubMed] [Google Scholar]
- 7.Giudice LC, et al. Insulin-like growth factor binding protein-1 at the maternal-fetal interface and insulin-like growth factor-I, insulin-like growth factor-II, and insulin-like growth factor binding protein-1 in the circulation of women with severe preeclampsia. Am J Obstet Gynecol. 1997;176(4):751–7. doi: 10.1016/s0002-9378(97)70598-2. discussion 757-8. [DOI] [PubMed] [Google Scholar]
- 8.Gratton RJ, Asano H, Han VK. The regional expression of insulin-like growth factor II (IGF-II) and insulin-like growth factor binding protein-1 (IGFBP-1) in the placentae of women with pre-eclampsia. Placenta. 2002;23(4):303–10. doi: 10.1053/plac.2001.0780. [DOI] [PubMed] [Google Scholar]
- 9.Overgaard MT, et al. Pregnancy-associated plasma protein-A2 (PAPP-A2), a novel insulin-like growth factor-binding protein-5 proteinase. J Biol Chem. 2001;276(24):21849–53. doi: 10.1074/jbc.M102191200. [DOI] [PubMed] [Google Scholar]
- 10.Wang J, et al. Expression of pregnancy-associated plasma protein A2 during pregnancy in human and mouse. J Endocrinol. 2009;202(3):337–45. doi: 10.1677/JOE-09-0136. [DOI] [PubMed] [Google Scholar]
- 11.Nishizawa H, et al. Increased levels of pregnancy-associated plasma protein-A2 in the serum of pre-eclamptic patients. Mol Hum Reprod. 2008;14(10):595–602. doi: 10.1093/molehr/gan054. [DOI] [PubMed] [Google Scholar]
- 12.Page NM, et al. The characterization of pregnancy associated plasma protein-E and the identification of an alternative splice variant. Placenta. 2001;22(8-9):681–7. doi: 10.1053/plac.2001.0709. [DOI] [PubMed] [Google Scholar]
- 13.Boldt HB, Conover CA. Pregnancy-associated plasma protein-A (PAPP A): a local regulator of IGF bioavailability through cleavage of IGFBPs. Growth Horm IGF Res. 2007;17(1):10–8. doi: 10.1016/j.ghir.2006.11.003. [DOI] [PubMed] [Google Scholar]
- 14.Yan X, Baxter RC, Firth SM. Involvement of pregnancy-associated plasma protein-A2 in insulin-like growth factor (IGF) binding protein-5 proteolysis during pregnancy: a potential mechanism for increasing IGF bioavailability. J Clin Endocrinol Metab. 2010;95(3):1412–20. doi: 10.1210/jc.2009-2277. [DOI] [PubMed] [Google Scholar]
- 15.Christians JK, Gruslin A. Altered levels of insulin-like growth factor binding protein proteases in preeclampsia and intrauterine growth restriction. Prenat Diagn. 2010;30(9):815–20. doi: 10.1002/pd.2583. [DOI] [PubMed] [Google Scholar]
- 16.Nishizawa H, et al. Microarray analysis of differentially expressed fetal genes in placental tissue derived from early and late onset severe pre-eclampsia. Placenta. 2007;28(5-6):487–97. doi: 10.1016/j.placenta.2006.05.010. [DOI] [PubMed] [Google Scholar]
- 17.Winn VD, et al. Severe preeclampsia-related changes in gene expression at the maternal-fetal interface include sialic acid-binding immunoglobulin-like lectin-6 and pappalysin-2. Endocrinology. 2009;150(1):452–62. doi: 10.1210/en.2008-0990. [DOI] [PMC free article] [PubMed] [Google Scholar]
- 18.Varkonyi T, et al. Microarray profiling reveals that placental transcriptomes of early-onset HELLP syndrome and preeclampsia are similar. Placenta. 2011;32(Suppl):S21–9. doi: 10.1016/j.placenta.2010.04.014. [DOI] [PMC free article] [PubMed] [Google Scholar]
- 19.Whitehead CL, et al. Placental specific mRNA in the maternal circulation are globally dysregulated in pregnancies complicated by fetal growth restriction. J Clin Endocrinol Metab. 2013;98(3):E429–36. doi: 10.1210/jc.2012-2468. [DOI] [PubMed] [Google Scholar]
- 20.Rasanen J, et al. Comprehensive maternal serum proteomic profiles of preclinical and clinical preeclampsia. J Proteome Res. 2010;9(8):4274–81. doi: 10.1021/pr100198m. [DOI] [PubMed] [Google Scholar]
- 21.Macintire K, et al. PAPPA2 is increased in severe early onset pre-eclampsia and upregulated with hypoxia. Reprod Fertil Dev. 2014;26(2):351–7. doi: 10.1071/RD12384. [DOI] [PubMed] [Google Scholar]
- 22.Buimer M, et al. Seven placental transcripts characterize HELLP-syndrome. Placenta. 2008;29(5):444–53. doi: 10.1016/j.placenta.2008.02.007. [DOI] [PubMed] [Google Scholar]
- 23.Drey EA, et al. Improving the accuracy of fetal foot length to confirm gestational duration. Obstet Gynecol. 2005;105(4):773–8. doi: 10.1097/01.AOG.0000154159.75022.11. [DOI] [PubMed] [Google Scholar]
- 24.Obstetrics A.C.o.P.B. ACOG Practice Bulletin No. 107: Induction of labor. Obstet Gynecol. 2009;114(2 Pt 1):386–97. doi: 10.1097/AOG.0b013e3181b48ef5. [DOI] [PubMed] [Google Scholar]
- 25.Winn VD, et al. Gene expression profiling of the human maternal-fetal interface reveals dramatic changes between midgestation and term. Endocrinology. 2007;148(3):1059–79. doi: 10.1210/en.2006-0683. [DOI] [PubMed] [Google Scholar]
- 26.McMaster M, et al. HLA-G isoforms produced by placental cytotrophoblasts and found in amniotic fluid are due to unusual glycosylation. J Immunol. 1998;160(12):5922–8. [PubMed] [Google Scholar]
- 27.Kruger NJ. The Bradford method for protein quantitation. Methods Mol Biol. 1994;32:9–15. doi: 10.1385/0-89603-268-X:9. [DOI] [PubMed] [Google Scholar]
- 28.Team RC. A Language and Environment for Statistical Computing. R Foundation for Statistical Computing; Vienna, Austria: 2014. [Google Scholar]
- 29.Kloverpris S, et al. A robust immunoassay for pregnancy-associated plasma protein-A2 based on analysis of circulating antigen: establishment of normal ranges in pregnancy. Mol Hum Reprod. 2013;19(11):756–63. doi: 10.1093/molehr/gat047. [DOI] [PubMed] [Google Scholar]
Associated Data
This section collects any data citations, data availability statements, or supplementary materials included in this article.


