Abstract
High-resolution three-dimensional (3D) imaging of cardiovascular dynamics in mouse embryos is greatly desired to study mammalian congenital cardiac defects. Here, we demonstrate direct four-dimensional (4D) imaging of the cardiovascular structure and function in live mouse embryos at a ~43 Hz volume rate using an optical coherence tomography (OCT) system with a ~1.5 MHz Fourier domain mode-locking swept laser source. Combining ultrafast OCT imaging with live mouse embryo culture protocols, 3D volumes of the embryo are directly and continuously acquired over time for a cardiodynamics analysis without the application of any synchronization algorithms. We present the time-resolved measurements of the heart wall motion based on the 4D structural data, report 4D speckle variance and Doppler imaging of the vascular system, and quantify spatially resolved blood flow velocity over time. These results indicate that the ultra-high-speed 4D imaging approach could be a useful tool for efficient cardiovascular phenotyping of mouse embryos.
Studying the developmental mechanisms in mouse embryos provides great insights for further understanding the genetic basis of normal development and congenital defects in humans [1]. Early and recent studies that applied optical coherence tomography (OCT) for live embryonic imaging established OCT as a promising approach for studying early cardiovascular development in various animal models [2–4]. Since the mouse is a superior mammalian model of human congenital cardiac defects [5], our efforts have been focused on the development of live OCT imaging approaches for the mouse cardiovascular system at early embryonic stages [6,7]. However, due to the high beating rate and fast developmental changes of the heart in mouse embryos, directly capturing the cardiodynamics in three dimensions with sufficient resolution in both the temporal and spatial domains is challenging with traditional OCT imaging, which has the A-line acquisition speed of up to a few hundreds of kilohertz.
To overcome this limitation, gating and synchronization methods have been implemented for OCT embryonic imaging. From the aspect of data acquisition, Jenkins et al. gated OCT B-scan imaging to the same phase of the heartbeat by electrical pacing the explanted embryonic hearts [8] or utilizing the laser Doppler signal measured from live avian embryos [9]. Similarly, the Doppler measurement from a second OCT system was used as the gating signal [10]. From the post-processing side, a number of image-based reconstruction approaches were developed to synchronize a time series of B-scan images taken from different locations of the beating heart with transverse or rotational galvanometer scanning schemes [11–15]. Although these gating and post-processing methods have been routinely utilized to obtain four-dimensional (4D) embryonic cardiodynamics and allowed for structural and functional assessments of the cardiovascular system [16–20], all these techniques integrate the cardiac motion at different positions from different cycles into one heartbeat. This heavily relies on the perfect periodicity of the cardiac cycle, which is an approach that is prone to errors, and excludes arrhythmia models from the analysis. Also, these methods require large data sets to be acquired, a long acquisition time that affects the phenotyping throughput, and complex post-processing. Thus, direct volumetric imaging of the beating embryonic heart at a high volume rate is desired.
Previously, there have been several attempts to directly acquire three-dimensional (3D) volumes over time for 4D embryonic heart imaging in Xenopus and avian models [21,22]. However, due to the relatively slow A-line acquisition speed (54 and 100 kHz), the interdependence of the spatial and temporal sampling rates leads to limited resolving capabilities in either the transverse or time dimension [21,22], which are not suitable for embryonic cardiovascular analysis in mouse models. In this Letter, we demonstrate direct 4D structural and functional imaging of cardiovascular dynamics in live mouse embryos using an OCT system with an A-line rate of ~1.5 MHz. We present a quantitative analysis of the heart wall motion from direct volumetric imaging, report the capability of this method to provide 4D speckle variance and Doppler imaging of the major blood vessels, and show the feasibility of measuring the time- and spatially-resolved blood flow velocity profiles.
The OCT system employed a Fourier domain mode-locking (FDML) [23] swept laser source (Optores GmbH, Germany) that provided a spectrum sweep rate of ~1.5 MHz. The wavelength range of the laser was tuned to have a bandwidth of ~100 nm, with a central wavelength of 1316 nm. The laser had an output power of up to ~160 mW. The OCT system schematic is shown in Fig. 1(A). A fiber-based Mach–Zehnder interferometer was utilized for light interference, and a recalibration arm was built for the k-space resampling of the fringes. The interference signals from the balanced photodetector were digitized at 1.8 GS/s in 12 bits by an analog-to-digital converter (ADC) card (Alazar Technologies Inc., Canada). In the sample arm, fast scanning of the imaging beam was achieved by using a resonant scanner (Electro-Optical Products Corp., U.S.) with a frequency of ~3.2 kHz. Only the linear region of the sinusoidal scanning function was utilized. A galvanometer scanner (Thorlabs, Inc., U.S.) with two orthogonal mirrors was set in the sample arm for the beam scanning in the slow axis and for the traditional large-field 3D imaging at a lower speed. With a 5× scan lens, the beam size at the imaging focal plane was ~25 μm. The OCT system provided an axial resolution of ~16 μm and a sensitivity of ~106 dB (with the imaging beam power of ~46 mW in the sample arm), and the phase stability of the system was measured to be ~0.13 radians between identical sweeps of the laser. For live mouse embryonic imaging, the whole sample arm was placed inside an incubator.
Fig. 1.
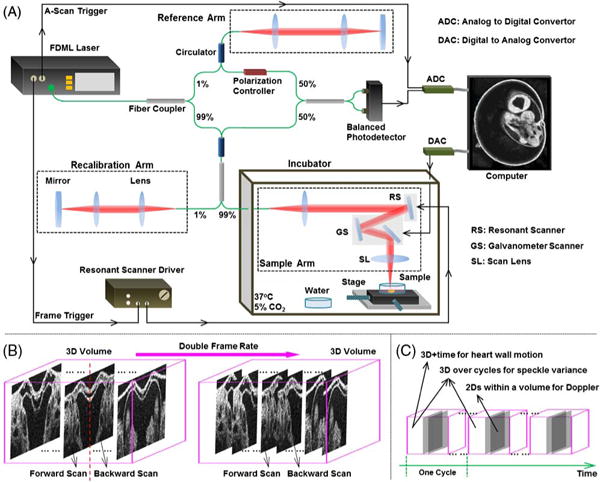
(A) Schematic of the OCT system and mouse embryonic imaging setup. (B) Scanning approach for direct 4D OCT embryonic imaging. (C) 4D data analysis for structural and functional imaging of the embryonic heart and blood flow in the cardiovascular system.
In this study, we imaged E9.5 mouse embryos. This stage corresponds to about 24 h after the beginning of the heartbeat. During this time, the heart undergoes dramatic morphological and functional changes, revealing early cardiac embryonic defects. Timed matings with CD-1 mice were set up and the female mice were monitored every morning for a vaginal plug. The time when a plug was found was counted as E0.5. The embryo preparation and culturing procedures have been described in detail in our previous work [24]. The live embryos were kept in a humidified incubator at 37°C and 5% CO2 during OCT imaging. All animal manipulation procedures have been approved by the Animal Care and Use Committee of the Baylor College of Medicine and the University of Houston.
To maximize the imaging speed of the OCT system, both the forward and backward movements of the resonant scanning mirror were utilized to reach a final frame rate of ~6.4 kHz. During post-processing, B-scan images were split according to the forward and backward scans. The backward scans were flipped and aligned to the forward scans by two-dimensional (2D) cross-correlation for a complete 3D volume [Fig. 1(B)]. Each frame consisted of 208 A-scans with a spatial sampling interval of ~8 μm. The volume rate was reduced from the theoretically achievable rate to provide extra time for the backward movement of the galvanometer mirror. With 100 frames per volume, we achieved a volume rate of ~43 Hz for direct 4D imaging, and the interval between adjacent frames was ~9 μm. With these settings, the scanning area covered the whole E9.5 embryonic heart with sufficient spatial and temporal sampling points to resolve the dynamic features.
Imaris software (Bitplane, Switzerland) was utilized to render and visualize the 4D cardiodynamics and to create cross-sectional views through the heart for further analysis of its motion characteristics. Specifically, the inner diameters of the heart tube at the locations of the primitive atrium and primitive ventricle were measured over time to reveal the phase difference of the cardiac activities. The pulse wave propagation through the outflow tract (OFT) was assessed by monitoring the displacements over time at five locations along the OFT wall, enabling the quantification of the pulse wave velocity (PWV), which is correlated with the OFT wall elasticity [25]. The PWV was calculated as the propagation distance divided by the measured time delay of the OFT contraction for the five spatial positions.
As illustrated in Fig. 1(C), for 4D functional imaging of the vascular dynamics, speckle variance (SV) and Doppler analyses were performed on the 3D volumes over cycles and the B-scans over spatial locations, respectively. The cardiac cycle, T, was first determined based on the structural data. The SV volume, SV, at the time position t of one heartbeat cycle was calculated on a pixel basis as
| (1) |
where I represents the OCT intensity signal. Since the same temporal positions from six continuous heartbeat cycles were utilized for analysis, the SV signal highlighted the vasculature where the perfusion of the blood cells formed the contrast of imaging. Repeating this calculation for different time points in the cardiac cycle provided 4D SV imaging of the blood vessels.
Besides the structural data from the OCT intensity signal, the optical phase information of the interference was retrieved from the complex OCT signal. Within each 3D volume, 2D Doppler images were obtained on a pixel basis by subtracting the adjacent phase B-scans that were from the same resonant scanning direction. The remapping of the 2D Doppler images back to the spatial and temporal locations provided 4D Doppler imaging of blood flow in the embryonic vascular system. Since the difference in optical phase, ΔΦ, is related to the movement of the scatters (blood cells), the absolute blood flow velocity, v, was quantified by
| (2) |
where λ is the central wavelength, Δt is the time interval, and θ is the angle of the blood vessel relative to the OCT imaging beam, which was obtained from the 3D structural image. The refractive index n of blood was assumed to be 1.4. The velocity measurement was performed over time at different spatial positions across a selected blood vessel.
Figure 2(A) shows a 3D image of a whole E9.5 mouse embryo with well-visualized structural features. A general slow-scanning scheme with only galvanometer mirrors was utilized to cover the relatively large field of view. Distortions can be seen from the heart region; these were caused by the heartbeat of the live embryo during the slow scan. Direct, ultrafast 4D imaging of the cardiodynamics in the E9.5 mouse embryo is shown in Visualization 1 and Fig. 2(B). The structure and motion of the heart, including the atrium, ventricle, and OFT, are clearly seen from the 4D data. The blood cells in the vascular system [indicated with arrows in Fig. 2(B)] and their circulation can be directly visualized.
Fig. 2.
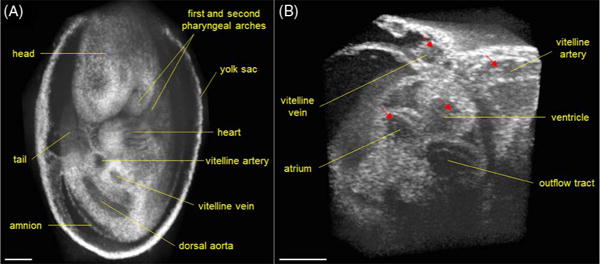
(A) Large-field 3D OCT image of E9.5 mouse embryo obtained with slow galvanometer mirror scanning. (B) 4D cardiodynamics of E9.5 mouse embryo obtained from direct time-lapse 3D imaging with a volume acquisition rate of ~43 Hz (Visualization 1). Arrows indicate the blood cells. Scale bars = 300 μm.
Direct 4D cardiodynamics at a ~43 Hz volume rate allows for the quantitative analysis of the heart motion characteristics. Based on the time-resolved measurements of the inner diameters from the atrium and ventricle, Fig. 3(A) shows the temporal profiles of the cardiac diastole and systole at these two major anatomical sites of the mouse embryonic heart. It can be clearly seen that the atrium has a relatively longer relaxation period, but a shorter contraction period. In comparison, the ventricle experiences a duty cycle of ~50%. As a result, the beat of the ventricle undergoes different time delays from the atrium for the diastole and the systole, measured as ~152 and ~70 ms, respectively. Figure 3(B) plots the time-dependent OFT wall displacement from five locations along the tube with a 25 μm distance interval. The clearly shown time delays formed during the contraction of the OFT indicate the propagation of the pulse wave. Similar to that in the chick embryos [25], the delay during contraction is larger than the delay during relaxation of the OFT in the mouse embryos. A 3D surface plot of the OFT pulse wave propagation is shown in Fig. 3(C). The PWV quantified from six continuous heartbeats [Fig. 3(D)] of E9.5 mouse embryo is 1.1 % 0.1 mm/s (mean ± SD), which is comparable to the PWV value (~4.7 mm/s) quantified in a stage HH18 chick embryo [25]. The presented imaging and quantification results for structural cardiodynamics indicate that the direct, 4D, ultrafast OCT imaging can provide high-resolution visualization and a detailed analysis of the heart structure and its motion characteristics in the E9.5 mouse embryo.
Fig. 3.
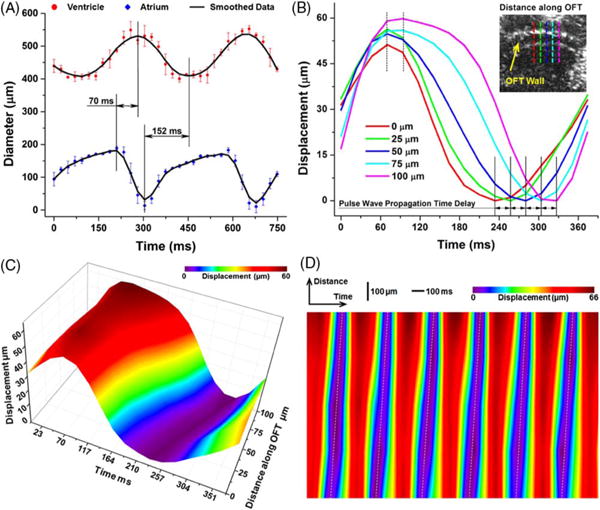
(A) Inner diameters of heart tube over time showing phase delay between the beating atrium and ventricle in E9.5 mouse embryo. Data points represent mean and standard deviation quantified from three heartbeat cycles. (B) Localized displacement from OFT wall over time at five select locations showing time delay of the wall motion. The OCT image with dashed lines shows OFT wall positions used for measurements. (C) Movement of OFT wall over one heartbeat cycle showing pulse wave propagation. (D) Displacement of OFT wall over both time and distance for six continuous heartbeats.
Functional imaging of the cardiovascular dynamics can be obtained through further processing and analyzing the 4D data. Based on Eq. (1), 4D SV imaging of the vasculature of the yolk sac in the E9.5 mouse embryo is shown in Visualization 2 and Fig. 4. Using only the OCT structural image, the blood vessels from the yolk sac could not be distinguished [Fig. 4(A)]. From the SV images [Figs. 4(B) and 4(C)], the vascular distributions are clearly visualized, outlining the major vessels, such as the vitelline vein and artery and their branches.
Fig. 4.
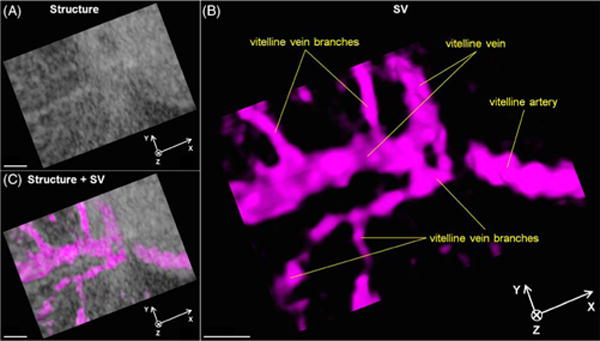
(A) 4D structural, (B) SV, and (C) co-registered images of yolk sac vasculature from E9.5 mouse embryo showing blood perfusion in vessels (Visualization 2). Scale bars = 200 μm.
Figure 5(A) shows a representative volume from the 4D Doppler imaging of the blood flow in the vascular system of the E9.5 mouse embryo. By color mapping the phase shift, the flow in the axial direction is clearly seen in the blood vessels. Doppler signals from the cardiac wall were likely caused by the motion of the heart. For the absolute blood flow velocity calculation [position labeled with a dashed line in Fig. 5(A)], the angle of the vessel relative to the OCT imaging beam was measured as 70°. Using Eq. (2), the quantitative analysis of the blood flow reveals the spatially resolved velocity profiles across the vitelline vein, which correlate well with the parabolic fits, suggesting a laminar flow (Fig. 5B). The velocity variation in the blood vessel over time was also detected [Fig. 5(B)]. The measured peak blood flow velocity (~1.5 mm/s) is in good agreement with the previously reported values (~0.8–3.2 mm/s from yolk sac vessels of similar size) in the E9.5 mouse embryos measured by confocal microscopy and the Doppler OCT [7,26]. These results demonstrate that the proposed imaging approach can be a useful tool for the functional characterization of cardiovascular dynamics in mouse embryos.
Fig. 5.
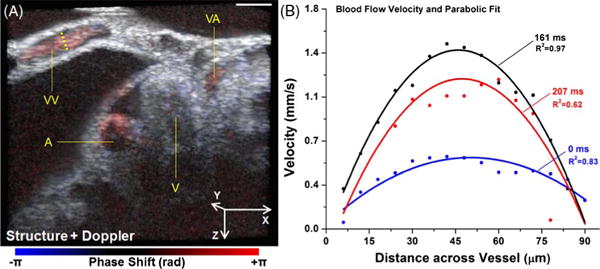
(A) A representative volume of 4D co-registered structural and Doppler images of the heart region from E9.5 mouse embryo. Scale bar = 200 μm. A: atrium; V: ventricle; VA: vitelline artery; VV: vitelline vein. (B) Quantification of time- and spatially-resolved blood flow velocity profiles from the vessel position labeled with a dashed line in (A).
In summary, the imaging method presented in this Letter has major advantages over the previous work. The ~43 Hz volume rate for direct 4D imaging is more than two times higher than the previously reported direct volume rate for cardiac imaging [21,22]. With this ultrafast speed, the volume size of 208 pixels × 768 pixels × 100 pixels provides a sufficient spatial resolving ability for detailed embryonic heart structures. The capability to perform both 4D structural and functional imaging with a single dataset allows for a thorough characterization of the cardiovascular dynamics in embryos. Our demonstration of this method in mouse embryos indicates its potential use as a live phenotyping toolset to study mouse mutants modeling human congenital heart defects.
Acknowledgments
Funding. National Institutes of Health (NIH) (R01EY022362, R01HL120140, U54HG006348).
Footnotes
OCIS codes: (170.4500) Optical coherence tomography; (170.2655) Functional monitoring and imaging; (170.6920) Time-resolved imaging.
References
- 1.Liu X, Tobita K, Francis RJB, Lo CW. Birth Defects Res Part C. 2013;99:93. doi: 10.1002/bdrc.21037. [DOI] [PMC free article] [PubMed] [Google Scholar]
- 2.Karunamuni G, Gu S, Peterson LM, Ma P, Wang YT, Rollins AM, Jenkins MW, Watanabe M. Front Physiol. 2014;5:351. doi: 10.3389/fphys.2014.00351. [DOI] [PMC free article] [PubMed] [Google Scholar]
- 3.Jenkins MW, Watanabe M, Rollins AM. IEEE J Sel Top Quantum Electron. 2012;18:1166. doi: 10.1109/JSTQE.2011.2166060. [DOI] [PMC free article] [PubMed] [Google Scholar]
- 4.Syed SH, Larin KV, Dickinson ME, Larina IV. J Biomed Opt. 2011;16:046004. doi: 10.1117/1.3560300. [DOI] [PMC free article] [PubMed] [Google Scholar]
- 5.Bruneau BG. Nature. 2008;451:943. doi: 10.1038/nature06801. [DOI] [PubMed] [Google Scholar]
- 6.Larina IV, Ivers S, Syed S, Dickinson ME, Larin KV. Opt Lett. 2009;34:986. doi: 10.1364/ol.34.000986. [DOI] [PMC free article] [PubMed] [Google Scholar]
- 7.Larina IV, Sudheendran N, Ghosn M, Jiang J, Cable A, Larin KV, Dickinson ME. J Biomed Opt. 2008;13:060506. doi: 10.1117/1.3046716. [DOI] [PubMed] [Google Scholar]
- 8.Jenkins MW, Rothenberg F, Roy D, Nikolski VP, Hu Z, Watanabe M, Wilson DL, Efimov IR, Rollins AM. Opt Express. 2006;14:736. doi: 10.1364/opex.14.000736. [DOI] [PubMed] [Google Scholar]
- 9.Jenkins MW, Chughtai OQ, Basavanhally AN, Watanabe M, Rollins AM. J Biomed Opt. 2007;12:030505. doi: 10.1117/1.2747208. [DOI] [PubMed] [Google Scholar]
- 10.Mariampillai A, Standish BA, Munce NR, Randall C, Liu G, Jiang JY, Cable AE, Vitkin IA, Yang VXD. Opt Express. 2007;15:1627. doi: 10.1364/oe.15.001627. [DOI] [PubMed] [Google Scholar]
- 11.Gargesha M, Jenkins MW, Wilson DL, Rollins AM. Opt Express. 2009;17:10786. doi: 10.1364/oe.17.010786. [DOI] [PMC free article] [PubMed] [Google Scholar]
- 12.Liu A, Wang R, Thornburg KL, Rugonyi S. J Biomed Opt. 2009;14:044020. doi: 10.1117/1.3184462. [DOI] [PubMed] [Google Scholar]
- 13.Happel CM, Thommes J, Thrane L, Männer J, Ortmaier T, Heimann B, Yelbuz TM. J Biomed Opt. 2011;16:096007. doi: 10.1117/1.3622491. [DOI] [PMC free article] [PubMed] [Google Scholar]
- 14.Larina IV, Larin KV, Dickinson ME, Liebling M. Biomed Opt Express. 2012;3:650. doi: 10.1364/BOE.3.000650. [DOI] [PMC free article] [PubMed] [Google Scholar]
- 15.Bhat S, Larina IV, Larin KV, Dickinson ME, Liebling M. IEEE Trans Med Imag. 2013;32:578. doi: 10.1109/TMI.2012.2231692. [DOI] [PMC free article] [PubMed] [Google Scholar]
- 16.Jenkins MW, Peterson L, Gu S, Gargesha M, Wilson DL, Watanabe M, Rollins AM. J Biomed Opt. 2010;15:066022. doi: 10.1117/1.3509382. [DOI] [PMC free article] [PubMed] [Google Scholar]
- 17.Ma Z, Liu A, Yin X, Troyer A, Thornburg K, Wang RK, Rugonyi S. Biomed Opt Express. 2010;1:798. doi: 10.1364/BOE.1.000798. [DOI] [PMC free article] [PubMed] [Google Scholar]
- 18.Peterson LM, Jenkins MW, Gu S, Barwick L, Watanabe M, Rollins AM. Biomed Opt Express. 2012;3:3022. doi: 10.1364/BOE.3.003022. [DOI] [PMC free article] [PubMed] [Google Scholar]
- 19.Liu A, Yin X, Shi L, Li P, Thornburg KL, Wang R, Rugonyi S. PLoS One. 2012;7:e40869. doi: 10.1371/journal.pone.0040869. [DOI] [PMC free article] [PubMed] [Google Scholar]
- 20.Yin X, Liu A, Thornburg KL, Wang RK, Rugonyi S. J Biomed Opt. 2012;17:96005. doi: 10.1117/1.JBO.17.9.096005. [DOI] [PMC free article] [PubMed] [Google Scholar]
- 21.Jenkins MW, Adler DC, Gargesha M, Huber R, Rothenberg F, Belding J, Watanabe M, Wilson DL, Fujimoto JG, Rollins AM. Opt Express. 2007;15:6251. doi: 10.1364/oe.15.006251. [DOI] [PMC free article] [PubMed] [Google Scholar]
- 22.Yelin R, Yelin D, Oh WY, Yun SH, Boudoux C, Vakoc BJ, Bouma BE, Tearney GJ. J Biomed Opt. 2007;12:064021. doi: 10.1117/1.2822904. [DOI] [PMC free article] [PubMed] [Google Scholar]
- 23.Huber R, Adler DC, Fujimoto JG. Opt Lett. 2006;31:2975. doi: 10.1364/ol.31.002975. [DOI] [PubMed] [Google Scholar]
- 24.Garcia M, Lopez A, III, Larin K, Larina I. In: Vascular Morphogenesis. Ribatti D, editor. Springer; 2015. pp. 151–161. [Google Scholar]
- 25.Li P, Wang RK. J Biomed Opt. 2012;17:120502. doi: 10.1117/1.JBO.17.12.120502. [DOI] [PubMed] [Google Scholar]
- 26.Jones EA, Baron MH, Fraser SE, Dickinson ME. Am J Physiol. 2004;287:H1561. doi: 10.1152/ajpheart.00081.2004. [DOI] [PubMed] [Google Scholar]


