

Summary
Aims
Traumatic brain injury (TBI) occurs when the head is impacted by an external force causing either a closed or penetrating head injury through a direct or accelerating impact. In laboratory research, most of the TBI animal models focus on a specific region to cause brain injury, but traumatic injuries in patients do not always impact the same brain regions. The aim of this study was to examine the histopathological effects of different angles of mechanical injury by manipulating the trajectory of the controlled cortical impact injury (CCI) model in adult Sprague‐Dawley rats.
Methods
The CCI model was manipulated as follows: conventional targeting of the frontal cortex, farthest right angle targeting the frontal cortex, closest right angle targeting the frontal cortex, olfactory bulb injury, and cerebellar injury. Three days after TBI, brains were harvested to analyze cortical and hippocampal cell loss, neuroinflammatory response, and neurogenesis via immunohistochemistry.
Results
Results revealed cell death in the M1 region of the cortex across all groups, and in the CA3 area from olfactory bulb injury group. This observed cell death involved upregulation of inflammation as evidenced by rampant MHCII overexpression in cortex, but largely spared Ki‐67/nestin neurogenesis in the hippocampus during this acute phase of TBI.
Conclusion
These results indicate a trajectory‐dependent injury characterized by exacerbation of inflammation and different levels of impaired cell proliferation and neurogenesis. Such multiple brain areas showing varying levels of cell death after region‐specific CCI model may closely mimic the clinical manifestations of TBI.
Keywords: Cerebellum, Cortex, Inflammation, Neurogenesis, Olfactory bulb, Trauma
Introduction
Traumatic brain injury (TBI) affects more than 1.7 million people annually in the USA 1 and a major cause of long‐term disability and death. The high financial costs necessary to facilitate the care and rehabilitation of affected individuals 1, 2 coupled with the current lack of therapies indicate that TBI represents a significant unmet medical need. TBI has become a signature of wars in Afghanistan and Iraq, with the surge in patient population consisting of soldiers coming back from the war. Blast‐induced injury is the most common type of injury among military personnel 3, 4. These people suffer physical and mental dysfunctions ranging from mild headaches, dizziness, and nausea to severe motor abnormalities and cognitive impairments, such as problems with memory, concentration, and decision making 5. The diagnosis of TBI focuses on the history and physical examination, with continuing observation of the patient for the development of possible worsening symptoms that point toward the progression of physical and cognitive deficits, development of seizures, and overall altered mental status and well‐being. TBI can be categorized depending on its level of severity and mechanism of action 6, 7, 8. Replicating in animal models, the exacerbating clinical factors involved in the severity and outcomes of TBI injuries will be critical to our understanding of the disease pathology and treatment. Most of the animal models used to detect the effects left after TBI use a single trajectory of impact toward the brain, but in reality, especially in the battlefield, an impact to the head can come from any direction or angle, consequently affecting different areas of the brain. For this reason, we hypothesized that depending on the angle of the impact and specific brain regions affected, TBI would produce varying histopathological outcomes. In this study, we manipulated the trajectories and the brain regions (cortex, olfactory bulb, and cerebellum) targeted by the controlled cortical impact (CCI) model of TBI. Endpoints involved immunohistochemical analyses combined with unbiased stereology when possible, to assess cell loss and neuroinflammation in the cortex and hippocampus, and neurogenesis in the hippocampal CA3 which has been implicated in the manifestation of cognitive impairments in many acute and chronic brain disorders, including TBI 8, 9, 10.
Material and Methods
Subjects
Experimental procedures were approved by the University of South Florida Institutional Animal Care and Use Committee (IACUC). All animals were housed under normal conditions (20°C, 50% relative humidity, and a 12‐h light/dark cycle). Necessary precautions were taken to reduce pain and suffering of animals throughout the study. All studies were performed by personnel blinded to the injury condition.
Surgeries
Ten–week‐old male Sprague‐Dawley rats (n = 40) (Harlan Laboratories, Inc., Indianapolis, IN, USA) were subjected to different TBI angular manipulations using a controlled cortical impactor (CCI) (Pittsburgh Precision Instruments, Inc., Pittsburgh, PA, USA) or sham surgery (non‐TBI or control) (n = 6). Animals were placed under deep anesthesia using 1–2% isoflurane, and it was maintained using a gas mask. All animals were fixed in a stereotaxic frame (David Kopf Instruments, Tujunga, CA, USA). After exposing the skull, the following manipulations of the CCI model were performed: conventional rat model of TBI targeting the frontal cortex (AP = 2.0 mm, ML = 2.00, DV = 1.0 mm) (n = 8), farthest right angle from midline targeting the frontal cortex (FRA) (AP = 2.0 mm, ML = 2.0 mm, DV = 1.0 mm) (n = 8), closest right angle from midline targeting the frontal cortex (CRA) (AP = 2.0 mm, ML = 2.0 mm, DV = 1.0 mm) (n = 8), olfactory bulb (OB) injury (AP = 6.2 mm, ML = 1.0 mm, DV = 1.0 mm) (n = 8), and cerebellum (AP = −11.6, ML = 0.2 mm, DV = 1 mm) (n = 8). The velocity of the impactor reached 6.0 m/s with a depth of 1.0 mm below the dura matter layer and remained in the brain for 150 milliseconds (ms). The impactor rod was angled 15° vertically to maintain a perpendicular position in reference to the tangential plane of the brain curvature at the impact surface. The impactor was adjusted to 10° for the CRA and 20° for the FRA. A linear variable displacement transducer (Macrosensors, Pennsauken, NJ, USA), which was connected to the impactor, measured the velocity and duration to verify consistency as previously described 8, 10, 11. Sham surgery consisted of animals exposed to anesthesia, craniectomy, and suturing. An electric drill was used to perform the craniectomy of about 2.5 mm radius with coordinates calculated from the bregma at −0.2 anterior and +0.2 mm lateral right. An automated thermal blanket pad and a rectal thermometer allowed maintenance of body temperature within normal limits. All animals were closely monitored postoperatively with weight and health surveillance recording to minimize any pain or stress associated with the surgery. Rats were kept hydrated at all times, and the analgesic ketoprofen was administered after TBI surgery and as needed thereafter. Pre‐ and post‐TBI, rats were fed regular rodent diet. Animals were euthanized 3 days after CCI, perfused, then brains harvested and processed for immunohistochemical analyses.
Histology
Hematoxylin and Eosin Analysis
Hematoxylin and eosin (H&E) staining was performed to confirm the core impact injury of the different angles of TBI. Coronal brain sections (30 μm thick) covering the M1 region of the cortex and the CA3 region of the hippocampus were selected to reveal secondary cell loss. Starting at coordinates AP 6.2 mm and ending at AP‐3.8 mm from bregma, olfactory bulb, and coronal brain sections covering the dorsal hippocampus were selected. Series of 6 sections per rat were processed for staining. Cells presenting with nuclear and cytoplasmic staining (H&E) were manually counted in the M1 and CA3 neurons. CA3 cell counting spanned the whole CA3 area, starting from the end of hilar neurons to the beginning of curvature of the CA2 region in both the ipsilateral and contralateral side. Sections were viewed with an Olympus BX60 microscope and MBF CX 9000 camera. All data are represented as mean values ±SEM, with statistical significance set at P < 0.05.
Immunohistochemistry
Under deep anesthesia, rats were sacrificed 3 days after TBI surgery and perfused through the ascending aorta with 200 ml of ice‐cold phosphate‐buffered saline (PBS), followed by 200 ml of 4% paraformaldehyde (PFA) in PBS. Brains were removed and postfixed in the same fixative for 24 h followed by 30% sucrose in phosphate buffer (PB) for 1 week. Coronal sectioning was carried out at a thickness of 30 μm by cryostat. H&E staining was performed on every sixth coronal section spanning the dorsal hippocampus. Staining for major histocompatibility complex II (OX6) was performed on every sixth coronal section throughout the entire olfactory bulb, M1, and dorsal hippocampus. Sixteen free‐floating coronal sections (30 μm) were incubated in 0.3% hydrogen peroxide (H2O2) solution followed by 1 h of incubation in blocking solution (0.1 M phosphate‐buffered saline (PBS) supplemented with 3% normal goat serum and 0.2% Triton X‐100). Sections were then incubated overnight with OX6 (major histocompatibility complex or MHC class II; 1:750 BD) antibody markers in PBS supplemented with 3% normal goat serum and 0.1% Triton X‐100. Sections were then washed and biotinylated secondary antibody (1:200; Vector Laboratories, Burlingame, CA, USA) in PBS supplemented with 3% normal goat serum, and 0.1% Triton X‐100 was applied for 1 h. Next, the sections were incubated for 60 min in avidin–biotin substrate (ABC kit; Vector Laboratories). All sections were then incubated for 1 minute in 3,30‐diaminobenzidine (DAB) solution (Vector Laboratories). Sections were then mounted onto glass slides, dehydrated in ascending ethanol and xylene, and cover‐slipped using mounting medium.
Immunofluorescence Staining
Three coronal sections of every sixth coronal section spanning the olfactory bulb and M1 and dorsal hippocampus were processed for neurogenesis analyses from each trajectory groups. There was only sporadic Ki67 or nestin‐positive cells detected in the M1 region of the cortex across all groups; therefore, the analyses focused only on the CA3 region of the hippocampus for this part of the study. Three free‐floating coronal sections (30 μm) were incubated in 0.3% hydrogen peroxide (H2O2) solution followed by 1 h of incubation in blocking solution (0.1 M phosphate‐buffered saline (PBS) supplemented with 3% normal goat serum and 0.2% Triton X‐100). Sections were then incubated overnight with nestin (mouse monoclonal to nestinI; 1:100 and Ki67; 1:100 abcam) antibody markers in PBS supplemented with 3% normal goat serum and 0.1% Triton X‐100. Sections were then washed and incubated in secondary antibody (goat anti‐rabbit igG Alexa Fluor 488; 1:500 and goat anti mouse igG Alexa Fluor 594; 1:500; Invitrogen, Carlsbad, CA, USA) in PBS supplemented with 3% normal goat serum, and 0.1% Triton X‐100 was applied for 1 h. Next, the sections were incubated for 60 min with Hoescht (1:300) and washed 3 times with PBS. Sections were then mounted onto glass slides with fluoro mount and cover‐slipped.
Stereology and Image J Analysis
Unbiased stereology was performed on brain sections immunostained with H&E and OX6. Sets of 1/6 section, about 240 μm apart, were taken from the brain spanning AP 6.2 mm to AP – 3.8 mm in all rats. Positive stains were analyzed with a Nikon Eclipse 600 microscope and quantified using Stereo Investigator software, version 10 (MicroBrightField, Colchester, VT, USA). The estimated volume of H&E and OX6‐positive cells were examined using the Cavalieri estimator probe of the unbiased stereological cell technique revealing the volume of H&E and OX6 in the olfactory bulb, cortex, hippocampus, and cerebellum. The sampling was optimized to count at least 300 cells per animal with error coefficients less than 0.07. Each counting frame (100 × 100 μm for H&E and OX6) was placed at an intersection of the lines forming a virtual grid (175 × 175 μm), which was randomly generated and placed by the software within the outlined structure. Section thickness was measured in all counting sites 9 . Fluorescent imaging was quantified using Zeiss microscope and ImageJ to determine the percent fluorescent area. The level of fluorescent was determined using the integrated density, and mean gray value for a 5 random regions per tissue section and the corrected total fluorescence (CTCF) was calculated using formula CTCF = integrated density – (area of selected cell × mean fluorescence of background readings).
Statistics
Contralateral and ipsilateral corresponding brain areas were used as raw data providing 2 sets of data per injury condition (TBI vs. sham surgery); therefore, one‐way analysis of variance (ANOVA) was used for group comparisons, followed by subsequent pairwise comparisons via Bonferonni test. All data are represented as mean values with ±SEM. Statistical significance was set at P < 0.05 for all analyses.
Results
Histopathological Analysis in the M1 Region of the Cortex
ANOVA revealed significant injury effect on cell loss in the ipsilateral side of the M1 region of the cortex (F 5,34 = 68.08, P < 0.0001) (Figure 1). The ipsilateral side of the conventional, OB, cerebellum, FRA, and CRA models of TBI showed significant cell loss when compared to control at 3 days after TBI (Figure 1) (P's < 0.05), but when all the ipsilateral sides of the different groups were compared among each other, there were no other significant differences between them (P's > 0.05). Interestingly, we also detected significant difference in cell loss in the contralateral side of the M1 region of the cortex (F 5,35 = 9.206, P < 0.0001). The contralateral side of the conventional, OB, cerebellum, FRA, and CRA groups showed significant cell loss compared to the control (P's<0.05), but there were no other significant differences between groups when all the contralateral sides were compared among each other (P's > 0.05). The percent cell loss in M1 (ipsilateral cell loss/contralateral side × 100) showed overall significant injury effect (F 4,32 = 5.622), with the conventional and the FRA groups displaying significantly more cell loss when compared to the cerebellum (P < 0.05), but pairwise comparisons among the rest of the TBI groups did not show any significant effects (P's > 0.05). Overall, the data demonstrate that even though both sides had significant cell loss in the M1 region, the ipsilateral side displayed more cell death than the contralateral side.
Figure 1.
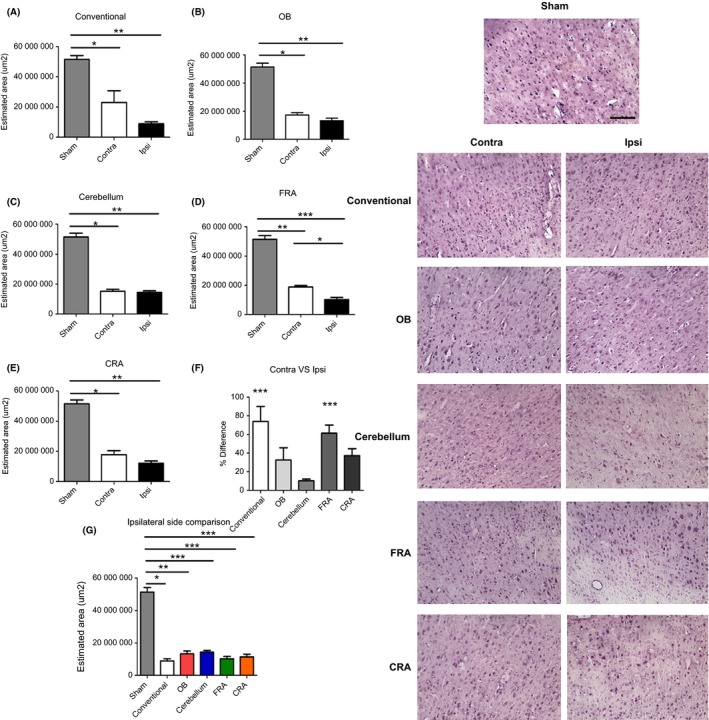
Variations of the CCI trajectory produce consistent cell loss in the M1 region of the cortex. Data confirm typical cell loss in the M1 cortical region in the conventional TBI group (A) as determined by H&E‐positive histological staining and Cavalieri method of unbiased stereology. Interestingly, we also detected significant cell death in M1 region of the animals that received OB (B), cerebellum (C), FRA (D), and CRA (E) types of injury. All the groups displayed comparable cortical damage to the conventional TBI group. The contralateral side of the OB, cerebellum, and CRA demonstrates significant cell loss that is also analogous to the conventional group. Interestingly, there was a significant effect in the ordinary and the FRA when contralateral versus ipsilateral sides where compared (F). When all the groups were compared (G), there was also a notable significant cell loss as compared to the non‐TBI group. Asterisks (*) denotes significance. Right panel: H&E images from the contralateral and ipsilateral sides of the M1 region of the cortex. Scale bar = 5 μm.
H&E Quantification in the CA3 Region of the Hippocampus
Next, we examined the cell loss in the ipsilateral side of the CA3 area of the hippocampus. ANOVA revealed no significant injury effect at 3 days post‐TBI on CA3 cell loss in the ipsilateral side (F 5,27 = 0.9058) (Figure 2). There was also no significant injury effect on the CA3 cell loss in the contralateral side (F 5,27 = 0.8726). Additionally, when the percent difference from Ipsilateral side to contralateral side was compared ANOVA did not detect any significant injury effect (F 5,27 = 0.5327).
Figure 2.
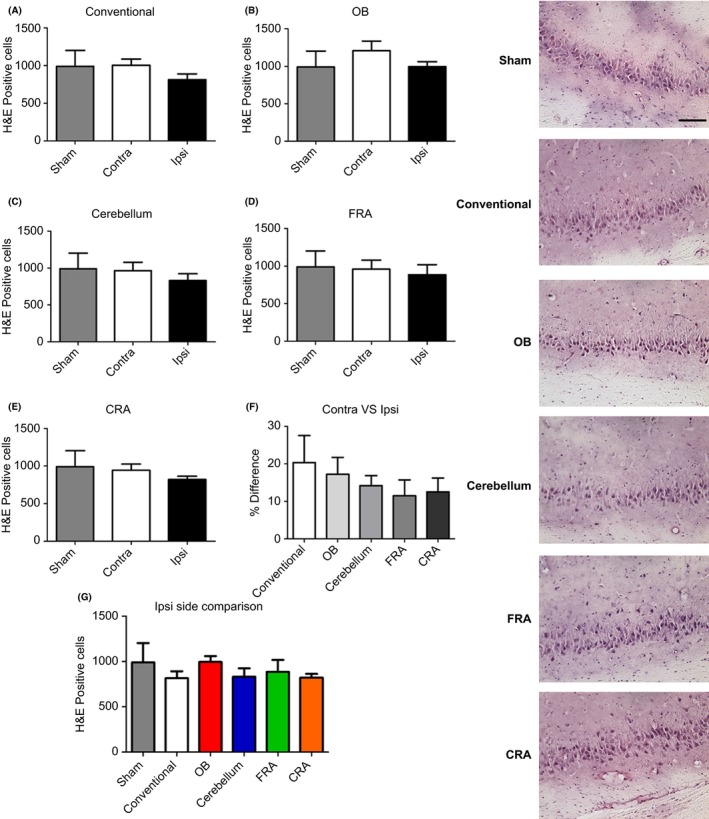
Variations of the CCI trajectory fail to yield cell loss in the CA3 region of the hippocampus. Further examination of the H&E‐positive expression in the hippocampus revealed no significant cell loss across all of the different types of impact trajectories (A–E). Moreover, there was no apparent difference when the percent difference of contralateral versus ipsilateral (F) and the ipsilateral sides (G) was compared. Right panel: H&E images from the CA3 of the hippocampus. Scale bar = 5 μm.
Activated Microglial Expression in the M1 Area of the Cortex
Using Ox‐6 marker to detect activated microglia, ANOVA revealed significant injury effect on microglial expression in the ipsilateral side of the M1 region (F 5,22 = 30.69, P < 0.0001) (Figure 3). Pairwise comparisons revealed that the conventional, FRA, and CRA models of TBI displayed a significant increase in microglial expression when compared to the control (P's < 0.05). The ipsilateral side of the OB and cerebellum showed a significant decrease when compared to the conventional model of TBI (P's < 0.05). The ipsilateral side of the FRA and CRA was significantly increased when compared to the OB and also when compared to the cerebellum (P's < 0.05). Finally, the ipsilateral side of the FRA was significantly decreased when compared to the CRA group (P's < 0.05). Interestingly, a significant injury effect was also detected in the contralateral side determined by ANOVA (F 5,22 = 4.923, P = 0.0036). The pairwise comparison detected that the contralateral side of the control was significantly decreased when compared to the conventional group (P < 0.05). Moreover, the conventional group was significantly increased when compared to the CRA group (P < 0.05). Pairwise comparisons among the rest of the TBI groups did not show any significant effects (P's > 0.05). When the percent difference of OX‐6 expression in the contralateral side was compared to the ipsilateral side, there was a significant injury effect (F 4,19 = 15.04, P < 0.0001) as determined by ANOVA. The pairwise comparison detected a significant increase in the conventional group versus the OB. The CRA was significantly higher than the conventional group (P's < 0.05). Also, there was a significant increase in OX‐6 expression in the FRA and CRA groups when compared to the OB group (P's < 0.05). Finally, the OX‐6 expression in the cerebellum was significantly decreased when compared to the FRA and CRA groups (P's < 0.05). Even though both contralateral side and ipsilateral side displayed positive expression of microglia, the ipsilateral side displayed a higher OX‐6 expression than the contralateral side (P's < 0.05).
Figure 3.
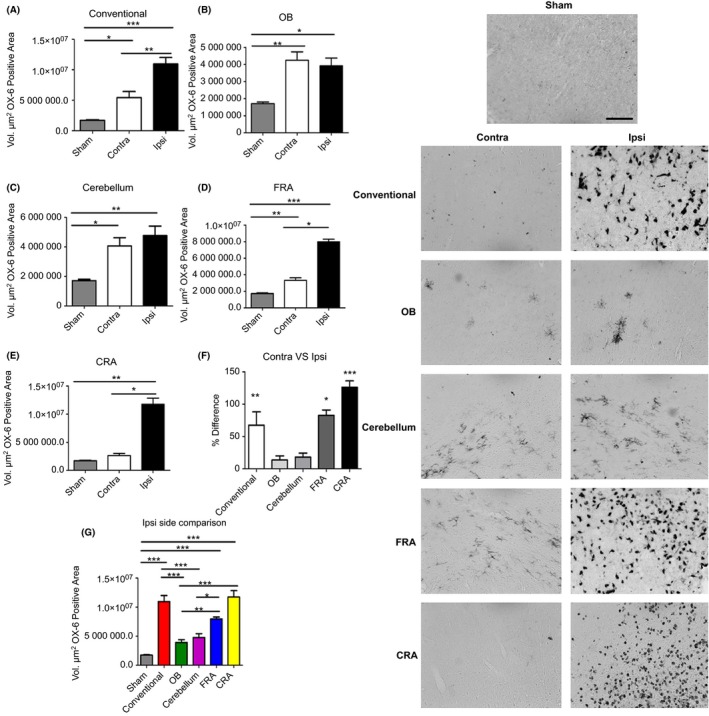
Variations of the CCI trajectory activate microglial cells in the M1 region of the cortex for all CCI trajectories. There is an increased expression of the inflammatory marker OX‐6 in the M1 region of the cortex that accompanied the decrease in H&E‐positive cells in this cortical region after conventional (A), OB (B), cerebellum (C) FRA (D), and CRA (E) TBI groups, suggesting a critical role for neuroinflammation in the observed cell death. There was significant difference in the conventional, FRA, and CRA when percent difference of contralateral versus ipsilateral (F) and the ipsilateral sides (G) of all the groups was compared. Asterisk (*) denotes significance at P < 0.05. Right panel: Images of OX‐6‐positive staining in the M1 region of the cortex. Scale bar = 5 μm.
Active Microglia Expression in CA3 Region of the Hippocampus
There was a significant Ox‐6 positive effect seen in the CA3 region of the hippocampus in the ipsilateral side as determined by ANOVA (F 5,27 = 3.590, P = 0.0128) (Figure 4). Interestingly, the pairwise comparison showed a significant increase in the ipsilateral side of the OB when compared to the ipsilateral side of the conventional group (P < 0.05). Additionally, the OB also showed a significant increase in OX‐6 expression when compared to the ipsilateral side of the CRA (P's < 0.05). Subsequently, we examine the OX‐6 expression in the contralateral side and ANOVA revealed no significant effect at 3 days post‐TBI on CA3 region of the hippocampus (F 5,27 = 0.8959). Furthermore, we analyzed the percent difference of the contralateral side versus the ipsilateral side and notice that there was a significant effect detected (F 4,22 = 8.967, P = 0.0002) as determined by ANOVA. Pairwise comparisons demonstrated that the percent difference in OX‐6 expression of the OB impact trajectory group was significantly increased when compared to the conventional, cerebellum, FRA, and CRA groups (P's < 0.05). Pairwise comparisons among the rest of the TBI groups did not show any significant differences in OX‐6 expression (P's > 0.05).
Figure 4.
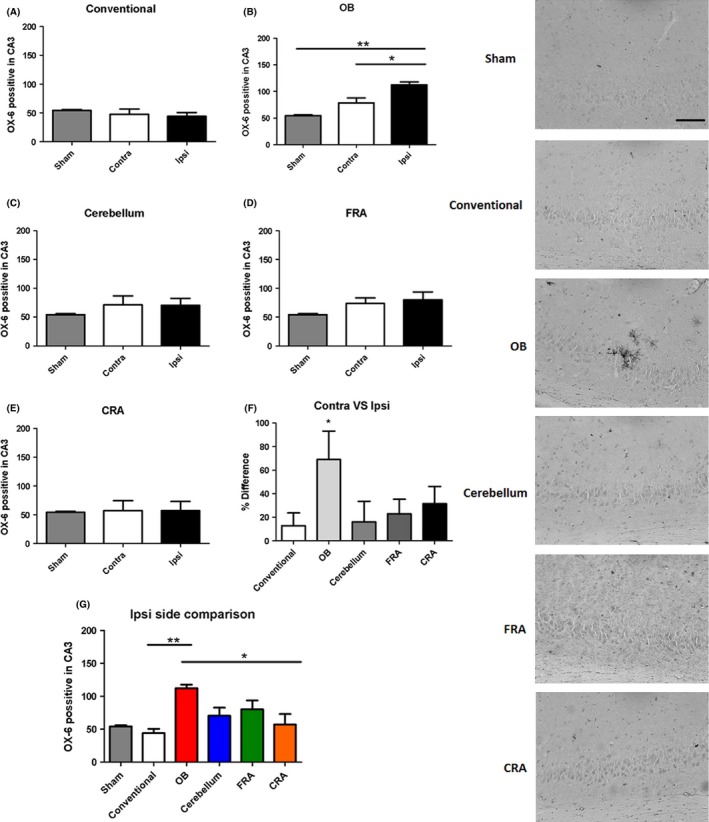
Controlled impact injury to the olfactory bulb activates microglial cells in the CA3 region of the hippocampus. Increase in expression of the inflammatory marker OX‐6 was detected in the CA3 region of the hippocampus in the OB group when compared to the conventional group (A,B), but no significant inflammatory response was detected in all the other groups (C–E), suggesting a critical role for neuroinflammation in the OB 3 days post‐TBI. When the percent difference between contralateral side versus ipsilateral side (F) was compared, there was an increase in expression in the OB group as compared to all the other groups. The same was seen when the ipsilateral side of all the groups were compared (G). Asterisk (*) denotes significance at P < 0.05. Right Panel: Images of OX‐6‐positive expression in the CA3 region of the hippocampus. Scale bar = 5 μm.
Ki67/Nestin Expression in the CA3 Region of the Hippocampus
A significant injury effect was detected in the ipsilateral side of the CA3 region of the hippocampus when the fluorescent intensity of neurogenic marker Ki‐67 was analyzed (F 5,128 = 9.504, P < 0.0001) as determined by ANOVA (Figure 5). Pairwise comparisons determined that there was a significant decrease in Ki‐67 expression in the ipsilateral side of the conventional, OB, cerebellum, FRA, and CRA groups compared to the control group (P's < 0.05). However, pairwise comparisons revealed that there was a significant increase in Ki‐67 expression in the FRA when compared to the OB group (P < 0.05). ANOVA analysis also revealed there was a significant injury effect on Ki‐67 expression when we examined the contralateral sides (F 5,125 = 10.14, P < 0.0001). Pairwise comparisons of the contralateral side demonstrated that there was a significant decrease in the Ki‐67 expression in the conventional, OB, cerebellum, FRA, and CRA groups when compared to the control group (P's < 0.05). Pairwise comparisons among the rest of the TBI groups did not show any significant differences in Ki‐67 expression (P's > 0.05). Subsequently, we decided to compare the percent difference of the contralateral side versus the ipsilateral side, but there was no significant injury effect on Ki‐67 expression detected (F 4,114 = 1.969).
Figure 5.
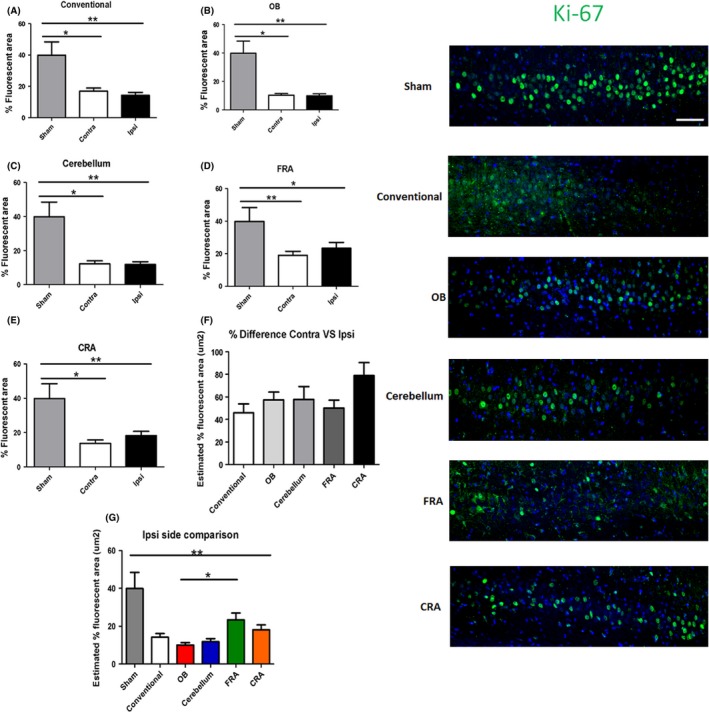
Variations of the CCI trajectory impair cell proliferation in the CA3 region of the hippocampus. Fluorescence intensity measurement detected a significant decrease in neurogenic marker Ki‐67 in the conventional (A), OB (B), cerebellum (C), FRA (D), and CRA (E) groups compared to the non‐TBI control group. Although no significant effect was detected when the percent difference of contralateral versus ipsilateral sides was compared (F), the same effect of impaired cell proliferation was seen when all the ipsilateral sides were compared (G). Asterisk (*) denotes significance at P < 0.05. Right panel: Ki‐67‐positive fluorescent images in the CA3 region of the hippocampus. DAPI was used as counterstaining (blue). Scale bar = 5 μm.
When nestin immunofluorescent staining was analyzed in the CA3 region of the brain, a significant injury effect was detected in the ipsilateral side of the brain (F 5,127 = 7.896, P < 0.0001) as determined by ANOVA (Figure 6). Pairwise comparisons determined that nestin expression was significantly increased in the FRA when compared to the OB, the cerebellum, and, CRA groups (P's < 0.05). There were no other significant differences detected between the groups (P's > 0.05). Analyses of the contralateral side revealed no significant injury effect across groups (F 5,125 = 1.760) as determined by ANOVA. Finally, the percent difference between contralateral side versus ipsilateral sides was compared across groups which also revealed no significant injury effect (F 4,114 = 0.2916).
Figure 6.
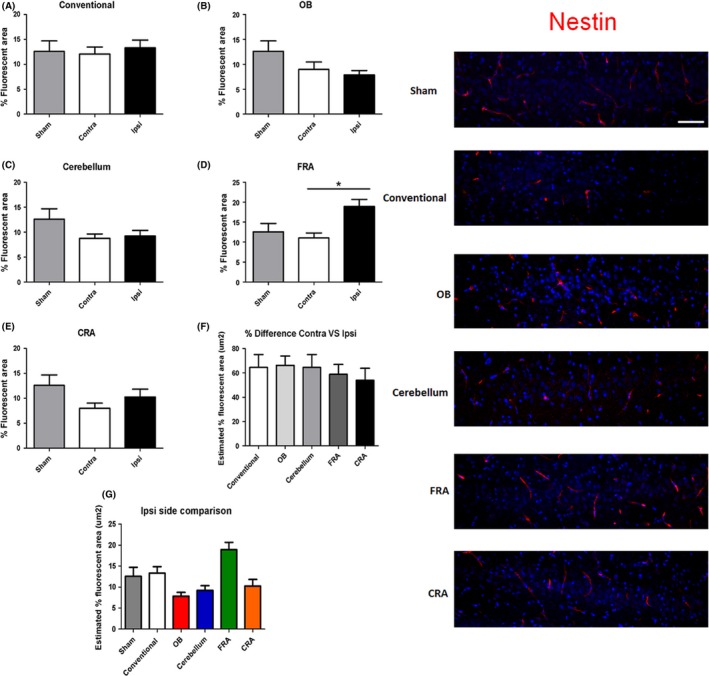
The ipsilateral side of the FRA group shows nestin expression 3‐days post‐TBI. Positive nestin immunofluorescent staining was detected in the ipsilateral side of the brain of the FRA (D) group when compared to the OB (B), the cerebellum (C), and CRA (E) groups. There were no other significant effects detected (A, D, F, and G). Asterisk (*) denotes significance at P < 0.05. Right panel: Nestin‐positive fluorescent images in the CA3 region of the hippocampus. DAPI was used as counterstaining (blue). Scale bar = 5 μm.
Discussion
This study recognized that TBI in the clinic presents with injuries to different parts of the brain. Our laboratory results showed that manipulating the trajectories of the CCI model of TBI led to varying levels of cell death, microglial activation, and neurogenesis. Cell death in the M1 region of the cortex was observed in all groups, but hippocampal cell death was only detected in OB‐exposed rats. This cell death involved upregulation of inflammation and impairment in neurogenesis at such early time point post‐TBI (3 days). Interestingly, nestin‐positive immature cells in the M1 cortical region appear to be spared during this acute TBI, which may be a target for regenerative therapy. Further studies are warranted to assess long‐term secondary cell death effects of specific impacted brain trajectories to provide a better guidance of the management and treatment of TBI patients. Additionally, post‐TBI symptoms include cognitive and motor alterations 11. Therefore, future studies should also evaluate behavioral consequences following different impact trajectories.
Blast injury, which is a clinically relevant TBI model 12, 13, 14, 15, is technically challenging to recreate in animal models; thus, most TBI approaches focus on a specific type of injury, that is, targeting the cortex 8, 16, 17, 18, 19, 20. The present study offers an alternative model in capturing the clinical scenario of varying injuries in TBI. Manipulating the CCI trajectories allows us to mimic the brain region‐specific cell loss, but also mechanisms of cell death, such as increased inflammation and impaired neurogenesis 21, 22, 23, 24, 25. There are several experimental models employed to replicate the clinical pathology of TBI. One of the original models of TBI involves the weight drop technique 26, 27. Over the last decade, the CCI model and the fluid percussion injury have been the two widely used TBI models in the laboratory 15, 28, 29. Although large animal models are a useful tool in replicating the morphological and different pathological stages of TBI (albeit white matter injury) 30, 31, they have been seldom used largely due to the expensive cost and extensive manpower required for post‐operative monitoring 15, 32, 33. However, for translating novel therapies from the laboratory to the clinic, there has been an increased demand for large animal models of TBI 34, 35. Equally important for TBI animal modeling, the wars in the Middle East have necessitated the development of TBI models to replicate combat scenarios. The penetrating ballistic‐like brain injury 26, 27, 36, 37 and shock wave injury models 38, 39 have been established to mimic the warfare‐associated TBI symptoms 40, 41. The selection of the ideal TBI model is crucial in the investigation of novel therapies. Rigorous testing is required to validate any positive effects these therapies might have toward treating TBI, and in many occasions, the use of several models, including large animals, is needed for optimal results. As the majority of TBI events observed in humans are unique, the model used to replicate this traumatic event must also mirror these distinctive effects. Using a varying CCI model, where the angle of impact is manipulated yet controlled, allows for the validation of potential novel therapies due to the fact that it accounts for the variability that is inherent in cases of TBI occurring in humans.
A major finding here was the increase in the expression of OX‐6 marker for active microglia at the acute TBI phase. We attempted to establish the early inflammatory response after TBI. This inflammatory effect was significant in all of the groups regardless of the angle of impact. We also noted a significant effect in the contralateral side of the different trajectories of CCI. Interestingly, the OB group resulted in the highest level of cortical OX‐6‐positive expression, with a positive correlation between the increase in cell loss as evident with H&E staining and the increase in OX‐6‐positive expression in the same region of the cortex. Such cell loss and inflammation in this might be due to anatomical connections, in that the OB projects to the ventral part of the lateral entorhinal cortex, and eventually sending projections to the CA1 field of the ventral hippocampus and feeding to three different areas: the main olfactory bulb, the anterior olfactory nucleus, and the primary olfactory cortex 42, 43, 44. These anatomical pathways may be candidate therapeutic regions for abrogating the inflammatory response to attenuate the cell loss following TBI 45, 46, 47, 48, 49, 50.
TBI has been associated with olfactory dysfunction in humans 51, 52. Olfactory alterations can affect the quality of life of patients and are an early indicator of head trauma 51, 52. Post‐TBI olfactory dysfunction has been associated with neuropsychiatric dysfunction and cognitive alterations 52. However, the mechanisms underlying post‐TBI olfactory system pathology and its relationship to neuropsychiatric and cognitive symptoms remain to be understood. We acknowledge that the direct injury to OB as performed in this work is nearly impossible in humans. Consequences of the TBI observed in humans are difficult to replicate using rodent models because of differences in the olfactory system anatomy and cranial structure 51. Nonetheless, our results provide insights about the complex pathology and variable symptomatology of TBI and their relationship with the direction of the impact.
An equally important observation here is the altered proliferation and differentiation of endogenous cells after varying CCI trajectories. Newly formed cells (e.g., neuroblasts) are known to migrate, to a modest extent, to the injured peri‐infarct cortex from the neurogenic subventricular zone 53, 54. Similarly, cell proliferation increases in the other neurogenic niche of the hippocampal dentate gyrus, and these immature cells may rescue the hippocampal cell death after experimental TBI 55, 56. In the present study, only sporadic Ki‐67 and nestin immunostained cells were detected in the MI cortical region, indicating lack of neurogenic response in the cortex following TBI in all CCI trajectories. The CA3 region of the hippocampus, however, revealed significant decrements in cell proliferation, while neural precursor cell differentiation remained unaltered. Using Ki67 as a marker for cell proliferation, we detected significant decrements in newly formed cells in the CA3 region of the hippocampus in all the groups 3 days after TBI compared to the control. In contrast, immunostaining with the immature neural precursor cell marker nestin revealed no detectable significant alterations after TBI, with the FRA group even showing a significant increase in nestin expression compared to control. This overall impairment in cell proliferation, but generally intact capacity for immature neural cell differentiation may be due to the inflammatory response overshadowing the neurogenic response at such acute time point post‐TBI. Of note, previous reports have documented that integration of newly formed cells does not occur until 5 days postinjury 57 and that a neurogenic effect with BrdU staining is recognized only at 1 month post‐TBI 58. Moreover, in a mouse model of CCI, dying cells were seen 6 h after injury, peaked at 24 h, and returned to control levels at 14 days 59. Our varying CCI trajectory model was conducted in the acute phase of 3 days post‐TBI, which likely limited our detection of significant alterations in neurogenesis in the hippocampal CA3 region.
In summary, this study showed varying histopathological effects after different CCI angles at 3 days post‐TBI. We demonstrated that the initial cell death response in all the different trajectories involved the inflammatory response accompanying cell loss that was prominent in the M1 region of the cortex. However, while inflammation accompanied cortical cell death, inflammation and cell death did not extend yet to the CA3 region of the hippocampus at this acute TBI phase. Interestingly, CCI damage to the OB already resulted in early elevation of microglial activation in the hippocampus, implicating OB's key role in TBI‐induced inflammation. At the same acute TBI time point, a neurogenic response was nondetectable in the cortex, whereas cell proliferation was impaired but neural differentiation was unaltered in the CA3 region of the hippocampus, which would suggest that neurogenesis is partly intact as the TBI secondary cell death progresses from the primary damaged cortical site toward the hippocampus. Additional studies are warranted to determine the extent of the secondary cell death damage in chronic TBI following varying CCI trajectories, as well as to gauge the behavioral effects associated with different angles of mechanical injury. Successful translation of novel therapies from the laboratory to the clinic requires the use of relevant animal models. In the battlefield, for example, an impact to the head can come from any direction. In this study, we have shown that the direction of the impact to the head affects the resulting brain damage. Varying the trajectory of the CCI model of TBI could provide insights about the variable clinical manifestations of TBI. Future studies should consider the effect of the direction of the impact on the TBI pathology, and in the development of new models and research instruments. We also acknowledge that a blast injury may replicate many of the pathological symptoms manifested by combination of trajectory injuries, but also recognize the logistical challenge of pursuing such model, which has relegated the use blast injury model of TBI to a few research teams.
Conclusion
Altogether, these results suggest that varying the trajectory of the CCI model of TBI resulted in different levels and extent of brain damage. Manipulating the angle of impact to the cortical region appears to consistently produce similar core and peri‐impact damage to M1 and CA3, respectively, at least for the short 3‐day period following TBI. Increased OX‐6 expression in the M1 cortical region in all CCI trajectories, and in the CA3, area of OB‐injured brain indicates a pivotal role of inflammatory response at this acute phase of TBI. Equally important is the observation of impaired cell proliferation, but intact neural differentiation in the CA3 region of the hippocampus, suggesting partly functional neurogenesis during TBI secondary cell death.
Conflict of Interest
The authors declare no conflict of interest.
Acknowledgment
Financial support for this study was provided by the Department of Defense W81XWH‐11‐1‐0634, the University of South Florida Signature Interdisciplinary Program in Neuroscience funds, the University of South Florida and Veterans Administration Reintegration Funds, University of South Florida Byrd Alzheimer's Research Grant, and the University of South Florida Neuroscience Collaborative Program. CVB is supported by National Institutes of Health, National Institute of Neurological Disorders and Stroke 1R01NS071956‐01, and James and Esther King Foundation for Biomedical Research Program.
The first three authors contributed equally to this work.
References
- 1. Coronado VG, Xu L, Basavaraju SV, et al. Surveillance for traumatic brain injury‐related deaths–United States, 1997–2007. MMWR Surveill Summ 2011;60:1–32. [PubMed] [Google Scholar]
- 2. Corso P, Finkelstein E, Miller T, Fiebelkorn I, Zaloshnja E. Incidence and lifetime costs of injuries in the United States. Inj Prev 2006;12:212–218. [DOI] [PMC free article] [PubMed] [Google Scholar]
- 3. Taber KH, Warden DL, Hurley RA. Blast‐related traumatic brain injury: What is known? J Neuropychiatry Clin Neurosci 2006;18:141–145. [DOI] [PubMed] [Google Scholar]
- 4. Elder GA, Mitsis EM, Ahlers ST, Cristian A. Blast‐induced mild traumatic brain injury. Psychiatr Clin North Am 2010;33:757–781. [DOI] [PubMed] [Google Scholar]
- 5. Coronado VG, McGuire LC, Sarmiento K, et al. Trends in traumatic brain injury in the U.S. and the public health response: 1995‐2009. J Safety Res 2012;43:299–307. [DOI] [PubMed] [Google Scholar]
- 6. Rimel RW, Giordani B, Barth JT, Jane JA. Moderate head injury: Completing the clinical spectrum of brain trauma. Neurosurgery 1982;11:344–351. [DOI] [PubMed] [Google Scholar]
- 7. Williams DH, Levin HS, Eisenberg HM. Mild head injury classification. Neurosurgery 1990;27:422–428. [DOI] [PubMed] [Google Scholar]
- 8. Yu S, Kaneko Y, Bae E, et al. Severity of controlled cortical impact traumatic brain injury in rats and mice dictates degree of behavioral deficits. Brain Res 2009;1287:157–163. [DOI] [PubMed] [Google Scholar]
- 9. Zhang Y, Chopp M, Meng Y, et al. Cerebrolysin improves cognitive performance in rats after mild traumatic brain injury. J Neurosurg 2015;122:843–855. [DOI] [PubMed] [Google Scholar]
- 10. Tajiri N, Kellogg SL, Shimizu T, Arendash GW, Borlongan CV. Traumatic brain injury precipitates cognitive impairment and extracellular Abeta aggregation in Alzheimer's disease transgenic mice. PLoS ONE 2013;8:e78851. [DOI] [PMC free article] [PubMed] [Google Scholar]
- 11. Tajiri N, Acosta SA, Shahaduzzaman M, et al. Intravenous transplants of human adipose‐derived stem cell protect the brain from traumatic brain injury‐induced neurodegeneration and motor and cognitive impairments: Cell graft biodistribution and soluble factors in young and aged rats. J Neurosci 2014;34:313–326. [DOI] [PMC free article] [PubMed] [Google Scholar]
- 12. Cernak I. Animal models of head trauma. NeuroRx 2005;2005:410–422. [DOI] [PMC free article] [PubMed] [Google Scholar]
- 13. Glover LE, Tajiri N, Lau T, Kaneko Y, van Loveren H, Borlongan CV. Immediate, but not delayed, microsurgical skull reconstruction exacerbates brain damage in experimental traumatic brain injury model. PLoS ONE 2012;7:e33646. [DOI] [PMC free article] [PubMed] [Google Scholar]
- 14. Turner RC, Naser ZJ, Logsdon AF, et al. Modeling clinically relevant blast parameters based on scaling principles produces functional & histological deficits in rats. Exp Neurol 2013;248:520–529. [DOI] [PubMed] [Google Scholar]
- 15. Xiong Y, Mahmood A, Chopp M. Animal models of traumatic brain injury. Nat Rev Neurosci 2013;14:128–142. [DOI] [PMC free article] [PubMed] [Google Scholar]
- 16. Laurer HL, McIntosh TK. Experimental models of brain trauma. Curr Opin Neurol 1999;12:715–721. [DOI] [PubMed] [Google Scholar]
- 17. Saatman KE, Duhaime AC, Bullock R, Maas AI, Valadka A, Manley GT. Classification of traumatic brain injury for targeted therapies. J Neurotrauma 2008;25:719–738. [DOI] [PMC free article] [PubMed] [Google Scholar]
- 18. Lulic D, Burns J, Bae EC, van Loveren H, Borlongan CV. A review of laboratory and clinical data supporting the safety and efficacy of cyclosporin A in traumatic brain injury. Neurosurgery 2011;68:1172–1185. [DOI] [PubMed] [Google Scholar]
- 19. Nichols J, Perez R, Wu C, Adelson D, Anderson T. Traumatic brain injury induces rapid enhancement of cortical excitability in juvenile rats. CNS Neurosci Ther 2015;21:193–203. [DOI] [PMC free article] [PubMed] [Google Scholar]
- 20. Thais ME, Cavallazzi G, Schwarzbold ML, et al. Plasma levels of oxidative stress biomarkers and long‐term cognitive performance after severe head injury. CNS Neurosci Ther 2012;18:606–608. [DOI] [PMC free article] [PubMed] [Google Scholar]
- 21. Dalgard CL, Cole JT, Kean WS, et al. The cytokine temporal profile in rat cortex after controlled cortical impact. Front Mol Neurosci 2012;5:6. [DOI] [PMC free article] [PubMed] [Google Scholar]
- 22. Kim Y, Kim N, Yenari MA. Mechanisms and potential therapeutic applications of microglial activation after brain injury. CNS Neurosci Ther 2015;21:309–319. [DOI] [PMC free article] [PubMed] [Google Scholar]
- 23. Zanier E, Pischiutta F, Villa P, et al. Six‐month ischemic mice show sensorimotor and cognitive deficits associated with brain atrophy and axonal disorganization. CNS Neurosci Ther 2013;19:695–704. [DOI] [PMC free article] [PubMed] [Google Scholar]
- 24. Lagraoui M, Latoche JR, Cartwright NG, Sukumar G, Dalgard CL, Schaefer BC. Controlled cortical impact and craniotomy induce strikingly similar profiles of inflammatory gene expression, but with distinct kinetics. Front Neurol 2012;3:155. [DOI] [PMC free article] [PubMed] [Google Scholar]
- 25. Acosta SA, Diamond DM, Wolfe S, et al. Influence of post‐traumatic stress disorder on neuroinflammation and cell proliferation in a rat model of traumatic brain injury. PLoS ONE 2013;8:e81585. [DOI] [PMC free article] [PubMed] [Google Scholar]
- 26. Marmarou A, Foda MA, van den Brink W, Campbell J, Kita H, Demetriadou K. A new model of diffuse brain injury in rats. Part I: Pathophysiology and biomechanics. J Neurosurg 1994;80:291–300. [DOI] [PubMed] [Google Scholar]
- 27. Shear DA, Lu XC, Pedersen R, et al. Severity profile of penetrating ballistic‐like brain injury on neurofunctional outcome, blood‐brain barrier permeability, and brain edema formation. J Neurotrauma 2011;28:2185–2195. [DOI] [PubMed] [Google Scholar]
- 28. Dixon CE, Lighthall JW, Anderson TE. Physiologic, histopathologic, and cineradiographic characterization of a new fluid‐percussion model of experimental brain injury in the rat. J Neurotrauma 1988;5:91–104. [DOI] [PubMed] [Google Scholar]
- 29. Carbonell WS, Maris DO, McCall T, Grady MS. Adaptation of the fluid percussion injury model to the mouse. J Neurotrauma 1998;15:217–229. [DOI] [PubMed] [Google Scholar]
- 30. Manley GT, Rosenthal G, Lam M, et al. Controlled cortical impact in swine: Pathophysiology and biomechanics. J Neurotrauma 2006;23:128–139. [DOI] [PubMed] [Google Scholar]
- 31. Friess SH, Ichord RN, Ralston J, et al. Repeated traumatic brain injury affects composite cognitive function in piglets. J Neurotrauma 2009;26:1111–1121. [DOI] [PMC free article] [PubMed] [Google Scholar]
- 32. Duhaime AC. Large animal models of traumatic injury to the immature brain. Dev Neurosci 2006;28:380–387. [DOI] [PubMed] [Google Scholar]
- 33. Namjoshi DR, Good C, Cheng WH, et al. Towards clinical management of traumatic brain injury: A review of models and mechanisms from a biomechanical perspective. Dis Model Mech 2013;6:1325–1338. [DOI] [PMC free article] [PubMed] [Google Scholar]
- 34. Statler KD, Jenkins LW, Dixon CE, Clark RS, Marion DW, Kochanek PM. The simple model versus the super model: Translating experimental traumatic brain injury research to the bedside. J Neurotrauma 2001;18:1195–1206. [DOI] [PubMed] [Google Scholar]
- 35. Morales DM, Marklund N, Lebold D, et al. Experimental models of traumatic brain injury: Do we really need to build a better mousetrap? Neuroscience 2005;136:971–989. [DOI] [PubMed] [Google Scholar]
- 36. Carey ME, Sarna GS, Farrell JB. Brain edema following an experimental missile wound to the brain. J Neurotrauma 1990;7:13–20. [DOI] [PubMed] [Google Scholar]
- 37. Williams AJ, Hartings JA, Lu XC, Rolli ML, Dave JR, Tortella FC. Characterization of a new rat model of penetrating ballistic brain injury. J Neurotrauma 2005;22:313–331. [DOI] [PubMed] [Google Scholar]
- 38. Bauman RA, Ling G, Tong L, et al. An introductory characterization of a combat casualty‐care relevant swine model of closed head injury resulting from exposure to explosive blast. J Neurotrauma 2009;26:841–860. [DOI] [PubMed] [Google Scholar]
- 39. Long JB, Bentley TL, Wessner KA, Cerone C, Sweeney S, Bauman RA. Blast overpressure in rats: Recreating a battlefield injury in the laboratory. J Neurotrauma 2009;26:827–840. [DOI] [PubMed] [Google Scholar]
- 40. Cernak I, Noble‐Haeusslein LJ. Traumatic brain injury: An overview of pathobiology with emphasis on military populations. J Cereb Blood Flow Metab 2010;30:255–266. [DOI] [PMC free article] [PubMed] [Google Scholar]
- 41. Reneer DV, Hisel RD, Hoffman JM, Kryscio RJ, Lusk BT, Geddes JW. A multi‐mode shock tube for investigation of blast‐induced traumatic brain injury. J Neurotrauma 2011;28:95–104. [DOI] [PMC free article] [PubMed] [Google Scholar]
- 42. De Olmos J, Hardy H, Heimer L. The afferent connections of the main and the accessory olfactory bulb formations in the rat: An experimental HRP‐study. J Comp Neurol 1978;181:213–244. [DOI] [PubMed] [Google Scholar]
- 43. Otto T, Schottler F, Staubli U, Eichenbaum H, Lynch G. Hippocampus and olfactory discrimination learning: Effects of entorhinal cortex lesions on olfactory learning and memory in a successive‐cue, go‐no‐go task. Behav Neurosci 1991;105:111–119. [DOI] [PubMed] [Google Scholar]
- 44. Vanderwolf CH. The hippocampus as an olfacto‐motor mechanism: Were the classical anatomists right after all? Behav Brain Res 2001;127:25–47. [DOI] [PubMed] [Google Scholar]
- 45. Shojo H, Kaneko Y, Mabuchi T, Kibayashi K, Adachi N, Borlongan CV. Genetic and histologic evidence implicates role of inflammation in traumatic brain injury‐induced apoptosis in the rat cerebral cortex following moderate fluid percussion injury. Neuroscience 2010;171:1273–1282. [DOI] [PubMed] [Google Scholar]
- 46. Helmy A, Carpenter KL, Menon DK, Pickard JD, Hutchinson PJ. The cytokine response to human traumatic brain injury: Temporal profiles and evidence for cerebral parenchymal production. J Cereb Blood Flow Metab 2011;31:658–670. [DOI] [PMC free article] [PubMed] [Google Scholar]
- 47. Giunta B, Obregon D, Velisetty R, Sanberg PR, Borlongan CV, Tan J. The immunology of traumatic brain injury: A prime target for Alzheimer's disease prevention. J Neuroinflammation 2012;9:185. [DOI] [PMC free article] [PubMed] [Google Scholar]
- 48. Acosta SA, Tajiri N, Shinozuka K, et al. Long‐term upregulation of inflammation and suppression of cell proliferation in the brain of adult rats exposed to traumatic brain injury using the controlled cortical impact model. PLoS ONE 2013;8:e53376. [DOI] [PMC free article] [PubMed] [Google Scholar]
- 49. Hernandez‐Ontiveros DG, Tajiri N, Acosta S, Giunta B, Tan J, Borlongan CV. Microglia activation as a biomarker for traumatic brain injury. Front Neurol 2013;4:30. [DOI] [PMC free article] [PubMed] [Google Scholar]
- 50. Tajiri N, Hernandez D, Acosta S, et al. Suppressed cytokine expression immediatey following traumatic brain injury in neonatal rats indicates an expeditious endogenous anti‐inflammatory response. Brain Res 2014;1559:65–71. [DOI] [PMC free article] [PubMed] [Google Scholar]
- 51. Steuer E, Schaefer ML, Belluscio L. Using the olfactory system as an in vivo model to study traumatic brain injury and repair. J Neurotrauma 2014;31:1277–1291. [DOI] [PMC free article] [PubMed] [Google Scholar]
- 52. Schofield PW, Moore TM, Gardner A. Traumatic brain injury and olfaction: A systematic review. Front Neurol 2014;5:1–22. [DOI] [PMC free article] [PubMed] [Google Scholar]
- 53. Ohab JJ, Carmichael ST. Poststroke neurogenesis: Emerging principles of migration and localization of immature neurons. Neuroscientist 2008;14:369–380. [DOI] [PubMed] [Google Scholar]
- 54. Kaneko Y, Tajiri N, Yu S, et al. Nestin overexpression precedes caspase‐3 upregulation in rats exposed to controlled cortical impact traumatic brain injury. Cell Med 2012;4:55–63. [DOI] [PMC free article] [PubMed] [Google Scholar]
- 55. Kernie SG, Parent JM. Forebrain neurogenesis after focal Ischemic and traumatic brain injury. Neurobiol Dis 2010;37:267–274. [DOI] [PMC free article] [PubMed] [Google Scholar]
- 56. Zhao S, Zhao Y, Xiao T, Zhao M, Jolkkonen J, Zhao C. Increased neurogenesis contributes to the promoted behavioral recovery by constraint‐induced movement therapy after stroke in adult rats. CNS Neurosci Ther 2013;19:194–196. [DOI] [PMC free article] [PubMed] [Google Scholar]
- 57. Sun D, McGinn MJ, Zhou Z, Harvey HB, Bullock MR, Colello RJ. Anatomical integration of newly generated dentate granule neurons following traumatic brain injury in adult rats and its association to cognitive recovery. Exp Neurol 2007;204:264–272. [DOI] [PubMed] [Google Scholar]
- 58. Dash PK, Mach SA, Moore AN. Enhanced neurogenesis in the rodent hippocampus following traumatic brain injury. J Neurosci Res 2001;63:313–319. [DOI] [PubMed] [Google Scholar]
- 59. Rola R, Mizumatsu S, Otsuka S, et al. Alterations in hippocampal neurogenesis following traumatic brain injury in mice. Exp Neurol 2006;202:189–199. [DOI] [PubMed] [Google Scholar]