

Abstract
Evidence suggests that oligomers of the 42-residue form of the amyloid β-protein (Aβ), Aβ42 play a critical role in the etiology of Alzheimer’s disease (AD). Here we use high resolution atomic force microscopy to directly image populations of small oligomers of Aβ42 that occur at the earliest stages of aggregation. We observe features that can be attributed to monomer and to relatively small oligomers, including dimers, hexamers, and dodecamers. We discovered that Aβ42 hexamers and dodecamers quickly become the dominant oligomers after peptide solubilization, even at low (1 μM) concentrations and short (5 min) incubation times. Soon after (≥10 min), dodecamers are observed to seed the formation of extended, linear pre-protofibrillar β-sheet structures. The pre-protofibrils are a single Aβ42 layer in height and can extend several hundred nanometers in length. To our knowledge this is the first report of structures of this type. In each instance the pre-protofibril is associated off center with a single layer of a dodecamer. Protofibril formation continues at longer times, but is accompanied by the formation of large, globular aggregates. Aβ40, by contrast, does not significantly form the hexamer or dodecamer but instead produces a mixture of smaller oligomers. These species lead to the formation of a branched chain-like network rather than discrete structures.
Graphical abstract
The amyloid β-protein (Aβ) is thought to play a seminal role in Alzheimer's disease (AD).1 Aβ is produced by serial endoproteolytic cleavage of the amyloid precursor protein, a type I transmembrane protein. These cleavages give rise to various forms of Aβ that differ in length at their C-termini. The most abundant of these are 40 (Aβ40) or 42 (Aβ42) residues long (Scheme S1). Although the nominal concentration of Aβ40 in humans is approximately 10 times that of Aβ42, the latter peptide is most tightly linked to AD pathogenesis.2 Early studies suggested that Aβ fibril formation was the seminal neuropathogenic event in AD.3 For this reason, both Aβ40 and Aβ42 have been the subject of extensive studies of peptide aggregation.4–6 However, recent evidence has shown that soluble oligomeric forms of Aβ now appear to be the most important effectors of the disease.1,7–9 If so, the development of oligomerization inhibitors would be facilitated by a more rigorous understanding of the mechanisms by which initial Aβ dimerization, and higher-order oligomer assembly, occur.10 The Aβ monomer has been shown by NMR to fold into a strand-loop-strand conformation stabilized by intramolecular β-strand interactions. This folded conformation appears to facilitate the formation of the extended β-sheets that form mature amyloid fibrils.11–13 It has been suggested in AFM studies that small Aβ oligomers act as seeds that induce oligomerization of adjacent monomers, similar to the mechanism of template-mediated prion conversion.6,14,15 Studies using ion-mobility based mass spectrometry (IMS-MS) have attempted to address exactly which types of oligomers are formed and whether these oligomers act as seeds for fibril growth.16,17 These studies revealed that even order oligomers were dominant, 2, 4, 6 and 12 with high populations of hexamers and dodecomers.17 The role played by these oligomers remains an open question, however. Understanding the amyloid initiation and growth mechanism in Aβ would be very helpful in identifying therapeutic targets for effective AD disease treatment. We address this point later in this Communication
Atomic Force Microscopy (AFM) is an effective tool for visualizing large Aβ structures such as fibrils,6,14,15,18–21 and can also be used to gain information on the mechanical properties of these structures.22–23 Using AFM as a technique to image smaller structures such as monomers, dimers, and other small oligomers is highly desirable but carries with it significant challenges. The details of the AFM methods we use are given in Supporting Information. AFM techniques by their nature have excellent vertical resolution, but their horizontal resolution is dependent on the geometry of the AFM tip. Folded Aβ monomers are extremely small (~2nm in diameter),24,25 which makes them difficult to resolve unless extremely sharp AFM tips are used. The Smith group at SUNY Stony Brook used super sharp tips to collect images of Aβ42 at early stages of aggregation.6,26,27 They were able to distinguish various oligomers and to propose a model for how their growth occurs.26 They theorize that β-sheet like dimers can directly associate to form protofibrils which then go on to can be formed in a parallel pathway and these oligomers eventually rearrange to form fibrils. However, certain of the conclusions of this study do not agree well with other models for oligomer aggregation.16,17,28 Here, we seek to obtain a more complete picture of the time dependence of the oligomer population in solution by altering the sample preparation technique.
Figure 1 shows representative AFM topography images of Aβ42 using super sharp tips at solution incubation times of 5 and 10 min. In all images shown here the sample has been directly deposited on the mica surface without further treatment. We found rinsing the surface following deposition resulted in removal of a large fraction of deposited material making it impossible to follow structural evolution as incubation time increased. See SI for details. At 5 min, we see almost exclusively small circular aggregates with heights principally between 0.75 and 1.50 nm. We attribute these features to single (0.75 nm) or double (1.5 nm) layers of Aβ42. Most of these features have a circular profile consistent with previous AFM studies.6,26,27 The observed diameters are 10 to 15 nm measured by the base width. Previous IMS-MS data show the dominant oligomers in solution under conditions similar to those used here are hexamers and dodecamers.16,17 The cross sections reported for the hexamer and dodecamer structures agree well with the dimensions of the features in Figure 1A after tip deconvolution.16,17 Hence, given the circular profile and the measured dimensions we assign the features in Figure 1 with heights under 1 nm as hexamers and those near 1.5 nm as dodecamers. We also see a very low density of structures at 2.25 nm and 3 nm heights. These are not predicted to be abundant based on mass spectrometry studies.16,17 It is possible that these larger features correspond to amorphous aggregates of several smaller oligomers as they often have a larger diameter (~25 nm) than the hexamer or dodecamer.
Figure 1.

Representative AFM topography images of Aβ42 after (A) 5 and (B) 10 minutes of incubation in a 1 μM solution. Below each image are line cuts illustrating the heights of the observed features. In (A) features A, B, and C indicate Aβ hexamers, and D, E, and F indicate Aβ dodecamers consisting of two stacked hexamers. (B) shows that hexamers and dodecamers are still present after 10 minutes. Features C and G show a pre-protofibril structure.
In the bottom half of Figure 1A are plotted line cuts through selected features in the image above giving the heights along the line. Features A, B and C have heights less than 1 nm associated with single layer oligomers. We assign these features to hexamers. Features D, E and F are approximately twice as high as A, B and C and hence we assign these features as dodecamers. There are no elongated, fibril like features present at 5 min incubation time.
In Figure 1B is an image taken at a 10 min incubation time. Many of the 5 min features are still present but new features are also evident. For example, in the upper left of Figure 1B is what appears to be 6 circular objects interacting with each other to form a quasi-circular construct (see arrow in Figure 1B). Height and width measurements indicate each of the 6 individual features are hexamers (data not shown). Such a feature is rare and does not increase in frequency with incubation time but does indicate there is a tendency for hexamers to interact with each other in this manner. Even more interesting is the appearance of a long, narrow filament like structure in the right half of the image (over 200 nm long). Line cut height data (given below the image) indicate features B and F are dodecamers while A,D,E and H are hexamers. The 200 nm filament is 0.7 nm high (features C and G) and has an average width of approximately 10 nm. Given its physical characteristics we term this feature as a “pre-protofibril” and discuss it in more detail shortly.
Longer time images are given in Figure 2. By 20 minutes the density of pre-protofibrils has grown considerably. The line cut E verifies these abundant species have heights of only 0.7 nm and widths of approximately 10 nm. Their lengths are clearly greater than 250 nm as they extend beyond the image area in both directions. The larger spherical aggregates have also grown in frequency while the dodecamers and hexamers, although diminished in relative frequency, are still present (line cut A,B). These trends continue as evidenced by the 60 minute image given in Figure 2B. Here clumping of the large spherical aggregates is clearly observed, consistent with earlier AFM studies taken at higher concentrations and longer incubation times.26,27
Figure 2.

Representative AFM topography images of Aβ42 after (A) 20 and (B) 60 minutes of incubation in a 1 μM solution. Below each image are line cuts illustrating the heights of the observed features. (A) shows that after 20 minutes while dodecamers sized structures are still present (features A and B) a much higher density of larger globular aggregates has also formed (features C and D). Also present is a much larger amount of the pre-protofibril structures shown by feature E. (B) shows that after 60 minutes, large globular aggregates have come to dominate the morphology.
In summary we emphasize the solution evolution of the features observed in Figures 2 and 3. In all cases the solution spent approximate 2 minutes being vacuum dried after being drop cast on the mica. As a consequence, the different structures observed are directly related to the incubation time in solution and not to surface-Aβ interactions. This point is more fully discussed in the supporting information.
Figure 3.

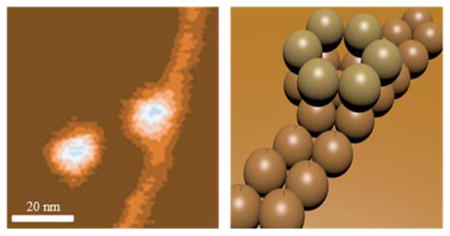
Topographic image (A) of Aβ42 cast from a 1 μM solution after 10 minutes of incubation showing the interaction between dodecamers and extended protofibrils. (B) shows a schematic cartoon of this growth mechanism.
A portion of the 10 minute image is expanded and given as Figure 3A. There are two circular features shown as well as a portion of the pre-protofibril. The left most feature is feature F in Figure 1B and has been assigned as a dodecamer. The second circular feature is also a dodecamer as determined by height and width measurements (data not shown). The most interesting and important aspect of this image is the fact the long pre-protofibril appears to be growing out of the lower hexamer of the dodecamer. There has long been a view that Aβ fibrils were seeded by smaller structures but until now there has been no direct evidence of the nature of the seed. There are essentially two limiting mechanisms that have been put forward for fibril growth in Aβ solutions.1,27,29 The first one involves initial formation of a “seed” oligomer followed by monomer templating and addition to form β-sheet structured prefibrils that eventually become fibrils (the nucleated polymerization mechanism).30 The second involves Aβ oligomer condensation to form protofibrils directly (the nucleated conformational conversion pathway).31 In this latter pathway it is ambiguous how and when β-sheet based structures are formed.
In time sequence, dodecamers appear early on and then later in time filaments appear and are always associated with dodecamers (Figures 1 and 3). Hence the data strongly implicate the dodecamers are the seeds for the earliest fibril formation. These pre-protofibrils have all of the physical characteristics of the β-sheet structures found experimentally in Aβ42 fibrils.32 This is, to our knowledge, the first direct observation of the connection between known Aβ42 assemblies (hexamers and dodecamers) and the fibrils themselves.16,17 This observation unambiguously shows the dodecamer as “on pathway” for fibril formation, an unanswered question up to this point. There has previously been evidence that the dodecamer is a likely proximate toxic agent in transgenic mice studies.33 Hence there must be a delicate interplay between the dodecamer acting as the toxic agent in AD and its tendency to seed fibril formation. The latter process produces insoluble aggregates that are less toxic than the oligomers and may actually be protective.34 The Aβ42 dodecamer is emerging as the central player in the molecular basis for Alzheimer’s disease.
The dominant alloform of the Aβ-protein in vivo is Aβ40, typically making up 90% of the Aβ-protein present.2 Previous studies have indicated that Aβ40 forms fibrils more slowly than Aβ42 and by a different mechanism.35,36 IMS-MS experiments unambiguously showed Aβ40 forms tetramers as the terminal oligomer species while Aβ42 formed dodecamers as the terminal oligomer species.16,17 Our AFM results for Aβ40 are summarized in Figure 4.
Figure 4.

Representative AFM topography images of Aβ40 incubated after (A) 5 and (B) 30 minutes of incubation in a 1 μM solution. Below each image is a line cut to illustrate the height of the features present. In (A) the morphology is dominated by much smaller features than were observed at this time for Aβ42. (B) shows a peptide film of constant height that deposited onto the surface suggesting that most of the protein remains in the monomer or other low order oligomer state, weakly associated in solution.
Figure 4A shows a low density of spherical features. The mica surface is coated with monomers and very small oligomers (dimers and tetramers) with the occasional larger spherical aggregate as shown by the line cut below the image. At longer incubation times the few spherical aggregates diminish in frequency as shown in the 30 minute image in Figure 4B. This image is dominated by a highly branched network of chain-like segments 1 nm or less in height and 10 nm in width on average, suggesting the network is β-sheet in character.32 This network continues to develop at longer times until monomer and small oligomers are no longer available (data not shown). At no time frame (5 to 60 min) do we observe long single pre-protofibrils in any of the Aβ40 images, nor do we observe the onset of any portion of this branched network with a specific oligomer as was observed for Aβ42 (Figure 3). These results are fully consistent with earlier ion mobility studies where oligomer formation in Aβ40 terminated at the tetramer.16 They also correlate with the fact that Aβ40 is much less toxic than Aβ42 and that oligomers of Aβ40 were not observed in transgenic mice studies while those of Aβ42 were observed.33,34 In addition it has been observed that hetero-oligomers of Aβ40 and Aβ42 terminate at the tetramer which suggests that Aβ40 is cyto-protective rather than cyto-toxic.37
In summary, we have used high resolution atomic force microscopy to probe the earliest stages of Aβ aggregation. We have shown direct evidence that Aβ42 undergoes rapid formation of hexamers and dodecamers with the dodecamers seeding the formation of extended pre-protofibrils. Larger globular structures form at longer incubation times. Aβ40, on the other hand, undergoes a different assembly mechanism where hexamers and dodecamers are not involved resulting in the formation of what appear to be branched β-sheet structures and a much lower frequency of large globular aggregates. These results are fully consistent with earlier data from IMS-MS and other methods and give molecular insight into why Aβ42 is the central player in the molecular basis of Alzheimer’s disease and why Aβ40 is not.
Supplementary Material
Acknowledgments
We are grateful to acknowledge the support of the National Institute of Health grant number 1R01AG047116-01 (M.T.B).
Footnotes
Notes The authors declare no competing financial interest.
Included are the AFM methodology used, sample preparation techniques, images comparing the rinse and no rinse sample preparations methods, larger scale (5μM) images of Aβ42 at each incubation time and Aβ40 after 30 minutes. This material is available free of charge via the Internet at http://pubs.acs.org.
References
- 1.Roychaudhuri R, Yang M, Hoshi MM, Teplow DB. J Biol Chem. 2009;284:4749. doi: 10.1074/jbc.R800036200. [DOI] [PMC free article] [PubMed] [Google Scholar]
- 2.Younkin SG. Ann Neurol. 1995;37:287. doi: 10.1002/ana.410370303. [DOI] [PubMed] [Google Scholar]
- 3.Hardy J, Higgins G. Science. 1992;256:184. doi: 10.1126/science.1566067. [DOI] [PubMed] [Google Scholar]
- 4.Snyder S, Ladror U, Wade W, Wang G, Barrett L, Matayoshi E, Huffaker H, Krafft G, Holzman T. Biophys J. 1994;67:1216. doi: 10.1016/S0006-3495(94)80591-0. [DOI] [PMC free article] [PubMed] [Google Scholar]
- 5.Goldsbury CS, Wirtz S, Müller SA, Sunderji S, Wicki P, Aebi U, Frey P. J Struct Biol. 2000;130:217. doi: 10.1006/jsbi.2000.4259. [DOI] [PubMed] [Google Scholar]
- 6.Ahmed M, Davis J, Aucoin D, Sato T, Ahuja S, Aimoto S, Elliott JI, Van Nostrand WE, Smith SO. Nat Struct Mol Biol. 2010;17:561. doi: 10.1038/nsmb.1799. [DOI] [PMC free article] [PubMed] [Google Scholar]
- 7.Harper JD, Wong SS, Lieber CM, Lansbury PT., Jr Chem Biol. 1997;4:119. doi: 10.1016/s1074-5521(97)90255-6. [DOI] [PubMed] [Google Scholar]
- 8.Bernhardt NA, Berhanu WM, Hansmann UHE. J Phys Chem B. 2013;117:16076. doi: 10.1021/jp409777p. [DOI] [PMC free article] [PubMed] [Google Scholar]
- 9.Demuro A, Mina E, Kayed R, Milton SC, Parker I, Glabe CG. J Biol Chem. 2005;280:17294. doi: 10.1074/jbc.M500997200. [DOI] [PubMed] [Google Scholar]
- 10.Teplow DB. Alzheimers Res Ther. 2013;5:39. doi: 10.1186/alzrt203. [DOI] [PMC free article] [PubMed] [Google Scholar]
- 11.Hou LM, Shao HY, Zhang YB, Li H, Menon NK, Neuhaus EB, Brewer JM, Byeon IJL, Ray DG, Vitek MP, Iwashita T, Makula RA, Przybyla AB, Zagorski MG. J Am Chem Soc. 2004;126:1992. doi: 10.1021/ja036813f. [DOI] [PubMed] [Google Scholar]
- 12.Sticht H, Bayer P, Willbold D, Dames S, Hilbich C, Beyreuther K, Frank RW, Rosch P. Eur J Biochem. 1995;233:293. doi: 10.1111/j.1432-1033.1995.293_1.x. [DOI] [PubMed] [Google Scholar]
- 13.Vivekanandan S, Brender JR, Lee SY, Ramamoorthy A. Biochem Biophys Res Commun. 2011;411:312. doi: 10.1016/j.bbrc.2011.06.133. [DOI] [PMC free article] [PubMed] [Google Scholar]
- 14.Harper JD, Lieber CM, Lansbury PT., Jr Chem Biol. 1997;4:951. doi: 10.1016/s1074-5521(97)90303-3. [DOI] [PubMed] [Google Scholar]
- 15.Serem WK, Bett CK, Ngunjiri JN, Garno JC. Microsc Res Tech. 2011;74:699. doi: 10.1002/jemt.20940. [DOI] [PubMed] [Google Scholar]
- 16.Bernstein SL, Dupuis NF, Lazo ND, Wyttenbach T, Condron MM, Bitan G, Teplow DB, Shea JE, Ruotolo BT, Robinson CV, Bowers MT. Nat Chem. 2009;1:326. doi: 10.1038/nchem.247. [DOI] [PMC free article] [PubMed] [Google Scholar]
- 17.Bernstein SL, Wyttenbach T, Baumketner A, Shea JE, Bitan G, Teplow DB. J Am Chem Soc. 2005;127:2075. doi: 10.1021/ja044531p. [DOI] [PubMed] [Google Scholar]
- 18.Parbhu A, Lin H, Thimm J, Lal R. Peptides. 2002;23:1265. doi: 10.1016/s0196-9781(02)00061-x. [DOI] [PubMed] [Google Scholar]
- 19.Qiang W, Kelley K, Tycko R. J Am Chem Soc. 2013;135:6860. doi: 10.1021/ja311963f. [DOI] [PMC free article] [PubMed] [Google Scholar]
- 20.Zhou X, Zhang Y, Zhang F, Pillai S, Liu J, Li R, Dai B, Li B, Zhang Y. Nanoscale. 2013;5:4816. doi: 10.1039/c3nr00886j. [DOI] [PubMed] [Google Scholar]
- 21.Stine WB, Snyder SW, Ladror US, Wade WS, Miller MF, Perun TJ, Holzman TF, Krafft GA. J Protein Chem. 1996;15:193. doi: 10.1007/BF01887400. [DOI] [PubMed] [Google Scholar]
- 22.Raman EP, Takeda T, Barsegov V, Klimov DK. J Mol Biol. 2007;373:785. doi: 10.1016/j.jmb.2007.08.034. [DOI] [PubMed] [Google Scholar]
- 23.Hane FT, Lee BY, Petoyan A, Rauk A, Leonenko Z. Biosens Bioelectron. 2014;54:492. doi: 10.1016/j.bios.2013.10.060. [DOI] [PubMed] [Google Scholar]
- 24.Losic D, Martin LL, Mechler A, Aguilar MI, Small DH. J Struct Biol. 2006;155:104. doi: 10.1016/j.jsb.2006.02.013. [DOI] [PubMed] [Google Scholar]
- 25.Baumketner A, Bernstein SL, Wyttenbach T, Bitan G, Teplow DB, Bowers MT, Shea JE. Prot Sci. 2006;15:420. doi: 10.1110/ps.051762406. [DOI] [PMC free article] [PubMed] [Google Scholar]
- 26.Mastrangelo IA, Ahmed M, Sato T, Liu W, Wang C, Hough P, Smith SO. J Mol Biol. 2006;358:106. doi: 10.1016/j.jmb.2006.01.042. [DOI] [PubMed] [Google Scholar]
- 27.Fu Z, Aucoin D, Davis J, Van Nostrand WE, Smith SO. Biochemistry. 2015;54:4197. doi: 10.1021/acs.biochem.5b00467. [DOI] [PubMed] [Google Scholar]
- 28.Bleiholder C, Dupuis NF, Wyttenbach T, Bowers MT. Nat Chem. 2011;3:172. doi: 10.1038/nchem.945. [DOI] [PMC free article] [PubMed] [Google Scholar]
- 29.Cohen SIA, Linse S, Luheshi LM, Hellstrand E, White DA, Rajah L, Otzen DE, Vendruscolo M, Dobson CM, Knowles TPJ. Proc Natl Acad Sci. 2013;110:9758. doi: 10.1073/pnas.1218402110. [DOI] [PMC free article] [PubMed] [Google Scholar]
- 30.Harper JD, Lansbury PT. Annu Rev Biochem. 1997;66:385. doi: 10.1146/annurev.biochem.66.1.385. [DOI] [PubMed] [Google Scholar]
- 31.Serio TR, Cashikar AG, Kowal AS, Sawicki GJ, Moslehi JJ, Serpell L, Arnsdorf MF, Lindquist SL. Science. 2000;289:1317. doi: 10.1126/science.289.5483.1317. [DOI] [PubMed] [Google Scholar]
- 32.Walsh DM, Lomakin A, Benedek GB, Condron MM, Teplow DB. J Biol Chem. 1997;272:22364. doi: 10.1074/jbc.272.35.22364. [DOI] [PubMed] [Google Scholar]
- 33.Lesné S, Koh MT, Kotilinek L, Kayed R, Glabe CG, Yang A, Gallagher M, Ashe KH. Nature. 2006;440:352. doi: 10.1038/nature04533. [DOI] [PubMed] [Google Scholar]
- 34.Cheng IH, Scearce-Levie K, Legleiter J, Palop JJ, Gerstein H, Bien-Ly N, Puoliväli J, Lesné S, Ashe KH, Muchowski PJ, Mucke L. J Biol Chem. 2007;282:23818. doi: 10.1074/jbc.M701078200. [DOI] [PubMed] [Google Scholar]
- 35.Bitan G, Kirkitadze MD, Lomakin A, Vollers SS, Benedek GB, Teplow DB. Proc Natl Acad Sci. 2003;100:330. doi: 10.1073/pnas.222681699. [DOI] [PMC free article] [PubMed] [Google Scholar]
- 36.Roychaudhuri R, Yang M, Deshpande A, Cole GM, Frautschy S, Lomakin A, Benedek GB, Teplow DB. J Biol Chem. 2013;425:292. doi: 10.1016/j.jmb.2012.11.006. [DOI] [PMC free article] [PubMed] [Google Scholar]
- 37.Murray MM, Bernstein SL, Nyugen V, Condron MM, Teplow DB, Bowers MT. J Am Chem Soc. 2009;131:6316. doi: 10.1021/ja8092604. [DOI] [PMC free article] [PubMed] [Google Scholar]
Associated Data
This section collects any data citations, data availability statements, or supplementary materials included in this article.