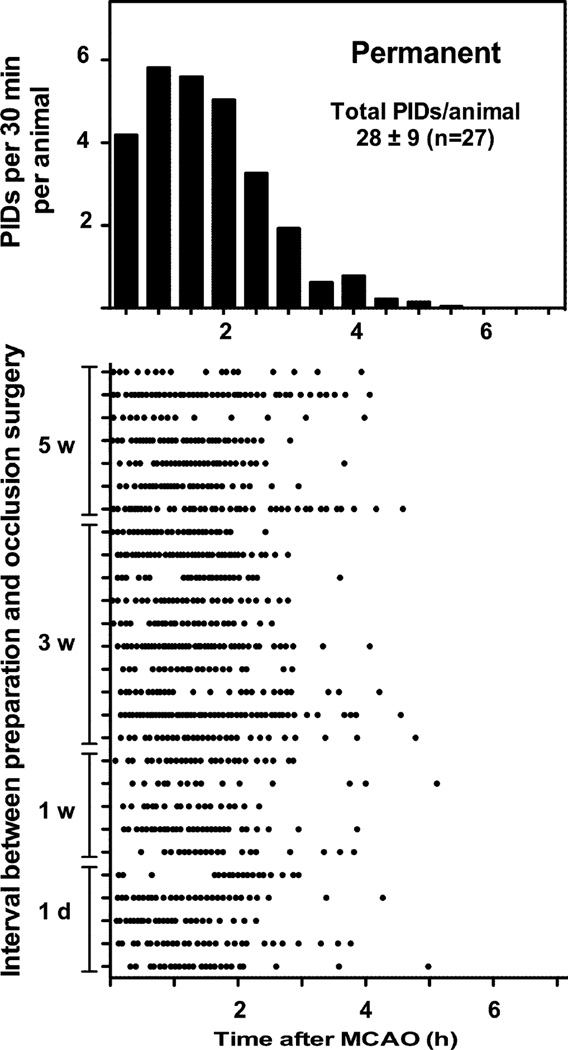
Fig. 4.
PID time course after permanent MCA occlusion. Upper panel represents a histogram of data shown in the lower panel, in which each row represents an individual animal and each point a PID. Animals recorded in the awake state following brief anesthesia for occlusion surgery exhibited a rapid time course of PID evolution, essentially all events occurring within 4 hours after the onset of ischemia. The interval between electrode placement and occlusion surgery did not impact PID time course (lower panel).

